

Article Figures & Data
Figures
- Figure 1.
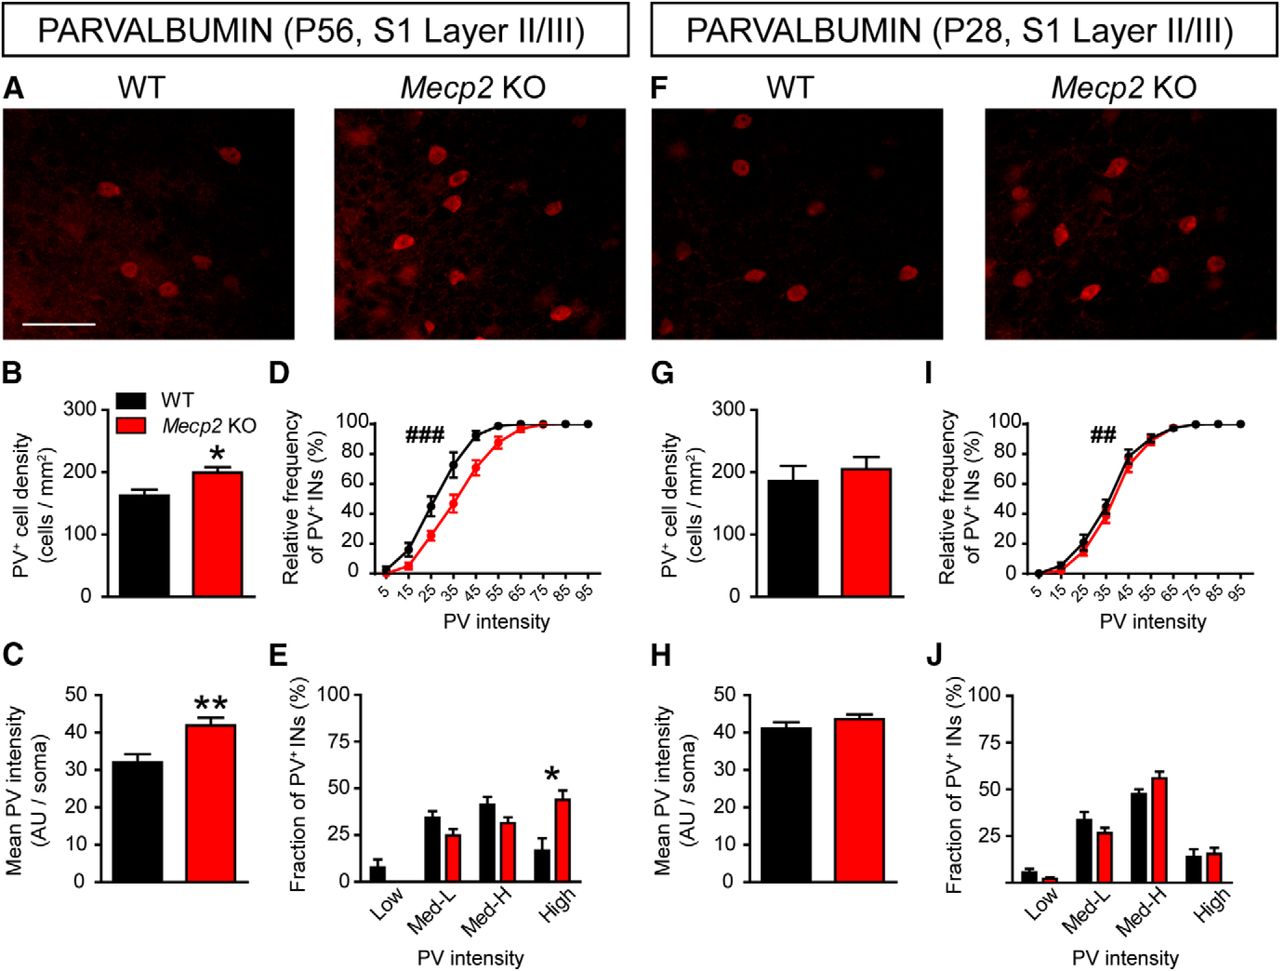
Atypical high-PV expression in the S1 cortex of Mecp2 KO mice. A, Representative images showing PV labeling in layer II/III of S1 cortex in WT and Mecp2 KO mice at P56. Histograms showing quantitative analysis of PV+ cell density (B), PV mean fluorescence intensity (C), cumulative (D) and binned (E) frequency distribution of PV cells intensity in WT and Mecp2 KO mice at P56. F, Representative images showing PV labeling in layer II/III of S1 cortex in WT and Mecp2 KO mice at P28. Histograms showing quantitative analysis of PV cell density (G), PV mean fluorescence intensity (H), cumulative (I) and binned (J) frequency distribution of PV cells intensity in WT and Mecp2 KO mice at P28. n = 6 mice per genotype. Student’s t test: *p < 0.05, **p < 0.01, Mann–Whitney U test for D, I: ##p < 0.01; ###p < 0.001. Scale bar = 100 μm.
- Figure 2.
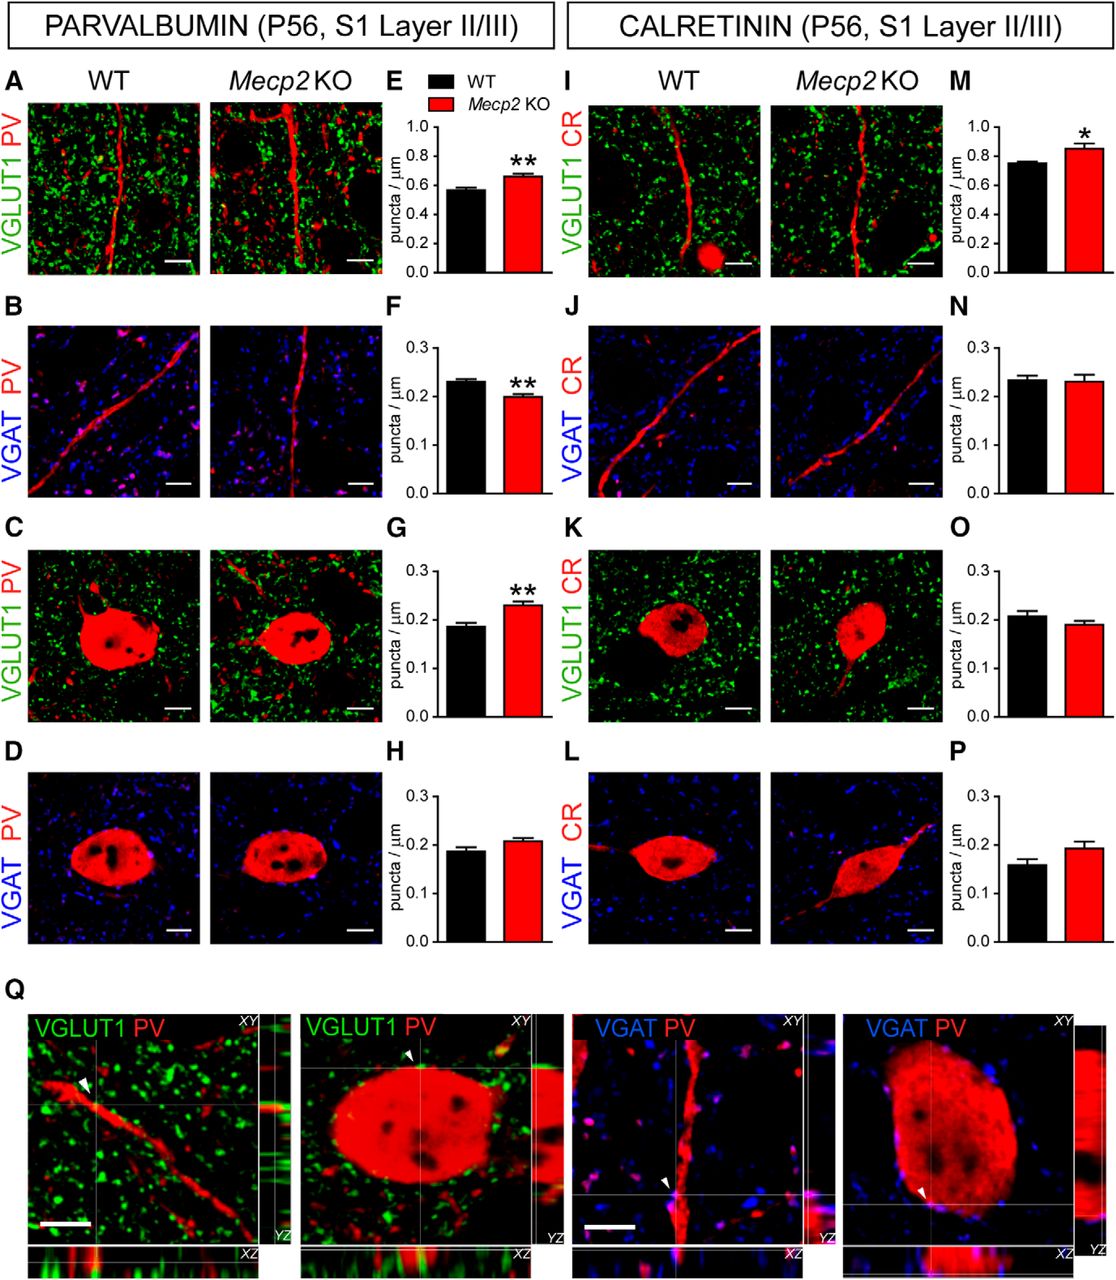
Distribution of excitatory and inhibitory presynaptic terminals onto PV+ and CR+ INs in P56 Mecp2 KO mice. Representative confocal images of VGLUT1+ (green: A, C) and VGAT+ (blue: B, D) puncta corresponding to excitatory and inhibitory presynaptic terminals, respectively, apposed to dendrites (top) and somata (bottom) of PV+ INs in layer II/III of S1 cortex in P56 WT and Mecp2 KO mice. Histograms showing quantitative analysis in WT and Mecp2 KO mice of VGLUT1+ and VGAT+ puncta density contacting either dendrites (E, F) or somata (G, H), respectively, of PV+ INs. Confocal images showing VGLUT1+ (green: I, K) and VGAT+ (blue: J, L) puncta contacting dendrites (top) and somata (bottom) of CR+ INs in layer II/III of S1 cortex in WT and Mecp2 KO mice. Histograms showing quantitative analysis in WT and Mecp2 KO mice of VGLUT1+ and VGAT+ puncta density contacting either dendrites (M, N) or somata (O, P), respectively, of CR+ INs. PV: VGLUT1 n = 6 mice per genotype; VGAT dendrites n = 5 WT and 4 Mecp2 KO mice per genotype; VGAT soma n = 5 mice per genotype; CR: VGLUT1 n = 6 mice and VGAT n = 5 mice per genotype. Student’s t test: *p < 0.05; **p < 0.01. Q, Representative 3D projections in three image planes showing excitatory VGLUT1+ (green) and inhibitory VGAT+ (blue) synaptic terminals contacting PV+ cell bodies and dendrites (red). Arrowheads point to selected VGLUT1+ and VGAT+ puncta apposed to dendrites or somata of PV+ interneurons at the intersection of the XY cross. Note the lack of black pixels between the presynaptic puncta and the postsynaptic structures. Scale bars = 5 μm.
- Figure 3.
Distribution of excitatory and inhibitory presynaptic terminals onto PV+ INs in P28 Mecp2 KO mice. Representative confocal images of excitatory, VGLUT1+ (green: A, C) and inhibitory, VGAT+ (blue: B, D) synaptic terminals contacting PV+ (red) dendrites (top) and somata (bottom) in layer II/III of S1 cortex in P28 WT and Mecp2 KO mice. Histograms showing quantitative analysis in WT and Mecp2 KO mice of VGLUT1+ and VGAT+ puncta density contacting either dendrites (E, F) or somata (G, H), respectively, of PV+ INs. Representative confocal images of VGLUT1+ (green: I, K) and VGAT+ (blue: J, L) puncta contacting CR+ (red) dendrites (top) and somata (bottom) in layer II/III of S1 cortex in P28 Mecp2 KO mice and WT littermates. Histograms showing quantitative analysis in WT and Mecp2 KO mice of VGLUT1+ and VGAT+ puncta density contacting either dendrites (M, N) or somata (O, P), respectively, of CR+ INs. PV: GLUT1 dendrites n = 5 mice per genotype; GLUT1 soma n = 8 mice per genotype; VGAT n = 5 mice per genotype; CR: VGLUT1 and VGAT n = 5 mice per genotype. Student’s t test: **p < 0.01. Scale bars = 5 μm.
- Figure 4.
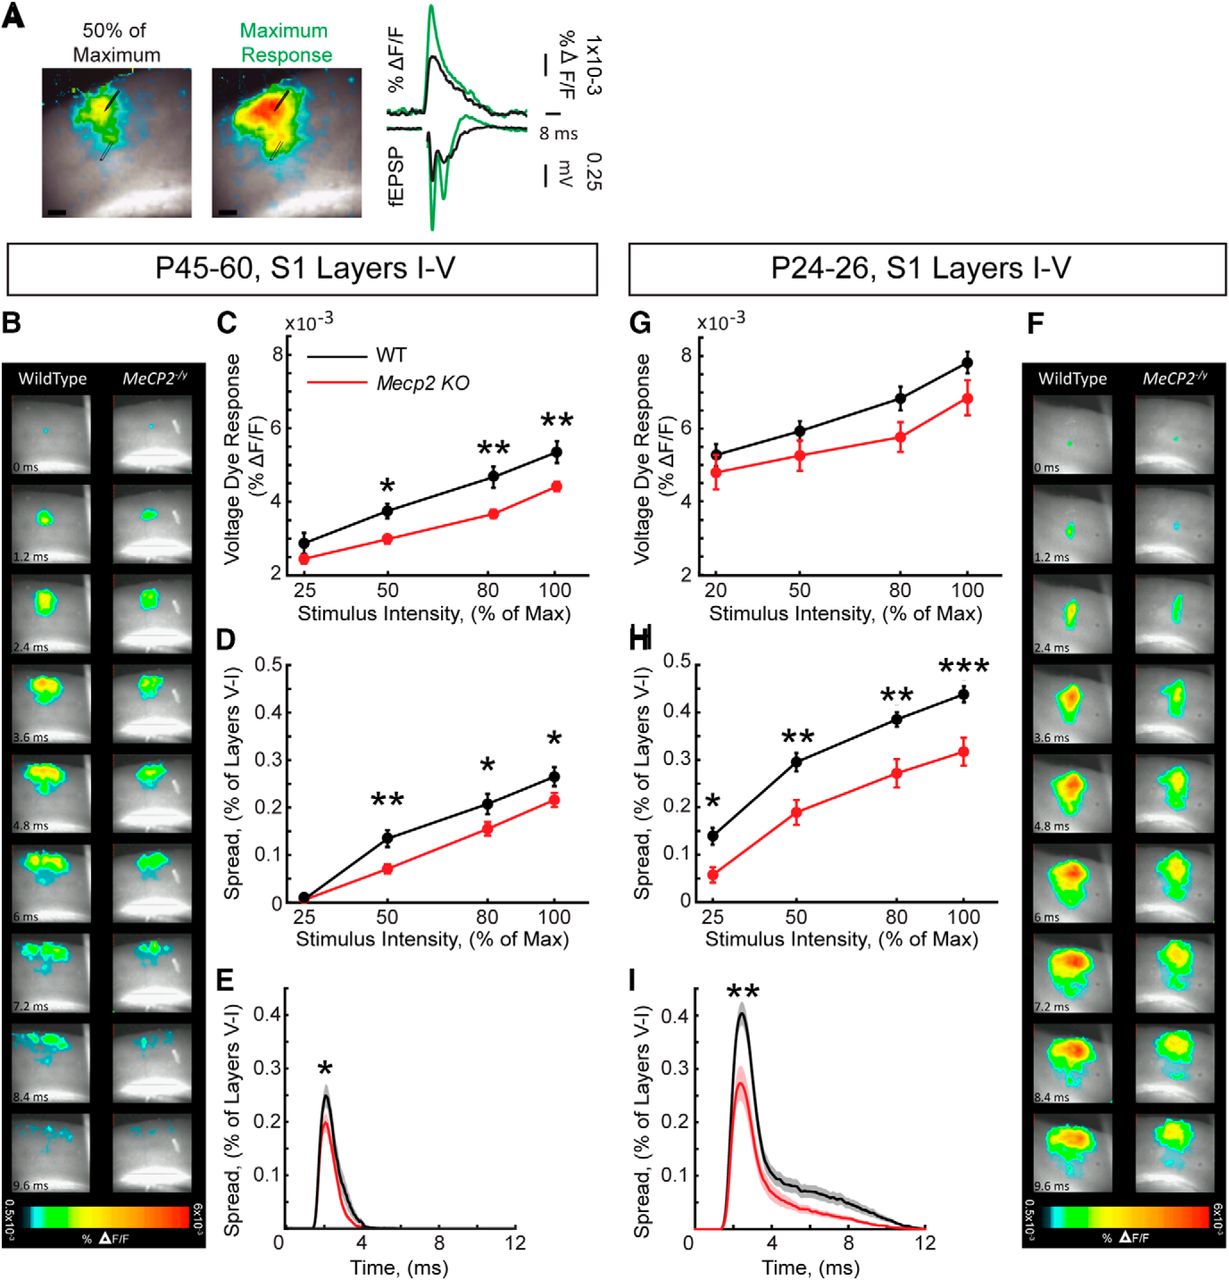
Smaller amplitude and spatial spread of synaptically induced neuronal depolarizations in layer II/III of S1 cortex in presymptomatic and symptomatic Mecp2 KO mice. A, Representative example (left) of a VSD-stained S1 slice with superimposed evoked VSD signals expressed as ΔF/F, and displayed in a pseudo-color scale (warmer colors represent larger VSD amplitudes). Representative examples (right) of fEPSPs and VSD ΔF/F traces at lower (50% maximum response) and higher (maximum response) stimulation intensities. B, F, Frames of representative time-lapse movies of VSD-stained slices during a single fEPSP in symptomatic (B) and presymptomatic (F) mice. C, G, Input-output relationship between afferent stimulus intensity and the amplitude of VSD signals expressed as % ΔF/F in symptomatic (C) and presymptomatic (G) mice. D, H, Input-output relationship between afferent stimulus intensity and the spatial spread of signal through cortical layers I–V in symptomatic (D) and presymptomatic (H) mice. E, I, Spatio-temporal spread of VSD signals at maximum response stimulation in symptomatic (E) and presymptomatic (I) mice. Solid lines represent the mean; shaded areas represent the standard error of the mean. n = 12 slices from 4 WT mice; n = 24 slices from 6 Mecp2 KO mice at P45-P50; n = 17 slices from 3 WT and Mecp2 KO mice at P24–P26. Two-way ANOVA and Bonferroni posthoc tests for C, D, G, H and t test of area under the curve for E, I. *p < 0.05, **p < 0.01, ***p < 0.001. Scale bars = 100 µm.
- Figure 5.
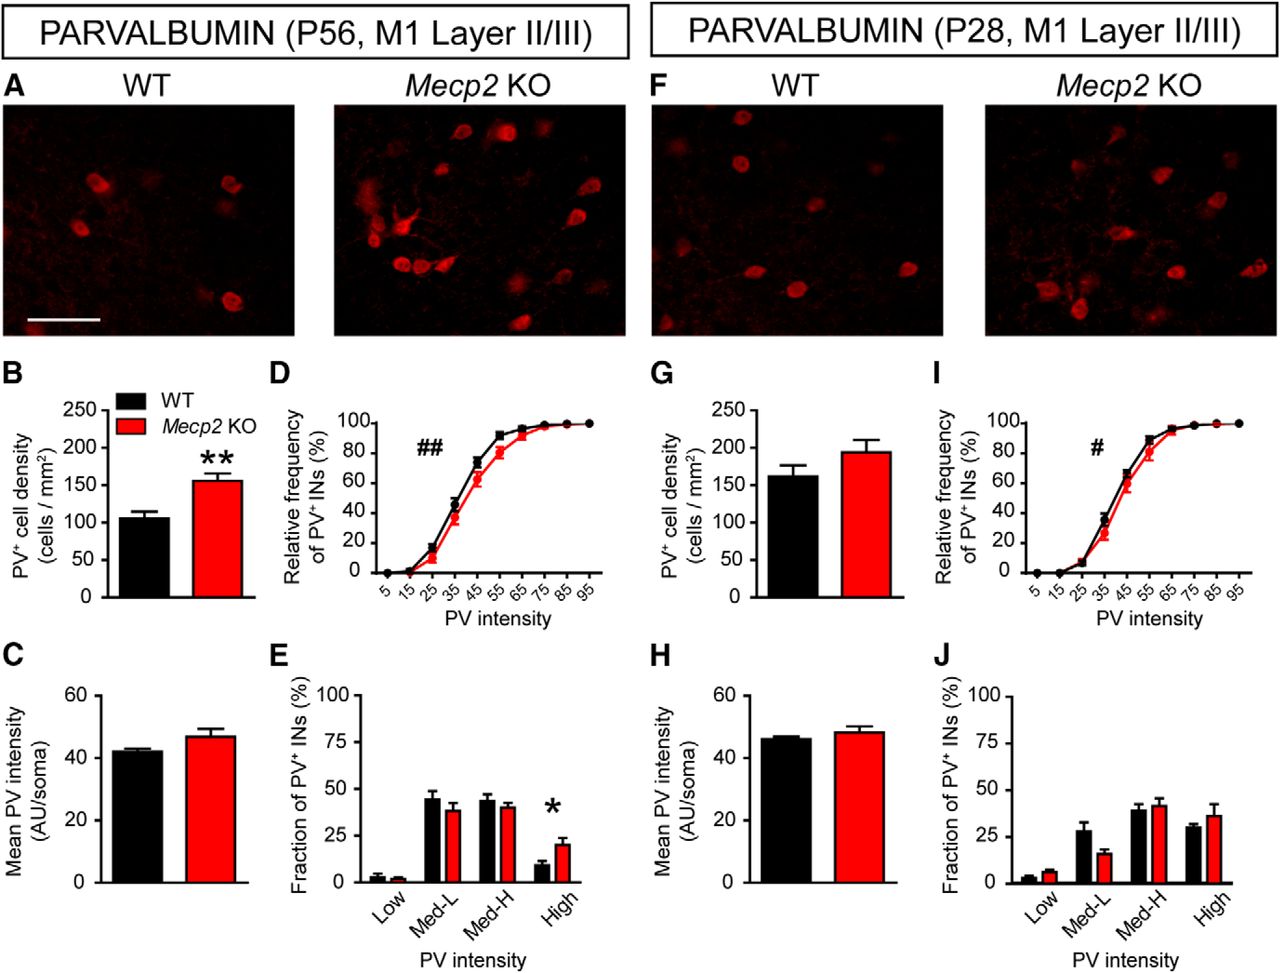
Atypical high-PV-network configuration in the M1 cortex of Mecp2 KO mice. A, Representative images showing PV expression in layer II/III of M1 cortex in both WT and Mecp2 KO mice at P56. Histograms showing quantitative analysis of PV+ cell density at P56 (B), PV mean fluorescence intensity (C), cumulative (D) and binned (E) frequency distribution of PV cells intensity in WT and Mecp2 KO mice. F, Representative images showing PV expression in layer II/III of M1 cortex in both WT and Mecp2 KO mice at P28. Histograms showing quantitative analysis of PV cell density (G), PV mean fluorescence intensity (H), cumulative (I) and binned (J) frequency distribution of PV cells intensity in WT and Mecp2 KO mice at P28. n = 6 mice per genotype at P56 and n = 4 mice per genotype at P28. Student’s t test: *p < 0.05, **p < 0.01, Mann–Whitney U test for D, I: #p < 0.05; ##p < 0.01. Scale bars = 100 μm.
- Figure 6.
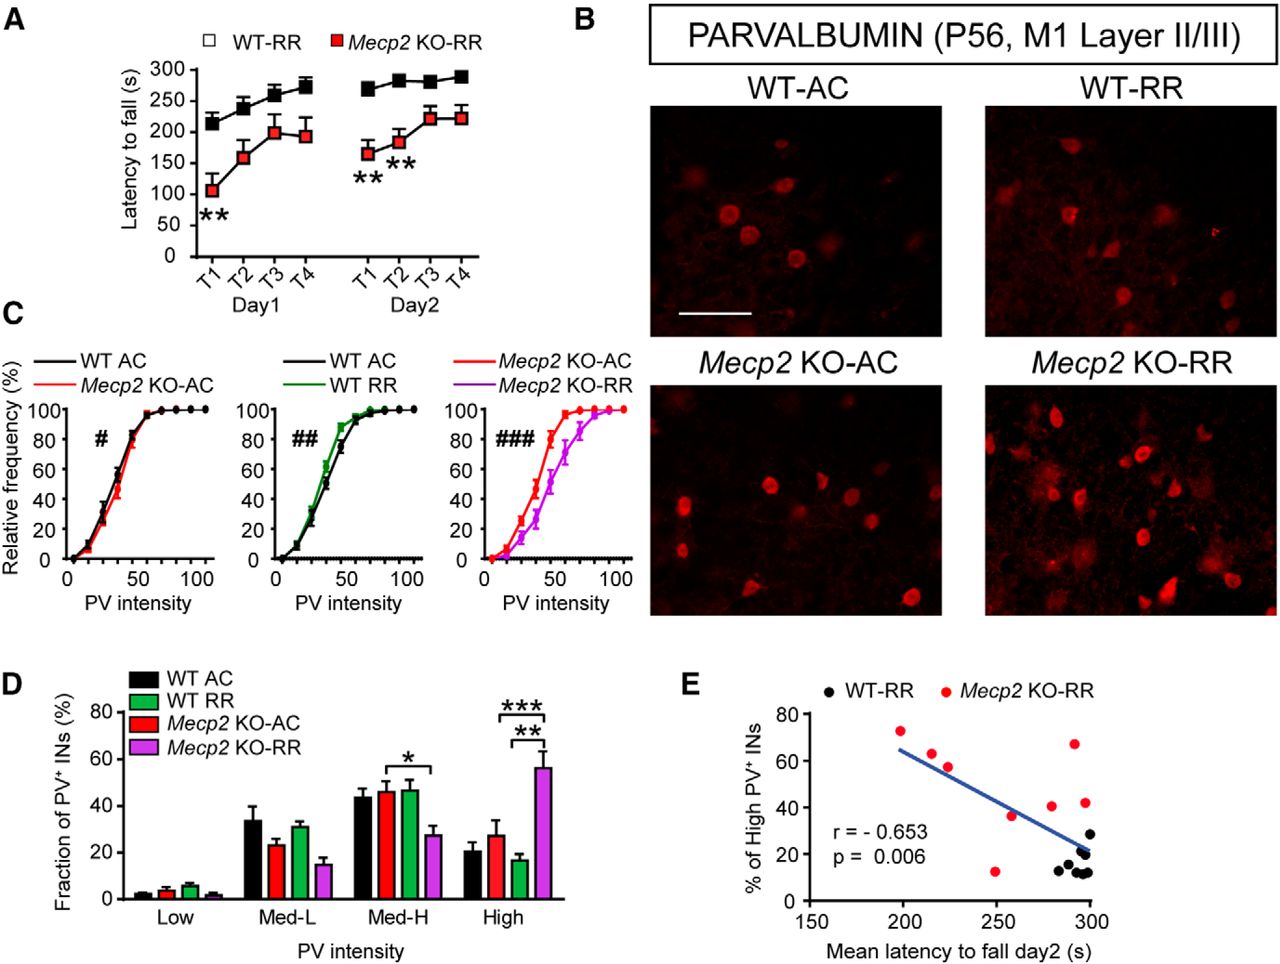
Motor learning–induced plasticity of PV network is impaired in symptomatic Mecp2 KO mice. A, Latency to fall (seconds) from an accelerating rotating rod in P56 Mecp2 KO mice and WT littermates. Graphs show data of first and last trials/d (T1–4), for two consecutive days (day 1–2). B, Representative images of PV immunofluorescence in layer II/III INs of the M1 cortex in both WT and Mecp2 KO P56 mice after AC or RR tasks. Cumulative (C) and binned (D) frequency distribution of PV cells intensity in layer II/III of M1 cortex, in Mecp2 KO mice and WT littermates after AC or RR tasks. (E) Correlation analysis between the mean latency to fall (seconds) from the rod on day 2 and the fraction of high PV+ INs in Mecp2 KO mice and WT littermates. n = 6 WT-AC mice, 5 Mecp2 KO-AC mice, 6 WT-RR mice, and 5 Mecp2 KO-RR mice for C and D. n = 9 WT-RR mice and 9 Mecp2 KO-RR mice for A and E. Two-way ANOVA and Bonferroni posthoc tests for A and D: *p < 0.05, **p < 0.01, ***p < 0.001; Mann–Whitney U test for C: #p < 0.05, ##p < 0.01, ###p < 0.001; Pearson’s r for E. Scale bar = 100 μm.
- Figure 7.
Motor learning produces atypical structural synaptic plasticity of inputs converging on PV+ INs in Mecp2 KO mice. A, Representative confocal images of excitatory VGLUT1+ (green) and inhibitory VGAT+ (blue) puncta apposed to PV+ (red) dendrites and somata in layer II/III of M1 cortex in AC- and RR-trained WT and Mecp2 KO mice. B, C, Histograms showing quantitative analysis of VGLUT1+ puncta density on dendrites (B) and somata (C) of PV+ INs after AC and RR training. D, E, Histograms showing quantitative analysis of VGAT+ puncta density on dendrites (D) and somata (E) of PV+ INs after AC and RR training. Dendrites: n = 5 WT and 5 Mecp2 KO mice; somata: n = 6 WT and 5 Mecp2 KO mice. Two-way ANOVA and Bonferroni posthoc tests: *p < 0.05, **p < 0.01, ***p < 0.001. Scale bar = 5 μm.
- Figure 8.
Atypical high-PV expression in the M1 cortex of female Mecp2 Het mice correlates with motor impairments. Representative images showing PV expression in layer II/III of M1 cortex in both WT and Mecp2 Het mice at 2 (A), 4 (D), and 8 (G) months of age. Cumulative (B, E, H) and binned (C, F, I) frequency distribution of PV cells intensity in WT and Mecp2 Het M1 cortex at 2 (B, C), 4 (E, F), and 8 (H, I) months of age. J, Latency to fall (seconds) from an accelerating rotating rod in 8-mo-old Mecp2 Het mice and WT littermates. Graphs show data of first and last trials/d (T1–4), for two consecutive days (day 1–2). K, Correlation analysis between the mean latency to fall (seconds) from the rod on day 2 and the fraction of high PV+ INs in 8-mo-old Mecp2 Het and WT females. A–I: n = 6 WT and 6 Mecp2 Het mice; J, K: n = 11 WT and 11 Mecp2 Het mice. Mann–Whitney U test for B, E, H: ###p < 0.001; Student’s t test for C, F, I: *p < 0.05, **p < 0.01; two-way ANOVA and Bonferroni posthoc tests for J: *p < 0.05, **p < 0.01; Pearson’s r for E. Scale bar = 100 μm.


Tables
Figure Measurement Type of test Comparison Age P value Fig. 1B PV cell density Unpaired t test WT vs. Mecp2 KO P56 t(10) = 2.82, p = 0.018 Fig. 1C PV fluorescence intensity Unpaired t test WT vs. Mecp2 KO P56 t(10) = 3.24, p = 0.009 Fig. 1D Relative frequency of PV INs Mann–Whitney U test WT vs. Mecp2 KO P56 p < 0.001 Fig. 1E Fraction of PV INs Unpaired t test WT vs. Mecp2 KO (high PV) P56 t(10) = 3.31, p = 0.008 WT vs. Mecp2 KO (medium-high PV) P56 t(10) = 1.91, p = 0.085 WT vs. Mecp2 KO (medium-low PV) P56 t(10) = 1.93, p = 0.083 WT vs. Mecp2 KO (low PV) P56 t(10) = 1.81, p = 0.101 Fig. 1G PV cell density Unpaired t test WT vs. Mecp2 KO P28 t(10) = 0.61, p = 0.555 Fig. 1H PV fluorescence intensity Unpaired t test WT vs. Mecp2 KO P28 t(10) = 3.24, p = 0.268 Fig. 1I Relative frequency of PV INs Mann–Whitney U test WT vs. Mecp2 KO P28 p = 0.002 Fig. 1J Fraction of PV INs Unpaired t test WT vs. Mecp2 KO (high PV) P28 t(10) = 0.32, p = 0.756 WT vs. Mecp2 KO (medium-high PV) P28 t(10) = 1.92, p = 0.083 WT vs. Mecp2 KO (medium-low PV) P28 t(10) = 1.29, p = 0.228 WT vs. Mecp2 KO (low PV) P28 t(10) = 1.54, p = 0.155 Fig. 2E VGLUT1 density on PV dendrites Unpaired t test WT vs. Mecp2 KO P56 t(10) = 3.62, p = 0.004 Fig. 2F VGAT density on PV dendrites Unpaired t test WT vs. Mecp2 KO P56 t(7) = 4.22, p = 0.003 Fig. 2G VGLUT1 density on PV soma Unpaired t test WT vs. Mecp2 KO P56 t(10) = 4.05, p = 0.002 Fig. 2H VGAT density on PV soma Unpaired t test WT vs. Mecp2 KO P56 t(8) = 1.97, p = 0.08 Fig. 2M VGLUT1 density on CR dendrites Unpaired t test WT vs. Mecp2 KO P56 t(10) = 2.50, p = 0.03 Fig. 2N VGAT density on CR dendrites Unpaired t test WT vs. Mecp2 KO P56 t(8) = 0.19, p = 0.85 Fig. 2O VGLUT1 density on CR soma Unpaired t test WT vs. Mecp2 KO P56 t(10) = 1.32, p = 0.21 Fig. 2P VGAT density on CR soma Unpaired t test WT vs. Mecp2 KO P56 t(8)= 1.79, p = 0.11 Fig. 3E VGLUT1 density on PV dendrites Unpaired t test WT vs. Mecp2 KO P28 t(8) = 4.89, p = 0.001 Fig. 3F VGAT density on PV dendrites Unpaired t test WT vs. Mecp2 KO P28 t(8) = 3.39, p = 0.009 Fig. 3G VGLUT1 density on PV soma Unpaired t test WT vs. Mecp2 KO P28 t(14) = 0.91, p = 0.38 Fig. 3H VGAT density on PV soma Unpaired t test WT vs. Mecp2 KO P28 t(8) = 0.24, p = 0.81 Fig. 3M VGLUT1 density on CR dendrites Unpaired t test WT vs. Mecp2 KO P28 t(8) = 0.24, p = 0.82 Fig. 3N VGAT density on CR dendrites Unpaired t test WT vs. Mecp2 KO P28 t(8) = 0.29, p = 0.78 Fig. 3O VGLUT1 density on CR soma Unpaired t test WT vs. Mecp2 KO P28 t(9) = 0.14, p = 0.89 Fig. 3P VGAT density on CR soma Unpaired t test WT vs. Mecp2 KO P28 t(8) = 0.02, p = 0.99 Fig. 4C VSD response (ΔF/F) Two-way ANOVA WT vs. Mecp2 KO P45-60 Genotype F(1,136) = 37.07, p < 0.001 Fig. 4D Spatial spread of VSD signal Two-way ANOVA WT vs. Mecp2 KO P45-60 Genotype F(1,136) = 18.26, p < 0.001 Fig. 4E Spatial spread of VSD signal Unpaired t test WT vs. Mecp2 KO P45-60 p < 0.05 Fig. 4G VSD response (ΔF/F) Two-way ANOVA WT vs. Mecp2 KO P24-26 Genotype F(1,96) = 2.73, p = 0.108 Fig. 4H Spatial spread of VSD signal Two-way ANOVA WT vs. Mecp2 KO P24-26 Genotype F(1,96) = 12.44, p = 0.001 Fig. 4I Spatial spread of VSD signal Unpaired t test WT vs. Mecp2 KO P24-26 p < 0.01 Fig. 5B PV cell density Unpaired t test WT vs. Mecp2 KO P56 t(10) = 3.67, p = 0.004 Fig. 5C PV fluorescence intensity Unpaired t test WT vs. Mecp2 KO P56 t(10) = 1.74, p = 0.112 Fig. 5D Relative frequency of PV INs Mann–Whitney U test WT vs. Mecp2 KO P56 p < 0.001 Fig. 5E Fraction of PV INs Unpaired t test WT vs. Mecp2 KO (high PV) P56 t(10) = 2.45, p = 0.034 WT vs. Mecp2 KO (medium-high PV) P56 t(10) = 0.81, p = 0.439 WT vs. Mecp2 KO (medium-low PV) P56 t(10) = 0.98, p = 0.349 WT vs. Mecp2 KO (low PV) P56 t(10) = 0.46, p = 0.657 Fig. 5G PV cell density Unpaired t test WT vs. Mecp2 KO P28 t(6) = 1.43, p = 0.202 Fig. 5H PV fluorescence intensity Unpaired t test WT vs. Mecp2 KO P28 t(6) = 0.98, p = 0.366 Fig. 5I Relative frequency of PV INs Mann–Whitney U test WT vs. Mecp2 KO P28 p = 0.023 Fig. 5J Fraction of PV INs Unpaired t test WT vs. Mecp2 KO (high PV) P28 t(6) = 0.92, p = 0.391 WT vs. Mecp2 KO (medium-high PV) P28 t(6) = 0.49, p = 0.645 WT vs. Mecp2 KO (medium-low PV) P28 t(6) = 2.20, p = 0.070 WT vs. Mecp2 KO (low PV) P28 t(6) = 1.64, p = 0.152 Fig. 6A Rotarod task Two-way ANOVA Genotype vs. RR P56 RR F(7,112) = 11.62, p < 0.0001 Genotype F(1,16) = 11.75, p = 0.003 Interaction F(7,112) =1.12, p = 0.356 Fig. 6C Relative frequency of PV INs Mann–Whitney U test WT AC vs. Mecp2 KO-AC P56 p = 0.0449 WT AC vs. WT RR P56 p = 0.0015 KO-AC vs. KO-RR P56 p < 0.001 Fig. 6D Fraction of PV INs Two-way ANOVA Genotype vs. RR (medium-high PV) P56 Interaction F(1,18) = 6.19, p = 0.023 Fraction of PV INs Two-way ANOVA Genotype vs. RR (high PV) P56 Interaction F(1,18) = 10.11, p = 0.005 Genotype F(1,18) = 20.06, p = 0.0003 RR F(1,18) = 5.93, p = 0.026 Fig. 6D Correlation between % High PV Pearson’s r WT and Mecp2 KO P56 r: –0.653, p = 0.006 and RR performance Fig. 7B VGLUT1 density on PV dendrites Two-way ANOVA Genotype vs. RR P56 Genotype F(1,16) = 117.91, p < 0.001 RR F(1,16) = 11.25, p = 0.004 VGLUT1 density on PV soma Two-way ANOVA Genotype vs. RR P56 Genotype F(1,18) = 37.20, p < 0.001 RR F(1,18) = 27.33, p < 0.001 VGAT density on PV dendrites Two-way ANOVA Genotype vs. RR P56 Genotype F(1,16) = 43.89, p < 0.001 RR F(1,16) = 17.78, p = 0.0007 Fig. 8B Relative frequency of PV INs Mann–Whitney U test WT vs. Mecp2 Het 2 M p = 0.8219 Fig. 8E Relative frequency of PV INs Mann–Whitney U test WT vs. Mecp2 Het 4 M p = 0.9798 Fig. 8F Fraction of PV INs Unpaired t test WT vs. Mecp2 Het (high PV) 4 M t(10) = 1.51, p = 0.163 WT vs. Mecp2 Het (medium-high PV) 4 M t(10) = 3.19, p = 0.009 WT vs. Mecp2 Het (medium-low PV) 4 M t(10) = 1.03, p = 0.327 WT vs. Mecp2 Het (low PV) 4 M t(10) = 0.77, p = 0.456 Fig. 8H Relative frequency of PV INs Mann–Whitney U test WT vs. Mecp2 Het 8 M p < 0.001 Fig. 8I Fraction of PV INs Unpaired t test WT vs. Mecp2 Het (high PV) 8 M t(10) = 3.16, p = 0.013 WT vs. Mecp2 Het (medium-high PV) 8 M t(10) = 0.52, p = 0.620 WT vs. Mecp2 Het (medium-low PV) 8 M t(10) = 4.06, p = 0.004 WT vs. Mecp2 Het (low PV) 8 M t(10) = 1.40, p = 0.200 Fig. 8J Rotarod task Two-way ANOVA Genotype vs. RR 8 M RR F(7,176) = 23.60, p < 0.001 Genotype F(1,176) = 42.81, p < 0.001 Interaction F(7,176) =0.66, p = 0.706 Fig. 8J Correlation between % HIGH PV and RR performance Pearson’s r WT and Mecp2 Het 8 M r: –0.481, p = 0.024 - Table 2.
Data structure (normal or non-normal distribution), statistical tests, and observed power value of the statistical test
Figure Data structure Type of test Power Fig. 1B Normal distribution Unpaired t test 0.720 Fig. 1C Normal distribution Unpaired t test 0.757 Fig. 1E Normal distribution Unpaired t test Low 0.372; medium-low 0.413; medium-high 0.410; high 0.845 Fig. 1G Normal distribution Unpaired t test 0.086 Fig. 1H Normal distribution Unpaired t test 0.186 Fig. 1J Normal distribution Unpaired t test Low 0.286; medium-low 0.214; medium-high 0.412; high 0.059 Fig. 2E Normal distribution Unpaired t test 0.902 Fig. 2F Normal distribution Unpaired t test 0.823 Fig. 2G Normal distribution Unpaired t test 0.953 Fig. 2H Normal distribution Unpaired t test 0.410 Fig. 2M Normal distribution Unpaired t test 0.616 Fig. 2N Normal distribution Unpaired t test 0.053 Fig. 2O Normal distribution Unpaired t test 0.232 Fig. 2P Normal distribution Unpaired t test 0.352 Fig. 3E Normal distribution Unpaired t test 0.989 Fig. 3F Normal distribution Unpaired t test 0.837 Fig. 3G Normal distribution Unpaired t test 0.136 Fig. 3H Normal distribution Unpaired t test 0.055 Fig. 3M Normal distribution Unpaired t test 0.055 Fig. 3N Normal distribution Unpaired t test 0.057 Fig. 3O Normal distribution Unpaired t test 0.052 Fig. 3P Normal distribution Unpaired t test 0.050 Fig. 4C Normal distribution Two-way ANOVA with RM Genotype 0.978 Fig. 4D Normal distribution Two-way ANOVA with RM Genotype 0.729 Fig. 4G Normal distribution Two-way ANOVA with RM Genotype 1.000 Fig. 4H Normal distribution Two-way ANOVA with RM Genotype 0.856 Fig. 5B Normal distribution Unpaired t test 0.910 Fig. 5C Normal distribution Unpaired t test 0.053 Fig. 5E Normal distribution Unpaired t test Low 0.070; medium-low 0.145; medium-high 0.206; high 0.599 Fig. 5G Normal distribution Unpaired t test 0.228 Fig. 5H Normal distribution Unpaired t test 0.132 Fig. 5J Normal distribution Unpaired t test Low 0.283; medium-low 0.456; medium-high 0.070; high 0.123 Fig. 6A Normal distribution Two-way ANOVA with RM Interaction 0.464; test 0.957; genotype 0.895 Fig. 6D Normal distribution Two-way ANOVA (Low) interaction 0.666; test 0.094; genotype 0.228 (Medium-low) interaction 0.113; test 0.278; genotype 0.919 (Medium-high) interaction 0.739; test 0.466; genotype 0.524 (High) interaction 0.914; test 0.721; genotype 0.997 Fig. 6E Normal distribution Pearson’s r 0.829 Fig. 7B Normal distribution Two-way ANOVA Interaction 0.996; test 0.940; genotype 1.000 Fig. 7C Normal distribution Two-way ANOVA Interaction 0.152; test 0.999; genotype 0.999 Fig. 7D Normal distribution Two-way ANOVA Interaction 0.999; test 0.999; genotype 0.993 Fig. 7E Normal distribution Two-way ANOVA Interaction 0.209; test 0.723; genotype 0.290 Fig. 8C Normal distribution Unpaired t test Low 0.062; medium-low 0.536 Medium-high 0.310; high 0.081 Fig. 8F Normal distribution Unpaired t test Low 0.108; medium-low 0.154 Medium-high 0.820; High 0.276 Fig. 8I Normal distribution Unpaired t test Low 0.234; medium-low 0.942 Medium-high 0.074; high 0.791 Fig. 8J Normal distribution Two-way ANOVA with RM Interaction 0.370; test 1.000; genotype 0.844 Fig. 8K Normal distribution Pearson’s r 0.647
In this issue


