

Article Figures & Data
Figures
- Figure 1.
Ablation of AhR impairs hippocampus-dependent memory. A, Percentage of freezing in the CFC task for AhR+/+ and AhR –/– mice 1 h (left) and 24 h (right) after the foot shocks (*, p < 0.05 versus AhR+/+; n = 8 AhR+/+ and 7 AhR –/– animals/group). B, Percentage of exploration time between familiar and new object in the NOR test for AhR+/+ and AhR –/– mice 6 h after training. Two-way ANOVA demonstrated a significant interaction between the object and genotype [F(1, 18) = 7,46; p < 0.05; *, p < 0.05 vs. AhR+/+; n = 6 AhR+/+ and 5 AhR –/– animals/group]. C, Percentage of exploration time between old and new object location in the NOL test for AhR+/+ and AhR –/– mice 6 h after training. Two-way ANOVA demonstrated a significant interaction between the object and genotype [F(1, 42) = 7.93; p < 0.05; *, p < 0.05 vs. AhR+/+; n = 12 AhR+/+ and 11 AhR –/– animals/group]. D, Percentage of time spent in each arm in the Y-maze test for AhR+/+ and AhR –/– mice 6 h after training. Two-way ANOVA showed a significant interaction between the arm/genotype [F(2, 27) = 3.84; p < 0.05; n = 6 animals/group]. E, Time spent to find the escape box during the Barnes maze training sessions in both AhR+/+ and AhR–/– mice. Two-way ANOVA demonstrated a significant effect during training sessions [F(5, 65) = 5.04; p < 0.05; n = 7–8 animals/group]. F, Density plots for grouped data showing where the AhR+/+ and AhR –/– mice concentrated their searches during retention test day. G, Percentage of time (s) spent around each hole in the Barnes maze platform for AhR+/+ and AhR –/– mice during the retention test day. Two-way ANOVA demonstrated a significant interaction between the holes and genotype [F(19, 260) = 1.83; p < 0.05; *, p < 0.05 vs. AhR+/+; n = 7–8 animals/group). Data are mean ± SEM. Data were compared by using nonparametric 2-tailed Mann–Whitney test (A), or a nonparametric 2-way ANOVA followed by Bonferroni post hoc testing (B–G).
- Figure 2.
The absence of AhR exacerbates adult hippocampal neurogenesis. A, BrdU+ cells in the DG of AhR+/+ and AhR–/– mice measured at p30, p60, and p100 24 h after the last BrdU injection. Two-way ANOVA demonstrated a significant interaction between the age and genotype [F(2, 24) = 9.51; p < 0.05; *, p < 0.05 vs. AhR+/+; n = 5 animals/group]. B, C, Ki67+ cells in the DG of AhR+/+ and AhR–/– mice measured at p30, p60, and p100. Two-way ANOVA demonstrated a significant interaction between the age and genotype [F(2, 28) = 8.56; p < 0.05; *, p < 0.05 vs. AhR+/+; n = 5–6 animals/group]. Representative images of Ki67+ cells in AhR+/+ and AhR–/– mice at different time points are shown in C. D–F, Quantification of the number of nestin/BrdU+ cells by flow cytometry 24 h after BrdU administration. Data are expressed as the percentage of control group (*, p < 0.05 vs. AhR+/+; n = 6 animals/group; D). Representative dot plots of double-stained cells for nestin and BrdU in the DG of AhR+/+ (E) and AhR–/– (F) mice. G–L, Characterization of type-1 (nestin+/GFAP+; G) and type-2 progenitors (nestin+/GFAP-; I) and their proliferative capacity (BrdU+; H and J) in the DG of AhR+/+ and AhR–/– mice determined at p30 and p100. Representative images of nestin (red), GFAP (green), BrdU (gray) of DG of AhR+/+ and AhR–/– mice at p30 (K) and p100 (L; *, p < 0.05 vs. AhR +/+; #, p < 0.05 vs. AhR–/–; n = 4–6 animals/group). M, N, Quantification of the number of DCX+ cells in the DG of WT and AhR–/– mice (*, p < 0.05 vs. AhR+/+; n = 7–8 animals/group). Representative images of DCX+ cells in AhR+/+ and AhR –/– mice are shown in N. O, P, Quantification of the number of BrdU+ cells (left) and newborn integrated neurons (BrdU+/Calbindin+; right) determined 28 days after BrdU administration (*, p < 0.05 vs. AhR+/+; n = 7–9 animals/group). Representative colocalization images for BrdU and calbindin in AhR+/+and AhR–/– mice are shown in P. Insets display high-magnification images. Numbers of cells are expressed per 1000 μm2. Data are mean ± SEM. Scale bar is 50 μm in C, J, K, and L; 70 μm in N; and 30 μm in P. Data were compared by using nonparametric 2-tailed Mann–Whitney test in D, M, and O or nonparametric 2-way ANOVA followed by Bonferroni post hoc testing (A, B, G–J).
- Figure 3.
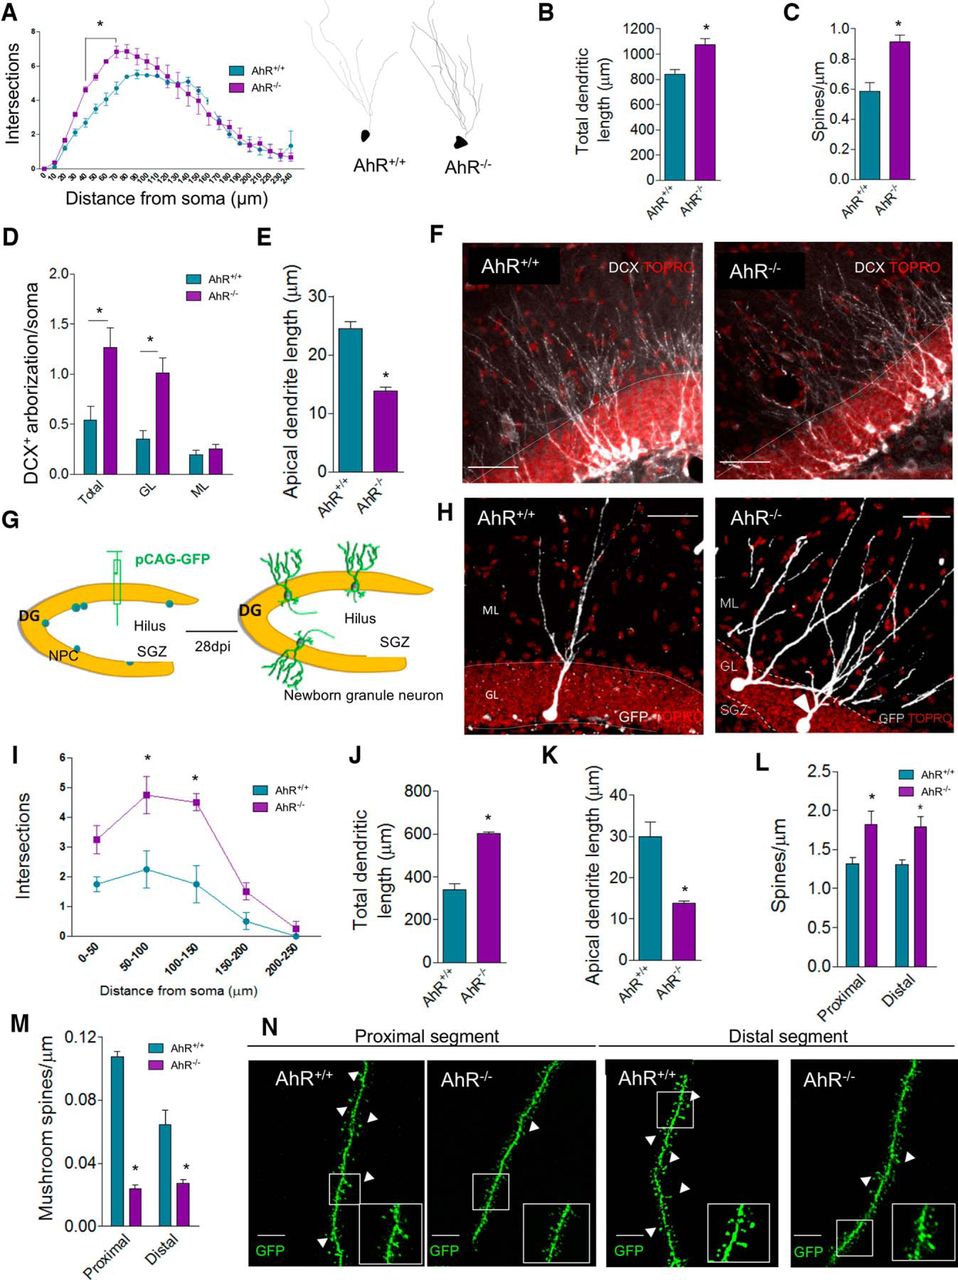
The absence of AhR alters granule cell morphology and dendritic spine density and maturation. A, Sholl analysis of granule dendritic branching of Golgi-Cox stained DG from AhR+/+ and AhR–/– p60 mice. Two-way ANOVA demonstrated a significant interaction between distance/genotype [F(24,125) = 2.45; p < 0.05; *, p < 0.05 vs. AhR+/+; n = 23 WT and 37 AhR KO neurons from 3–4 animals/group]. Representative reconstructions of Golgi-Cox stained neurons are shown for AhR+/+ (left) and AhR–/– mice (right). B, Total dendritic length of Golgi-Cox-stained granular cells (*p < 0.05 versus AhR). C, Quantification of spine density in Golgi–Cox stained neurons (*, p < 0.05 vs. AhR+/+; n = 20–30 dendrite segments from 3–4 animals/group). D, Densitometric analysis of dendrite DCX+ labeling distribution in the DG of WT and AhR–/– mice at p60. Data are displayed as the DCX+ integrated density found in total (GL+ML), GL, or ML normalized by values got from soma. E, Quantification of apical neuroblast length. Representative images of DCX+ labeling distribution in AhR+/+ and AhR–/– mice are shown in F (*, p < 0.05 vs. AhR+/+; n = 5–6 animals/group). G–N, GFP-retroviral infection of newborn neurons. Schematic protocol followed for CAG-GFP retrovirus infusion in AhR+/+ and AhR–/– p60 mice (G). Representative GFP newborn AhR+/+ (left) and AhR–/– neurons (right) are shown in H. Two-way ANOVA of Sholl analysis in GFP-labeled dentate granule cells demonstrates a significant interaction between the distance and genotype [F(4,30) = 3.02; p < 0.05; *, p < 0.05 vs. AhR+/+; n = 19 WT and 28 AhR KO neurons from 4 animals/group; I]. Quantification of total dendritic length (J) and apical dendritic length (K). Density of dendritic (L) and mushroom (M) spines in proximal and distal dendritic segments in the molecular layer of AhR+/+/GFP+ and AhR–/–/GFP+ granule cells 4 weeks postinfection (*, p < 0.05 vs. AhR+/+/GFP+; n = 26 and 22 segments from 4 animals/group). Representative images of GFP-labeled spines in both proximal and distal segments of AhR+/+/GFP+ and AhR–/–/GFP+ granule cells (N). Insets display high-magnification images. Data are mean ± SEM. Data were compared by using nonparametric Mann–Whitney tests in B–E and J–M or a nonparametric 2-way ANOVA followed by Bonferroni post hoc testing (A and I). Scale bar is 70 μm in F and H, and 2 μm in N.
- Figure 4.
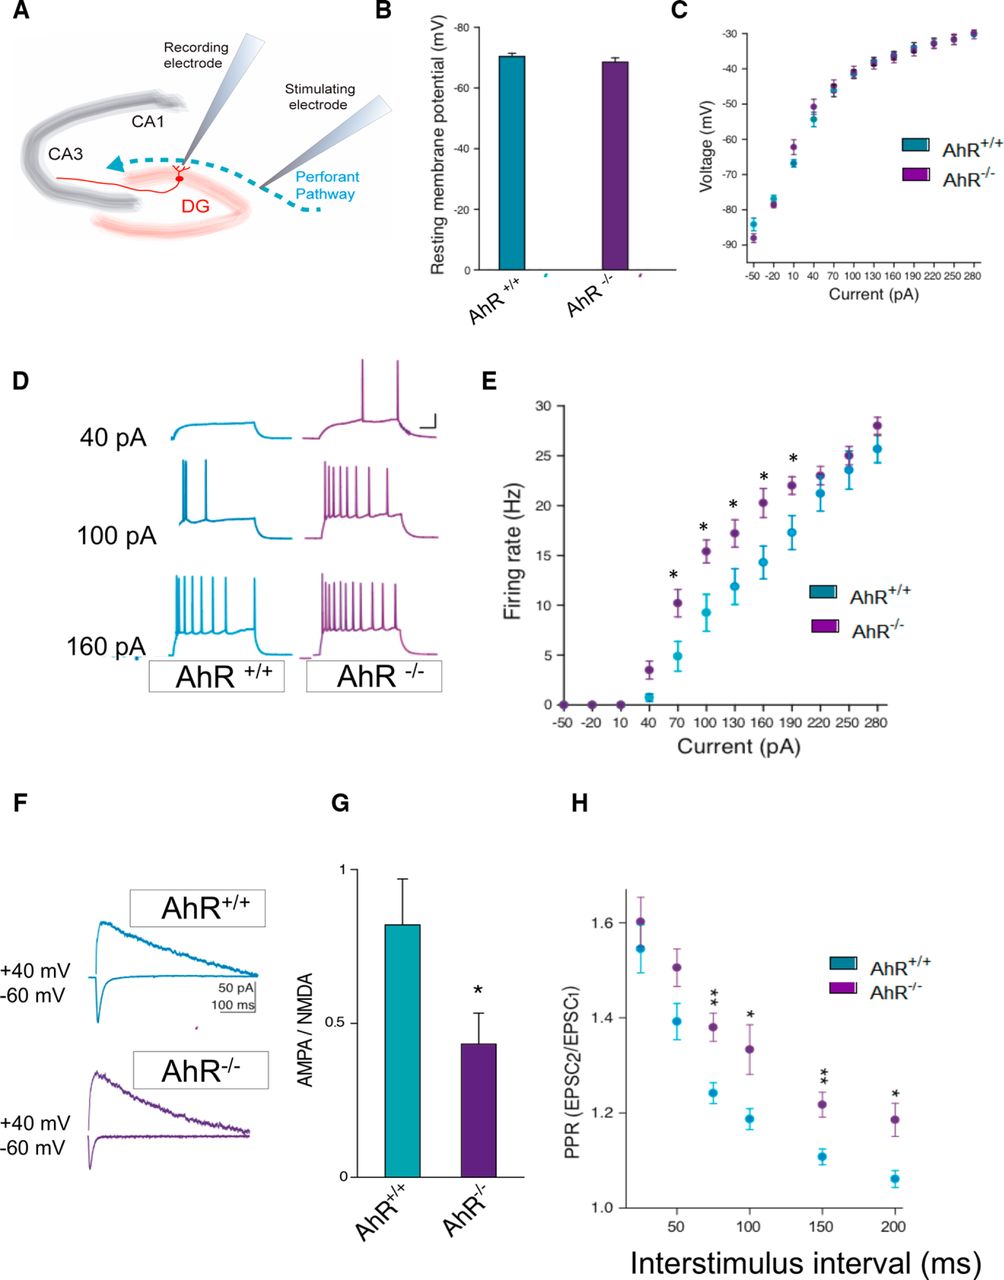
AhR deletion alters the synaptic properties of dentate gyrus granule cells. A, Schematic representation of a hippocampal slice showing stimulating and recording electrode sites. B, C, The resting membrane potential (B) and the current−voltage relationship (C) were not significantly different between DG granule cells from AhR+/+ and AhR–/– mice (n = 4 animals/group). D, E, DG granule cell firing rate is significantly increased by AhR deletion (*, p < 0.05 vs. AhR+/+). Representative sample traces (D) and averaged values (E) in response to increasing depolarizing currents. F, G, AMPA/NMDA ratio is decreased by AhR deletion (*, p < 0.05 vs. AhR+/+). Representative traces (F) and averaged values (G) of NMDA- and AMPA-mediated EPSCs recorded at +40 and –60 mV, respectively. H, Averaged values showing a significant increase in the PPR at interstimulus intervals of 75, 100, 150, and 200 ms in cells lacking AhR (*, p < 0.05, and **, p < 0.01 vs. AhR+/+). EPSC sample traces represent the mean of 20 consecutive EPSCs at 0.33 Hz. Data are mean ± SEM (14 neurons from 8 slices from n = 4 AhR+/+ mice and 12 neurons from 8 slices from n = 4 AhR–/– mice). Data were compared by using nonparametric 2-tailed Mann–Whitney tests.
- Figure 5.
Acute ablation of AhR in adult neural precursors impairs hippocampus-dependent memory by promoting aberrant immature neurons. A, Schematic diagram of the strategy for conditional deletion of AhR in NPCs in nestin-CreERT2+/AhRf/f mice (AhR-icKO). AhRf/f and nestin-CreERT2+/AhRf/f mice were administered two rounds of tamoxifen (TAM; at p30 and p60) at a dose of 180 mg/kg. B, AhR immunostaining in AhRf/f (left) and AhR-icKO (right) 3 weeks after the second round of TAM injection. C, Quantification of the number of DCX+ cells per 1000 μm2 in the DG of AhRf/f and AhR-icKO mice 3 weeks after the last TAM injection (*, p < 0.05 versus AhRf/f; n = 8 animals/group; left). Representative images of DCX+ staining in AhRf/f and AhR-icKO mice (right). D, Densitometric analysis of dendrite DCX+ labeling distribution in the DG of AhRf/f and AhR-icKO mice 3 weeks after the last TAM injection. Data are displayed as the DCX+ integrated density found in total (GL+ML), GL, or ML normalized by values got from soma (*, p < 0.05 vs. AhRf/f; n = 6 AhRf/f and 5 AhR-icKO animals/group; left). Representative images of the arborization of immature newborn cells in AhRf/f and AhR-icKO mice (right). E, Protocol followed for a weak contextual fear conditioning paradigm (0.4 mA ×1) in AhRf/f and AhR-icKO treated with tamoxifen. Retrieval was performed 24 h after training. (*, p < 0.05 vs. AhRf/f; n = 10–11 animals/group). F, Percentage of time spent in each arm in the Y-maze test for AhRf/f and AhR-icKO mice 3 weeks after the last TAM injection 6 h after training. Two-way ANOVA demonstrated a significant interaction between the arm and genotype [F(2, 57) = 5.91; p < 0.05; n = 10–11 animals/group). G, Percentage of exploration time between old and new object location in the NOL test for AhRf/f and AhR-icKO mice 3 weeks after the last TAM injection 6 h after training (n = 10–11 animals/group). Data are mean ± SEM. Scale bar is 50 μm in B–D. Data were compared by using nonparametric 2-tailed Mann–Whitney test (C–E), or nonparametric 2-way ANOVA followed by Bonferroni post hoc testing (F, G).
- Figure 6.
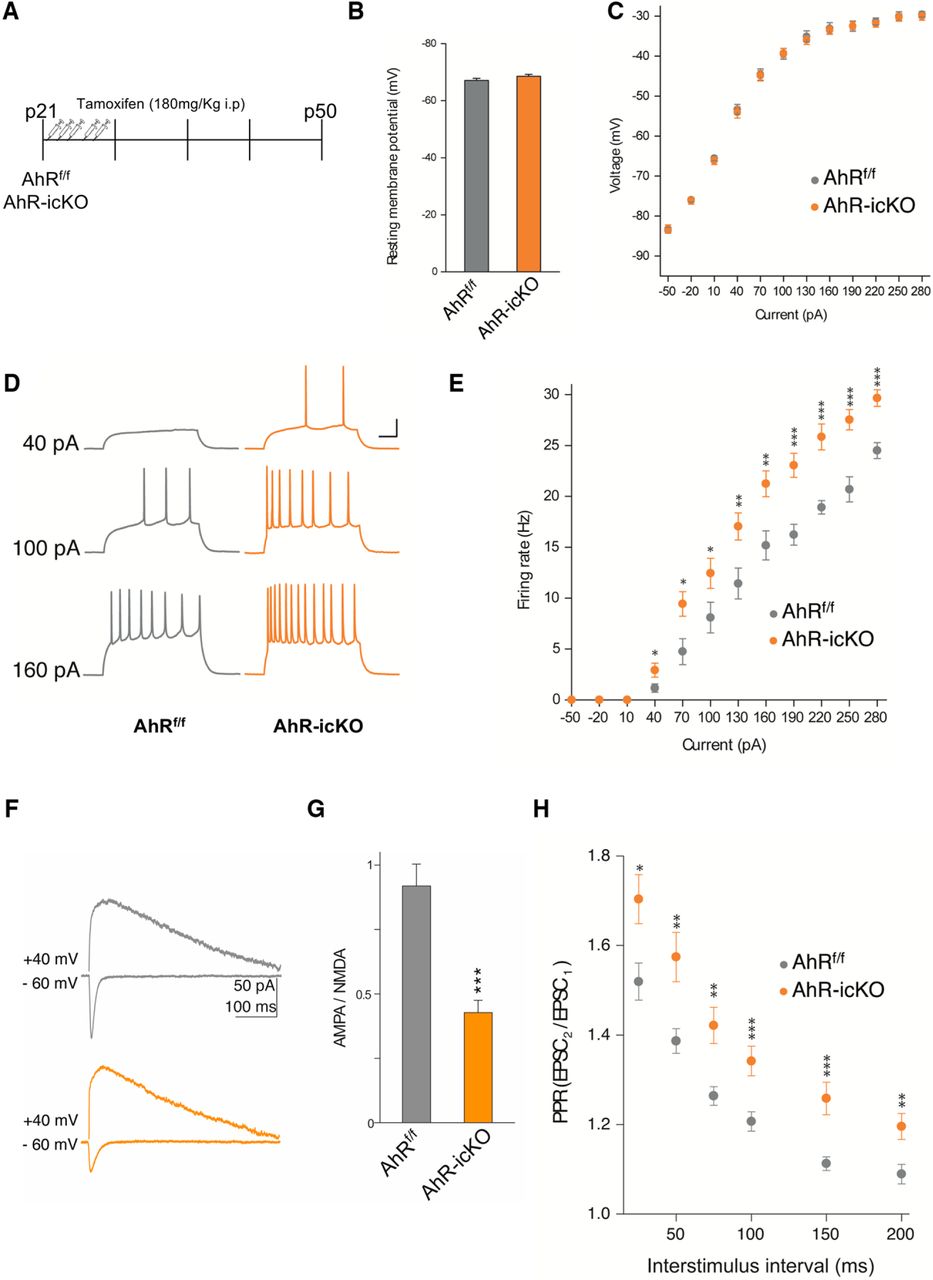
Acute ablation of AhR in adult neural precursors alters the synaptic properties of dentate gyrus granule cells. A, Experimental protocol for tamoxifen administration and electrophysiological recordings. B, C, The resting membrane potential (B) and the current−voltage relationship (C) did not show significant differences between DG granule cells from AhRf/f and AhR-icKO mice (n = 4–6 animals/group). D, E, DG granule cell firing rate is significantly increased by specific AhR ablation (*, p < 0.05 vs. AhRf/f). Representative sample traces (D) and averaged values (E) in response to increasing depolarizing currents. F, G, AMPA/NMDA ratio is decreased by AhR deletion. Representative traces (F) and averaged values (G) of NMDA- and AMPA-mediated EPSCs recorded at +40 and –60 mV, respectively (*, p < 0.05, **, p < 0.01, and ***, p < 0.001 vs. AhRf/f). H, Averaged values showing a significant increase in the PPR at interstimulus 75, 100, 150, and 200-ms intervals in cells lacking AhR (*, p < 0.05, **, p < 0.01, and ***, p < 0.001 vs. AhRf/f). Data are mean ± SEM (25 neurons from 8 slices from n = 6 AhRf/f mice and 24 neurons from 8 slices from n = 4 AhR-icKO mice). Data were compared by using nonparametric 2-tailed Mann–Whitney tests.


In this issue


