

Article Figures & Data
Figures
- Figure 1.
Type 1 NSPCs express nestin, ApoE, and GFAP, while mature granule cells make connections with astrocytes expressing ApoE and GFAP. A–D, Representative confocal images of the dentate gyrus illustrate nestin-expressing (red), ApoE-expressing (green), and GFAP-expressing (blue) cells, along with a merged image of all channels. E–H, High-power representative confocal images taken from the region in the inset in D illustrate nestin-expressing (red), ApoE-expressing (green), and GFAP-expressing (blue) cells, along with a merged image of all channels. White arrows indicate nestin-ApoE-GFAP triple-positive cells, representing type 1 NSPCs. I–L, Representative confocal images of the dentate gyrus illustrate tdTomato-expressing (red), ApoE-expressing (green), and GFAP-expressing (blue) cells, along with a merged image of all channels. M–P, High-power representative confocal images taken from the region in the inset in L illustrate tdTomato-expressing (red), ApoE-expressing (green), and GFAP-expressing (blue) cells, along with a merged image of all channels. White arrows indicate GFAP and ApoE coexpressing astrocytes. GL, Granule layer; HIL, hilus. Scale bars: D, 100 µm; H, 75 µm; L, 100 µm; P, 25 µm.
- Figure 2.
ApoE deficiency leads to a decrease in overall proliferation, the number of type 1 NSPCs, and type 1 NSPC proliferation in the dentate gyrus, while leaving the ability of newborn cells to survive and differentiate into granular neurons unimpaired. A–C, Unbiased stereological quantification of the number of BrdU-positive cells (A), the number of BrdU-Prox1 double-positive cells (B), and the percentage of BrdU-positive cells that also express Prox1 (C). D–K, Representative confocal images of the SGZ in WT and ApoE-deficient mice illustrate nestin-expressing (green), Ki67-expressing (red), and GFAP-expressing (blue) cells, along with a merged image of all channels. White arrows indicate nestin-Ki67-GFAP triple-positive cells, representing actively proliferating type 1 NSPCs. L–N, Unbiased stereological quantification of the number of Ki67-positive cells (L), the number of nestin-GFAP double-positive cells (M), and the number of nestin-GFAP-Ki67 triple-positive cells (N). Results are expressed as the mean ± SEM. Unpaired Student’s t tests, *p < 0.05. Scale bar, K, 50 µm.
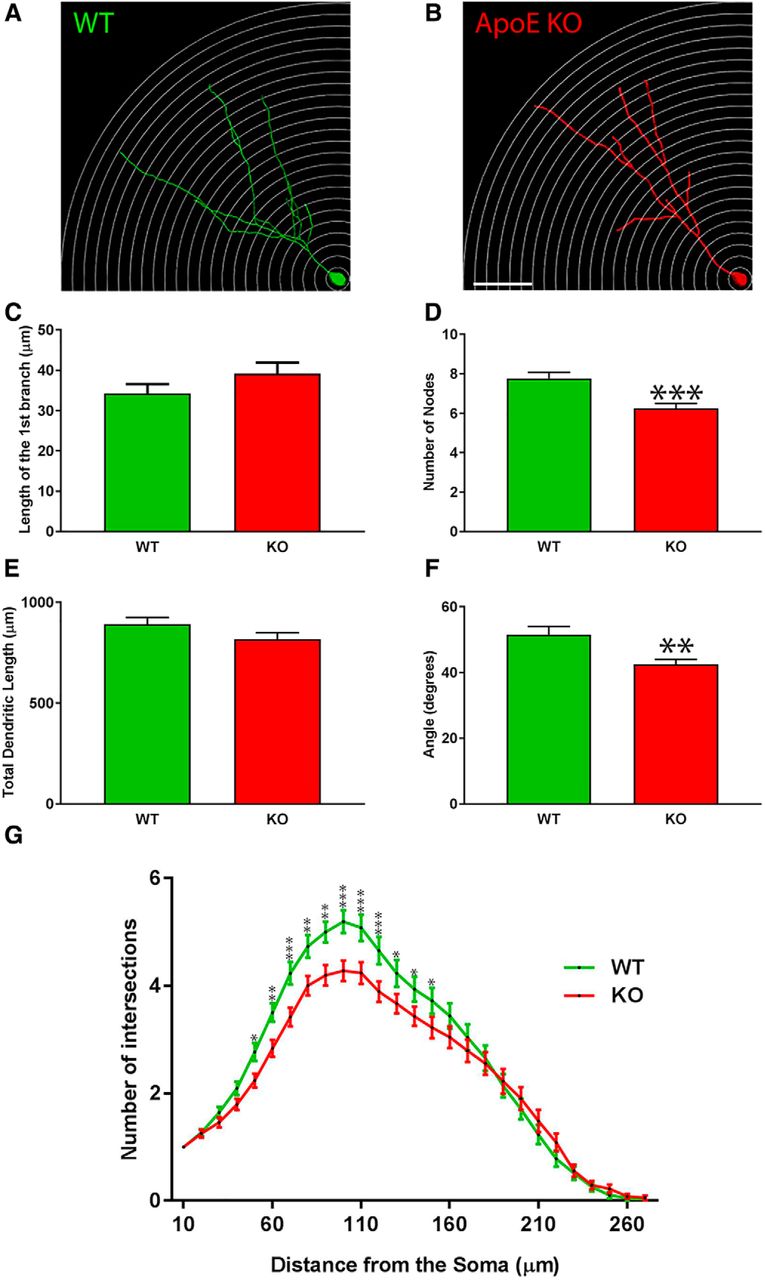
- Figure 3.
The complexity as well as the total dendritic length of ApoE-deficient adult-born granule cells are significantly reduced. A, B, Representative 3D-reconstructed adult-born granule cells (4 weeks after stereotactic injections), one circle every 10 µm. C, Distance between the soma and the first dendritic division (in µm). D, Nodes were defined as the number of divisions of dendritic branches. E, Cumulative length of dendritic arborization (in µm). F, Span of the dendritic arborization when projected on two dimensions. G, Sholl analysis: the number of dendritic intersections as a function of the distance from the soma: wild type, 78 neurons/4 mice; ApoE-deficient, 73 neurons/7 mice. Results are expressed as the mean ± SEM. Independent t test and two-way-ANOVA with uncorrected Fisher’s LSD post hoc tests were used: *p < 0.05, **p < 0.01, ***p < 0.001. Scale bar, B, 50 µm.
- Figure 4.
The complexity and the total dendritic length of ApoE4 adult-born granule cells are significantly reduced. A, B, Representative 3D-reconstructed adult-born granule cells (4 weeks after stereotactic injections), one circle every 10 µm. Representative picture of 4-week-old retrovirally labeled adult-born granule cells in the dentate gyrus. C, Distance between the soma and the first dendritic intersection (in µm). D, Nodes defined as the number of divisions of dendritic branches. E, Cumulative length of dendritic arborizations (in µm). F, Span of the dendritic arborizations when projected on two dimensions. G, Sholl analysis: number of dendritic intersections as a function of the distance from the soma. ApoE3, 75 neurons/6 mice; ApoE4, 69 neurons/4 mice. Results are expressed as the mean ± SEM. Independent t test and two-way ANOVA with uncorrected Fisher’s LSD post hoc tests were used: *p < 0.05, **p < 0.01, ***p < 0.001, ****p < 0.0001. Scale bar, B, 50 µm.
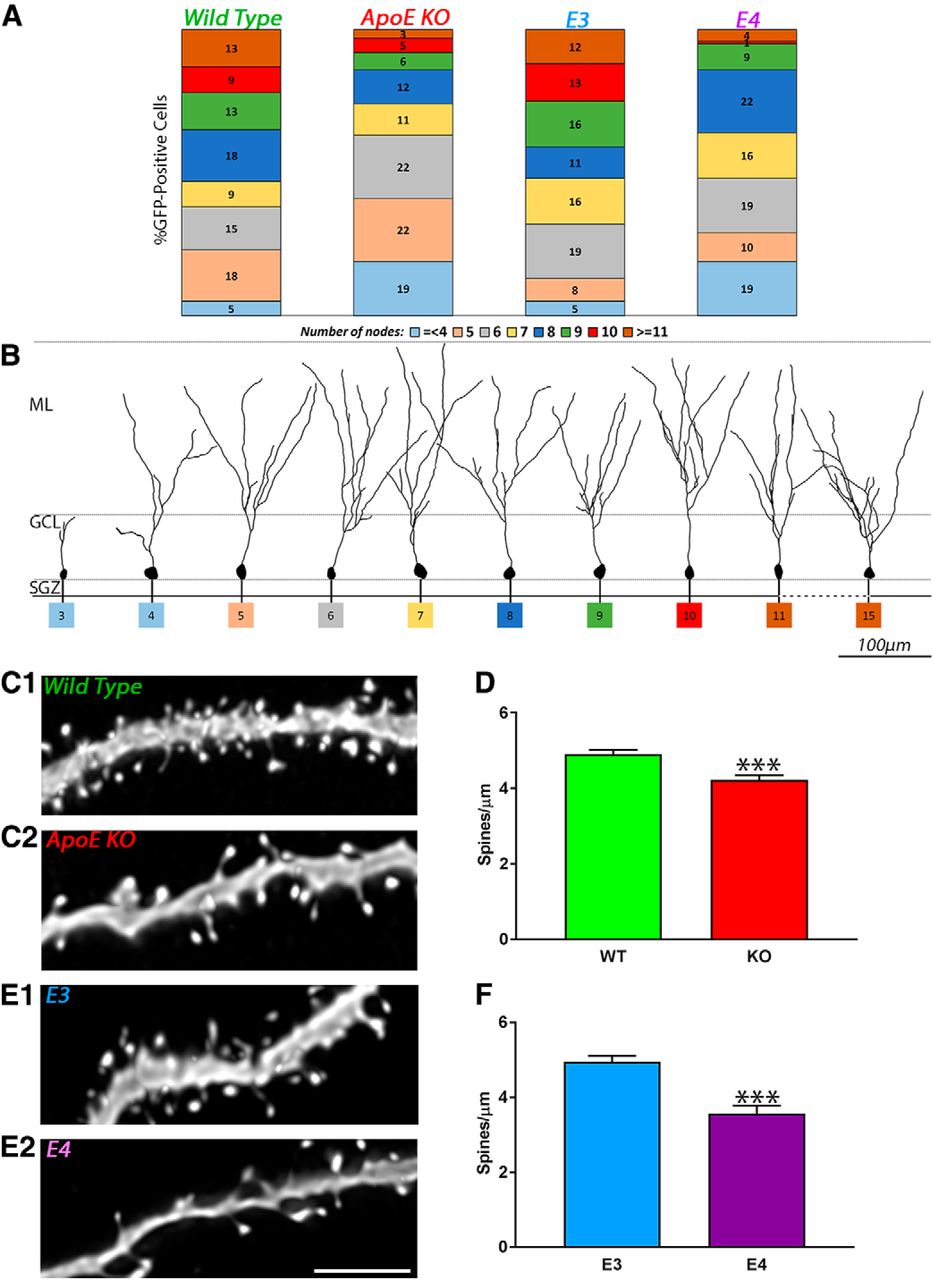
- Figure 5.
Decrease in the proportion of complex and increase of less complex adult-born granule cells in ApoE-deficient and ApoE4 mice. A, Each population of 3D-reconstructed neurons was divided as a function of the number of nodes (≤4, ≥5, 6…10, 11 nodes or more) and expressed as a percentage of the sample function of the different genotypes: wild type (4 mice, 78 neurons); ApoE-deficient (7 mice, 73 neurons); ApoE3 (6 mice, 75 neurons); and ApoE4 mice (4 mice, 69 neurons). B, Representative pictures of 3D-reconstructed wild-type adult-born granule cells 4 weeks after GFP retroviral infection at different levels of dendritic complexity. C1, C2, E1, E2, Representative pictures of dendritic fragments from wild-type (C1), ApoE-deficient (C2), ApoE3 (E1), and ApoE4 (E2) mature adult-born granule cells. D, F, Spine density quantification in ApoE-deficient (51 fragments from five mice) compared with wild-type (58 fragments from four mice) mice expressed as spines/µm ± SEM, and in ApoE4 (46 fragments from four mice) compared with ApoE3 mice (44 fragments from four mice). Independent t test: ****p < 0.0001. Scale bar, E2, 5 µm.


Tables
- Table 1.
Key resources table, highlighting the genetically modified organisms and strains, viruses and software essential to reproduce results presented in the manuscript
Reagent or resource Source Identifier Bacterial and virus strains Moloney murine leukemia viral vectors, RV-CAG-eGFP or RV-CAG-eGFPcre GT3 Core Facility of the Salk Institute NIH-NCI CCSG: P30 014195, NINDS R24 Core Grant, NEI Experimental models: organisms/strains B6.129P2-Apoetm1Unc/J The Jackson Laboratory Catalog #JAX:002052; RRID:IMSR_JAX:002052, https://www.jax.org/strain/002052 B6.129P2-Apoetm2(APOE*3)Mae N8 Taconic Catalog #TAC:1548; RRID:IMSR_TAC:1548, https://www.taconic.com/transgenic-mouse-model/apoe3 B6.129P2-Apoetm3(APOE*4)Mae N8 Taconic Catalog #TAC:1549; RRID:IMSR_TAC:1549, https://www.taconic.com/transgenic-mouse-model/apoe4 B6;129S6-Gt(ROSA)26Sortm9(CAG-tdTomato)Hze/J The Jackson Laboratory Catalog #JAX: 007909; RRID:IMSR_JAX:007905, https://www.jax.org/strain/007905 C57BL/6J The Jackson Laboratory Catalog #JAX:000664; RRID:IMSR_JAX:000664, https://www.jax.org/strain/000664 Software Adobe Photoshop Adobe RRID:SCR_014199, https://www.adobe.com/products/photoshop.html AutoQuant Media Cybernetics RRID:SCR_002465, http://www.mediacy.com/index.aspx?page=AutoQuant Prism GraphPad Software RRID:SCR_015807, https://www.graphpad.com/scientific-software/prism/ Neurolucida mbf BIOSCIENCE RRID:SCR_001775, http://www.mbfbioscience.com/neurolucida Stereo Investigator mbf BIOSCIENCE RRID:SCR_002526, http://www.mbfbioscience.com/stereo-investigator RRID, Research resource identifiers (https://scicrunch.org/resources).
Target Description Provider Dilution RRID GFP Rabbit polyclonal Invitrogen 1:500 Catalog #A-11122; RRID:AB_221569 BrdU Rat monoclonal Abcam 1:500 Catalog #ab6326; RRID:AB_305426 GFAP Guinea Pig polyclonal MyBioSource 1:500 Catalog #MBS834682 Ki67 Rabbit monoclonal Thermo Fisher Scientific 1:500 Catalog #RM-9106-S0; RRID:AB_2341197 Prox1 Rabbit polyclonal Abcam 1:500 Catalog #ab101851; RRID:AB_10712211 ApoE Goat polyclonal EMD Millipore 1:5000 Catalog #AB947; RRID:AB_2258475 Rabbit Biotin Goat polyclonal Jackson ImmunoResearch Laboratories 1:200 Catalog #111-065-003; RRID:AB_2337959 Goat Biotin Donkey polyclonal Jackson ImmunoResearch Laboratories 1:200 Catalog #705-065-147; RRID:AB_2340397 Rat A488 Donkey polyclonal Jackson ImmunoResearch Laboratories 1:200 Catalog #712-546-153; RRID:AB_2340686 Rabbit A488 Donkey polyclonal Jackson ImmunoResearch Laboratories 1:200 Catalog #711-545-152; RRID:AB_2313584 Guinea pig A647 Donkey polyclonal Jackson ImmunoResearch Laboratories 1:200 Catalog #706-605-148; RRID:AB_2340476 Rabbit A647 Donkey polyclonal Jackson ImmunoResearch Laboratories 1:200 Catalog #711-605-152; RRID:AB_2492288 Biotin A488 Streptavidin polyclonal Jackson ImmunoResearch Laboratories 1:200 Catalog #016-540-084; RRID:AB_2337249 Goat serum Normal Goat Serum antibody Jackson ImmunoResearch Laboratories 5% Catalog #005-000-121; RRID:AB_2336990 Donkey serum Normal Donkey Serum antibody Jackson ImmunoResearch Laboratories 5% Catalog #017-000-121; RRID:AB_2337258 RRID, Research resource identifier (https://scicrunch.org/resources).
Table analyzed Statistical test p value Size effect t value df R2 F value WT vs KO BrdU counts Unpaired Student’s t test 0.8469 0.60 0.494 8 0.029 9.72
p = 0.049BrdU-Prox1 colocalization Unpaired Student’s t test 0.6784 0.23 0.3652 8 0.016 5.473
p = 0.1284% Newborn neurons Unpaired Student’s t test 0.2214 0.19 0.2983 8 0.011 1.266
p = 0.8249Nestin-Ki67-GFAP Unpaired Student’s t test 0.0376 1.88 2.658 6 0.5408 8.054
p = 0.1204Nestin-GFAP Unpaired Student’s t test .0291 2.02 2.851 6 0.575 1.639
p = 0.6947Ki67 Unpaired Student’s t test 0.0333 2.47 2.75 6 0.5576 1.015
p = 0.9903Length of the first branch Unpaired Student’s t test 0.1658 0.23 1.393 149 0.0128 1.284
p = 0.2817Number of nodes Unpaired Student’s t test 0.0001 0.65 3.939 149 0.0943 1.617
p = 0.0406DA cumulative length Unpaired Student’s t test 0.1117 0.26 1.6 149 0.0169 1.133
p = 0.5929DA span Unpaired Student’s t test 0.0032 0.49 2.967 149 0.05578 3.387
p = 0.0001Sholl analysis Intersection effect Two-way ANOVA <0.0001 F(26,4023) = 2.488 Row effect Two-way ANOVA <0.0001 F(26,4023) = 163.7 Column effect Two-way ANOVA <0.0001 F(1,4023) = 37.46 Spine density Unpaired Student’s t test <0.0001 1.13 4.163 107 0.1394 1.016
p = 0.9479E3 vs E4 BrdU Counts Unpaired Student’s t test 0.8961 0.094 0.135 7 0.002612 2.668
p = 0.4463BrdU-Prox1 colocalization Unpaired Student’s t test 0.5838 0.40 0.574 7 0.04498 3.759
p = 0.3053% Newborn neurons Unpaired Student’s t test 0.1097 1.22 1.832 7 0.324 1.234
p = 0.8143Nestin-Ki67-GFAP Unpaired Student’s t test 0.486 0.52 0.7419 6 0.6185 1.875
p = 0.6185Nestin-GFAP Unpaired Student’s t test 0.3700 0.69 0.9689 6 0.1351 1.191
p = 0.8891Ki67 Unpaired Student’s t test 0.2795 0.84 1.189 6 0.1906 2.6
p = 0.4533Length of the first branch Unpaired Student’s t test 0.8949 0.023 0.132 142 0.000123 1.09
p = 0.7196Number of nodes Unpaired Student’s t test 0.0007 0.59 3.472 142 0.07826 1.408, p = 0.1542 DA cumulative length Unpaired Student’s t test <0.0001 0.7 4.127 142 0.1071 1.783, p = 0.0166 DA Span Unpaired Student’s t test 0.5978 0.09 0.528 142 0.001965 1.296, p = 0.2749 Sholl analysis Intersection effect Two-way ANOVA 0.0013 F(26,3834) = 2.048 Row effect Two-way ANOVA <0.0001 F(26,3834) = 144.7 Column effect Two-way ANOVA <0.0001 F(1,3834) = 112.8 Spine density Unpaired Student’s t test <0.0001 1.13 5.278 88 0.2405 2.08
p = 0.0173D, Dendritic arborization. Cohen’s d value was calculated as
 with
, d = 0.2, d = 0.5, and d = 0.8 corresponding to small, medium, and large size effects, respectively
with
, d = 0.2, d = 0.5, and d = 0.8 corresponding to small, medium, and large size effects, respectively


In this issue


