

Article Figures & Data
Figures
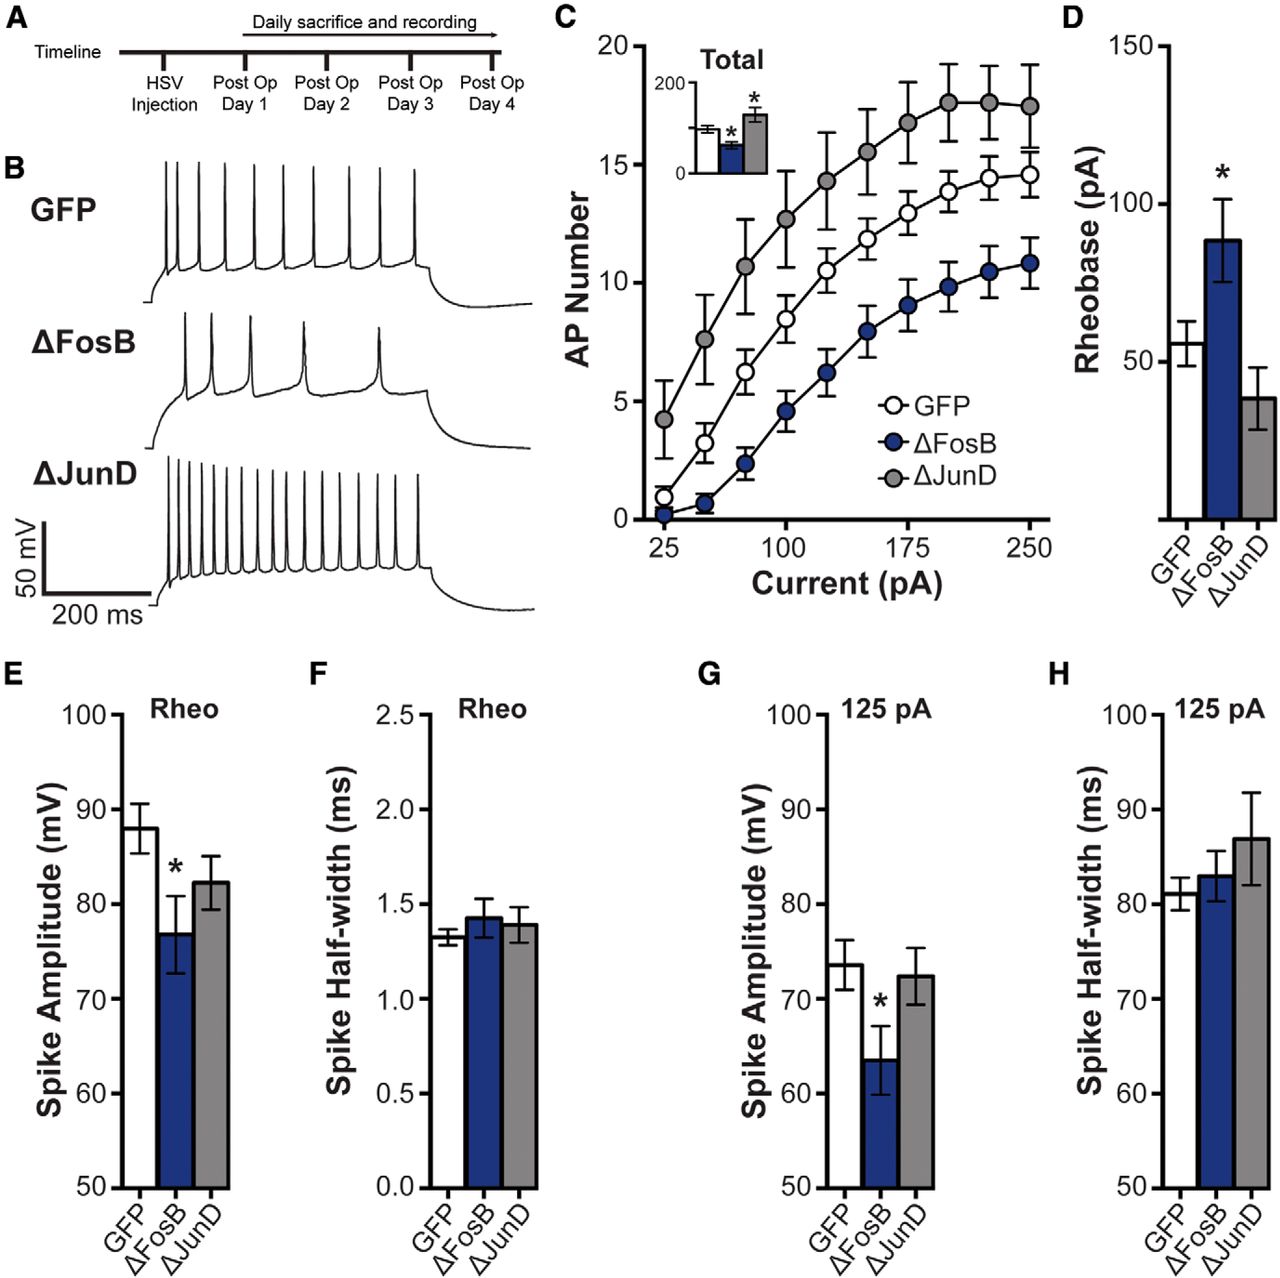
- Figure 1.
ΔFosB regulates spike number in hippocampal CA1 neurons. A, Experimental timeline. B, Representative spikes from 125 pA depolarizing current injection in dHPC CA1 neurons transduced by HSV-GFP (GFP), HSV-GFP+ΔFosB (ΔFosB), and HSV-GFP + ΔJunD (ΔJunD). C, Spike (AP) number across increasing depolarizing current steps (25–250 pA) for GFP (n = 21 cells; n = 8 mice), ΔFosB (n = 19 cells; n = 9 mice), and ΔJunD (n = 14 cells; n = 5 mice). The number of APs was significantly decreased by ΔFosB, and increased by ΔJunD. *p < 0.05, **p < 0.01 (two-way repeated-measures ANOVA; Holm–Sidak comparisons). Inset, Total number of APs across all steps. Total spikes were similarly regulated by ΔFosB. *p < 0.05 (one-way ANOVA; Holm–Sidak comparisons). D, Rheobase (in pA) in GFP-, ΔFosB-, and ΔJunD-expressing cells. Rheobase was significantly increased by ΔFosB expression. *p < 0.05 (one-way ANOVA; Holm–Sidak comparisons). E, Rheobase spike peak amplitude (in mV). Spike amplitude was significantly decreased by ΔFosB expression. *p < 0.05 (one-way ANOVA; Holm–Sidak comparisons). F, Rheobase spike half-width (in ms). No differences were observed. G, Mean spike amplitude (in mV) elicited by 125 pA depolarizing current injection. Spike amplitudes at 125 pA current were significantly decreased by ΔFosB expression. *p < 0.05 (one-way ANOVA; Holm–Sidak comparisons). H, Mean spike half-width (in ms) elicited by 125 pA depolarizing current injection. No differences were observed. All graphs display means ± SEM.
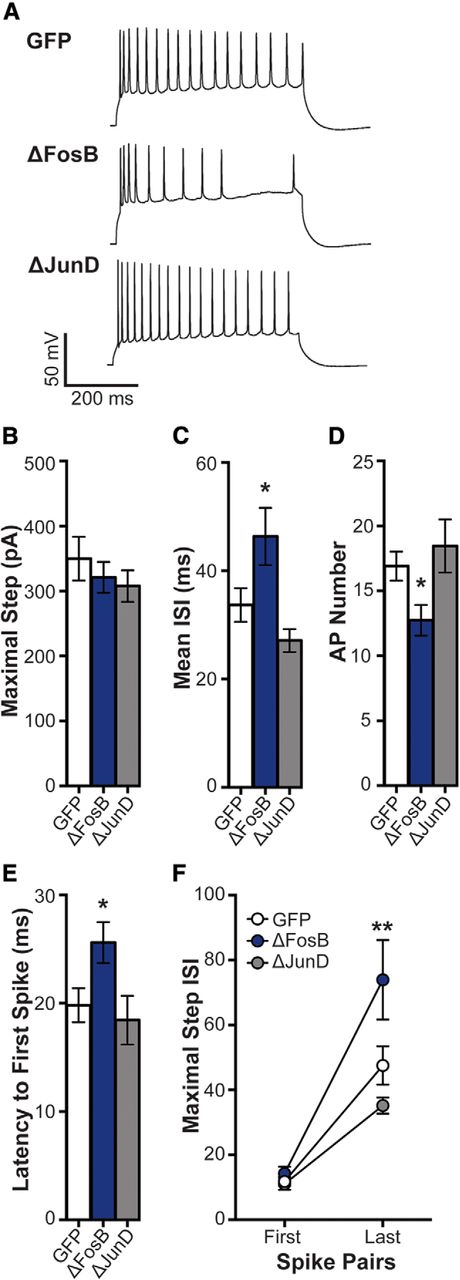
- Figure 2.
ΔFosB enhances spike frequency adaptation. A, Representative spikes at maximal depolarizing current injection in dHPC CA1 neurons transduced by HSV-GFP (GFP), HSV-GFP + ΔFosB (ΔFosB), and HSV-GFP + ΔJunD (ΔJunD). B, The maximal depolarizing current was used to assess spike frequency adaptation among GFP (n = 21 cells; n = 8 mice), ΔFosB (n = 19 cells; n = 9 mice), and ΔJunD (n = 14 cells; n = 5 mice). No differences were observed in maximal current; p > 0.05 (one-way ANOVA). C, Mean ISI (in ms) at the maximal step across groups. Mean ISI was increased by ΔFosB; *p < 0.05 compared with GFP (one-way ANOVA; Holm–Sidak comparisons). D, Number of APs at the maximal step across groups. ΔFosB significantly decreased the number APs; *p < 0.05 compared with GFP (one-way ANOVA; Holm–Sidak comparisons). E, Latency from the onset of the maximal step and the first spike was assessed for each group. ΔFosB increased the latency compared with GFP; *p < 0.05 (one-way ANOVA; Holm–Sidak comparisons). F, ISI for the first and last pair of spikes at the maximal step for each group. ISI at the last pair of spikes was increased by ΔFosB compared with GFP; **p < 0.01 (two-way repeated-measures ANOVA; Holm–Sidak comparisons). All graphs display means ± SEM.
- Figure 3.
ΔFosB decreases Ih. A–C, Representative voltage trace to a hyperpolarizing current step showing Ih in hippocampal CA1 neurons expressing GFP (n = 21 cellls; n = 8 mice), ΔFosB (n = 19 cells; n = 9 mice), and ΔJunD (n = 13 cells; n = 5 mice), respectively. Arrows indicate amplitude measured at peak and S.S. D−F, I–V curves from hyperpolarizing current injections (0 to −500 pA) at peak and S.S. in GFP, ΔFosB, and ΔJunD cells. GFP cells had significant differences between peak and S.S. across currents (from −500 to −200 pA), indicative of Ih. ***p < 0.001 (two-way ANOVA; Holm–Sidak comparisons). Differences between peak and S.S. were comparably reduced in both ΔFosB (only different at steps −400 and −300 pA) and ΔJunD groups (only at −300 pA), indicative of reduced Ih. *p < 0.05, **p < 0.01 (two-way ANOVAs; Holm–Sidak comparisons). G, H, Mean maximal negative current and voltage (produced by maximal negative current), respectively, in GFP, ΔFosB, and ΔJunD cells. No differences were observed between groups; p > 0.05 (one-way ANOVA). I, Difference between peak and S.S. at maximal negative current across groups. ΔFosB significantly decreased the difference compared with GFP; **p < 0.01 (one-way ANOVA; Holm–Sidak comparisons). J, Sag ratio (S.S./peak at maximal negative current ratio) across groups. ΔFosB significantly increased the sag ratio (decreased Ih) compared with GFP; *p < 0.05 (one-way ANOVA; Holm–Sidak comparisons). All graphs display means ± SEM.
- Figure 4.
ΔFosB decreases spontaneous EPSC amplitude. A, Representative traces (−80 mV) showing sEPSCs in hippocampal CA1 neurons expressing GFP (n = 20 cells; n = 7 mice), ΔFosB (n = 16 cells; n = 6 mice), and ΔJunD (n = 9 cells; n = 5 mice). B, sEPSC frequency (in Hz) across groups. No differences in sEPSC frequency were observed. C, sEPSC peak amplitude (in pA) across groups. Both ΔFosB and ΔJunD reduced sEPSC amplitude compared with GFP; *p < 0.05 (one-way ANOVA; Holm–Sidak comparisons). D, Cumulative fraction of the peak amplitudes (5–30 pA) across groups. Both ΔFosB and ΔJunD were shifted to the left from GFP. All graphs display means ± SEM.
- Figure 5.
Blockade of ΔFosB enhances AMPA/NMDA ratio. A, Representative average number of evoked EPSCs at −70 and +40 mV in dHPC CA1 neurons expressing GFP (n = 19 cells; n = 8 mice), ΔFosB (n = 13 cells; n = 9 mice), and ΔJunD (n = 10 cells; n = 4 mice). Red lines indicate the measurement for NMDA currents, 50 ms after stimulation. B, AMPA/NMDA ratios (normalized relative to GFP) across groups. ΔJunD significantly increased the AMPA/NMDA ratio compared with GFP. C, Decay tau for NMDA currents (weighted across both fast and slow components) across groups. ΔJunD significantly reduced NMDA decay tau; *p < 0.05 (one-way ANOVA; Holm–Sidak comparisons). All graphs display means ± SEM.


Tables
- Table 1
Effects of ΔFosB overexpression or inhibition on properties of dorsal CA1 neurons.
Cell property GFP
(n = 21)ΔFosB
(n = 19)ΔJunD
(n = 14)Resting potential (mV) −66.7 ± 0.7 −67.9 ± 1.1 −66.3 -14.4 Membrane capacitance (pF) 71.6 ± 4.6 66.4 ± 5.4 60.0 ± 5.9 Membrane resistance (MΩ) 66.1 ± 9.0 58.9 ± 10.4 67.9 ± 7.9 Access resistance (MΩ) 18.7 ± 1.2 19.3 ± 1.3 18.7 ± 1.9 Input resistance (MΩ) 156.7 ± 11.9 171.9 ± 25.6 176.6 ± 15.2 Values are reported as the mean ± SEM.
In this issue


