
Main menu

  • HOME
  • CONTENT
    • Early Release
    • Featured
    • Current Issue
    • Issue Archive
    • Blog
    • Collections
    • Podcast
  • TOPICS
    • Cognition and Behavior
    • Development
    • Disorders of the Nervous System
    • History, Teaching and Public Awareness
    • Integrative Systems
    • Neuronal Excitability
    • Novel Tools and Methods
    • Sensory and Motor Systems
  • ALERTS
  • FOR AUTHORS
  • ABOUT
    • Overview
    • Editorial Board
    • For the Media
    • Privacy Policy
    • Contact Us
    • Feedback
  • SUBMIT

User menu

Search

  • Advanced search
eNeuro

eNeuro

Advanced Search


  • HOME
  • CONTENT
    • Early Release
    • Featured
    • Current Issue
    • Issue Archive
    • Blog
    • Collections
    • Podcast
  • TOPICS
    • Cognition and Behavior
    • Development
    • Disorders of the Nervous System
    • History, Teaching and Public Awareness
    • Integrative Systems
    • Neuronal Excitability
    • Novel Tools and Methods
    • Sensory and Motor Systems
  • ALERTS
  • FOR AUTHORS
  • ABOUT
    • Overview
    • Editorial Board
    • For the Media
    • Privacy Policy
    • Contact Us
    • Feedback
  • SUBMIT
PreviousNext
Research ArticleNew Research, Development

Key Brain Network Nodes Show Differential Cognitive Relevance and Developmental Trajectories during Childhood and Adolescence

Knut K. Kolskår, Dag Alnæs, Tobias Kaufmann, Geneviève Richard, Anne-Marthe Sanders, Kristine M. Ulrichsen, Torgeir Moberget, Ole A. Andreassen, Jan E. Nordvik and Lars T. Westlye
eNeuro 2 July 2018, 5 (4) ENEURO.0092-18.2018; DOI: https://doi.org/10.1523/ENEURO.0092-18.2018
Knut K. Kolskår
1NORMENT, KG Jebsen Centre for Psychosis Research, Division of Mental Health and Addiction, Oslo University Hospital and Institute of Clinical Medicine, University of Oslo, 0450 Oslo Norway
2Sunnaas Rehabilitation Hospital 1453 Bjørnemyr, Norway
3Department of Psychology, University of Oslo 0373 Oslo Norway
  • Find this author on Google Scholar
  • Find this author on PubMed
  • Search for this author on this site
Dag Alnæs
1NORMENT, KG Jebsen Centre for Psychosis Research, Division of Mental Health and Addiction, Oslo University Hospital and Institute of Clinical Medicine, University of Oslo, 0450 Oslo Norway
  • Find this author on Google Scholar
  • Find this author on PubMed
  • Search for this author on this site
  • ORCID record for Dag Alnæs
Tobias Kaufmann
1NORMENT, KG Jebsen Centre for Psychosis Research, Division of Mental Health and Addiction, Oslo University Hospital and Institute of Clinical Medicine, University of Oslo, 0450 Oslo Norway
  • Find this author on Google Scholar
  • Find this author on PubMed
  • Search for this author on this site
  • ORCID record for Tobias Kaufmann
Geneviève Richard
1NORMENT, KG Jebsen Centre for Psychosis Research, Division of Mental Health and Addiction, Oslo University Hospital and Institute of Clinical Medicine, University of Oslo, 0450 Oslo Norway
2Sunnaas Rehabilitation Hospital 1453 Bjørnemyr, Norway
3Department of Psychology, University of Oslo 0373 Oslo Norway
  • Find this author on Google Scholar
  • Find this author on PubMed
  • Search for this author on this site
  • ORCID record for Geneviève Richard
Anne-Marthe Sanders
1NORMENT, KG Jebsen Centre for Psychosis Research, Division of Mental Health and Addiction, Oslo University Hospital and Institute of Clinical Medicine, University of Oslo, 0450 Oslo Norway
2Sunnaas Rehabilitation Hospital 1453 Bjørnemyr, Norway
3Department of Psychology, University of Oslo 0373 Oslo Norway
  • Find this author on Google Scholar
  • Find this author on PubMed
  • Search for this author on this site
Kristine M. Ulrichsen
1NORMENT, KG Jebsen Centre for Psychosis Research, Division of Mental Health and Addiction, Oslo University Hospital and Institute of Clinical Medicine, University of Oslo, 0450 Oslo Norway
2Sunnaas Rehabilitation Hospital 1453 Bjørnemyr, Norway
3Department of Psychology, University of Oslo 0373 Oslo Norway
  • Find this author on Google Scholar
  • Find this author on PubMed
  • Search for this author on this site
Torgeir Moberget
1NORMENT, KG Jebsen Centre for Psychosis Research, Division of Mental Health and Addiction, Oslo University Hospital and Institute of Clinical Medicine, University of Oslo, 0450 Oslo Norway
  • Find this author on Google Scholar
  • Find this author on PubMed
  • Search for this author on this site
Ole A. Andreassen
1NORMENT, KG Jebsen Centre for Psychosis Research, Division of Mental Health and Addiction, Oslo University Hospital and Institute of Clinical Medicine, University of Oslo, 0450 Oslo Norway
  • Find this author on Google Scholar
  • Find this author on PubMed
  • Search for this author on this site
Jan E. Nordvik
2Sunnaas Rehabilitation Hospital 1453 Bjørnemyr, Norway
  • Find this author on Google Scholar
  • Find this author on PubMed
  • Search for this author on this site
  • ORCID record for Jan E. Nordvik
Lars T. Westlye
1NORMENT, KG Jebsen Centre for Psychosis Research, Division of Mental Health and Addiction, Oslo University Hospital and Institute of Clinical Medicine, University of Oslo, 0450 Oslo Norway
3Department of Psychology, University of Oslo 0373 Oslo Norway
  • Find this author on Google Scholar
  • Find this author on PubMed
  • Search for this author on this site
  • Article
  • Figures & Data
  • Info & Metrics
  • eLetters
  • PDF
Loading

Abstract

Human adolescence is a period of rapid changes in cognition and goal-directed behavior, and it constitutes a major transitional phase towards adulthood. One of the mechanisms suggested to underlie the protracted maturation of functional brain networks, is the increased network integration and segregation enhancing neural efficiency. Importantly, the increasing coordinated network interplay throughout development is mediated through functional hubs, which are highly connected brain areas suggested to be pivotal nodes for the regulation of neural activity. To elucidate brain hub development during childhood and adolescence, we estimated voxel-wise eigenvector centrality (EC) using functional magnetic resonance imaging (fMRI) data from two different psychological contexts (resting state and a working memory task), in a large cross-sectional sample (n = 754) spanning the age from 8 to 22 years, and decomposed the maps using independent component analysis (ICA). Our results reveal significant age-related centrality differences in cingulo-opercular, visual, and sensorimotor network nodes during both rest and task performance, suggesting that common neurodevelopmental processes manifest across different mental states. Supporting the functional significance of these developmental patterns, the centrality of the cingulo-opercular node was positively associated with task performance. These findings provide evidence for protracted maturation of hub properties in specific nodes of the brain connectome during the course of childhood and adolescence and suggest that cingulo-opercular centrality is a key factor supporting neurocognitive development.

  • adolescence
  • development
  • eigenvector centrality
  • fMRI
  • graph theory
  • independent component analysis

Significance Statement

Adolescence is a sensitive period during ontogeny and a maturational gateway to adulthood. A better characterization of the brain changes underpinning cognitive and emotional development occurring during this period is key to inform models of normal and abnormal adaptation. Advanced brain imaging allows for in vivo studies of the protracted maturation of brain network function and connectivity during childhood and adolescence. Here, we used functional brain imaging to identify neural hubs during two psychological contexts in 754 children and adolescents. Key regions of the brain network showed increasing importance through adolescence, and individual differences in working memory performance was associated with the centrality of cingulo-opercular network nodes, suggesting a hot spot for neurocognitive development.

Introduction

The gradual transition from childhood to adulthood is characterized by profound physical, cognitive, and emotional changes. Individual adaptation to the dynamic and socially expanding environment throughout this period is enabled by the large potential for neuroplasticity, e.g., reflected in a transformation of cortical gray matter by a massive synaptic downscaling (Spear, 2000) and increases in brain white matter coherence and volume (Paus, 2005; Westlye et al., 2010; Alnæs et al., 2018). These protracted neurodevelopmental changes form the structural backbone allowing efficient neural signaling, enabling functional integration and adaptation of the brain networks underlying the substantial cognitive and functional maturation seen over this age span (Casey et al., 2008). Of note, while adolescence marks the successful transition from childhood to adulthood for the majority, this is also the period where most mental disorders emerge, supporting the critical role of adolescence as a sensitive period during ontogeny (Paus et al., 2008).

Functional brain connectivity (FC) provides an intriguing window into the developing brain, and it has been extensively studied using resting-state functional magnetic resonance imaging (rs-fMRI). Resting-state networks (RSNs) show high spatial concordance with networks associated with task activations (Smith et al., 2009), and brain connectivity and activation are highly coordinated aspects of brain functioning (Gratton et al., 2016). In a large-scale study on children and adolescents from the Philadelphia Neurodevelopmental Cohort (PNC), Satterthwaite et al. (2014) analyzed fMRI data recorded during the performance of a cognitive task and found that a reciprocal pattern of executive-network activation and default-mode network (DMN) deactivation was associated with working memory performance. This pattern was more predictive of performance differences than activations and deactivations in isolation. Network dynamics and connectivity thus contains complementary information about the neural substrate supporting executive ability and its maturation (Power et al., 2010; Gu et al., 2015).

Whereas the hubs in the default mode and executive-networks are fairly established from five years of age (Hwang et al., 2013; Wu et al., 2013; Cao et al., 2014), key dynamic and functional characteristics of brain nodes display maturational alterations throughout adolescence (Grayson et al., 2014). How these changes support the marked increase in executive abilities during this period is still unclear.

One commonly used metric for investigating hub properties is centrality, which reflects the number and strength of connections of a given node to the rest of the network.

Previous studies have reported a maturational increase in centrality of task positive networks like frontoparietal, cingulo-opercular and task negative DMN nodes (Fransson et al., 2011; Hwang et al., 2013; Cao et al., 2016). While most developmental studies on brain network connectivity have employed rs-fMRI, cognitive engagement modulates the connectivity and centrality of brain nodes (Chadick and Gazzaley, 2011; Cole et al., 2013; Alnæs et al., 2015a,b; Mišić and Sporns, 2016; Kaufmann et al., 2017b). Further, higher cognitive load has been shown to increase the sensitivity for age-related differences in FC (Dørum et al., 2017), motivating investigation of brain dynamics beyond the unconstrained resting state.

Here, to characterize age-related differences in functional connectivity in the adolescent brain, we estimated whole-brain voxel-wise eigenvector centrality (EC) of fMRI data collected during resting state and a working memory task (fractal n-back) for 754 children and adolescents aged 8–22 years from the PNC (Satterthwaite et al., 2014). To allow for multiple levels of inference and to investigate the hierarchical organization of the brain network nodes, we decomposed the voxel-wise EC maps using independent component analysis (ICA) and tested for main effects of task, age, and their interactions both on the voxel-wise EC maps and the ICA subject weights. Based on previous studies and models of adolescent brain development, we hypothesized (1) increased centrality in task positive networks and decreased centrality in DMN, sensorimotor, and visual networks in response to task engagement; (2) and that these centrality changes would be associated with task performance. Furthermore, (3) we hypothesized that these effects on network centrality would parallel task-related activation through a characteristic pattern of increased activation in networks involved in task engagement and decreased activation in DMN. Lastly, we hypothesized (4) that the centrality of key nodes would show evidence of protracted maturation during the sampled age-span, with differential age-related differences across nodes and conditions, possibly indicating increasing age-dependent differentiation between the two psychological contexts for both activation and centrality.

Materials and Methods

Sample and exclusion criteria

The analysis was performed on the publicly available PNC (Satterthwaite et al., 2014), access permission number 8642. All participants gave written informed consent, and the study was approved by the review boards of the University of Pennsylvania and the Children’s hospital of Philadelphia. After exclusion of participants with severe medical and psychiatric conditions, missing task responses, and poor normalization of fMRI data, the final sample comprised 754 individuals aged 8–22 years (405 males, mean 15 years old, SD 3.3 years). All subjects were recruited through the Center for Applied Genomics at The Children’s Hospital in Philadelphia.

MRI acquisition

MRI scans were acquired at the University of Pennsylvania on a 3T Siemens TIM Trio scanner. An anatomic scan used here for registration purposes was acquired using a 3D T1-weighted magnetization prepared rapid acquisition gradient echo (MPRAGE) sequence (TR: 1.81 s, TE: 3.5 ms, FA: 9°, FOV: 240 × 180 mm, slice thickness: 1 mm, slices: 160). Functional images were acquired using single-shot, interleaved multislice, gradient-echo, echo planar imaging (GE-EPI) sequence (TR: 3.0 s, TE: 32 ms, FA: 90°, FOV: 192 mm2).

fMRI task paradigm and behavior

The task has been previously described in detail (Satterthwaite et al., 2013). Briefly, we included data from two fMRI runs: One was a resting-state run (eyes open while fixating on central fixation cross), while the other was collected while participants performed a fractal version of the n-back task. The n-back task consisted of three load levels: 0-back, 1-back, and 2-back. During 0-back, participants were asked to press a button every time a target fractal was presented. During 1- and 2-back, participants were asked to respond whenever the presented fractal was identical to the one presented one or two trials prior, respectively. Each run consisted of three blocks per condition, and each block consisted of 20 trials, of which five were targets and 15 were non-target fractals. We computed the total hit-rate, false-positive rate, and D-prime. The latter was calculated by subtracting z score for false positives from the z score for hit-rate from the in-scanner responses during the n-back task (Stanislaw and Todorov, 1999).

fMRI data processing

fMRI data were processed using FMRI Expert Analysis Tool (FEAT) version 6.00, from FMRIB’s Software Library (FSL; Smith et al., 2004; Jenkinson et al., 2012), and included the following steps: correction for motion using MCFLIRT (Jenkinson et al., 2002), linear trend removal and high-pass filtering (0.01 Hz), removal of non-brain tissue using BET (Smith, 2002), spatial smoothing with a Gaussian kernel of full width at half maximum (FWHM) of 6 mm (SUSAN; Smith and Brady, 1997). We employed automated procedures for data denoising, including (FIX; Salimi-Khorshidi et al., 2014) and ICA-AROMA (Pruim et al., 2015), which has been reported to reduce risk of inflating age-related effects due to higher in-scanner head-movement (Kaufmann et al., 2017a). Further, we applied nonlinear registration using FNIRT to Montreal Neurologic Institute (MNI) 152 standard space using the T1-weighted scan as an intermediate.

EC mapping (ECM)

Following previous studies (Alnæs et al., 2015b; Skåtun et al., 2016), we first created a group mask containing common voxels across all participants and sessions (n-back and rest). To accommodate images to EC estimation, the pre-processed and normalized n-back, resting state runs and analysis mask were resampled to an isotropic voxel resolution of 3 mm, converted to the Vista image format (Pope and Lowe, 1994) using LIPSIA (Lohmann et al., 2001) and submitted to estimation of voxel-wise EC (Lohmann et al., 2010) using the absolute of the full correlation coefficients (equal weight to positive and negative correlations), yielding one EC map per run for each participant. Individual EC maps and brain masks were converted to nifti format, resampled to 2-mm isotropic resolution, and submitted to further analysis (ICA and voxel-wise statistics).

ICA on EC maps

The 1508 EC maps were decomposed into a fixed set of 40 components, for optimal trade-off between spatial resolution of components and not over-fitting the model, using spatial ICA in MELODIC (Beckmann and Smith, 2004). To assess effects of condition on EC for each IC, the associated subject-weights from the ICA was used to calculate the difference in subject weights between rest and n-back runs for each IC. For visualization of the network structure, we used subject weights for both n-back and rest to form a component by component correlation matrix, which was submitted to hierarchical clustering using FSLNets (Smith et al., 2011). ICs covering white matter and CSF were excluded before clustering.

Dual regression

To assess the relationships between the centrality and task-related activation of the ECM-based ICs, we extracted individual time series from each of the component spatial maps from the n-back data using dual regression (Nickerson et al., 2017). GLMs were estimated for each participant and each component’s time series, modeling 0-back, 1-back, and 2-back as well as responses and instructions. As a measure of BOLD task effect, β-estimates for 0-back was subtracted from the average of 1-back and 2-back β-estimates.

Voxel-wise analysis

For transparency, we compared our main results obtained using ICA-based decomposition of EC maps with voxel-wise effects of task and age and their interactions on EC using FSL randomize (Winkler et al., 2014). First, we computed difference maps by subtracting the individual resting-state EC maps from the n-back EC maps. We tested for main effect of condition by performing a one-sample t test on the difference maps (n-back minus rest). We further tested for associations with age by performing linear regression on rest, n-back, and the difference maps, including sex as covariate. Statistical inference was done by permutation testing with 5000 iterations and threshold-free cluster enhancement (Smith and Nichols, 2009).

Statistical analysis

Analyses beyond the voxel- and imaging domain were performed in MATLAB 2014a (MathWorks). To test for effects of age on EC, we performed linear regressions with the subject weights from n-back or resting-state runs as dependent variable, and age and sex as independent variables for all ICs. To test for main effect of task on each component, we performed one-sample t tests on the difference scores between rest and n-back weights. To test for interactions between task and age on EC, we performed linear regressions with the difference score as dependent variable and age and sex as independent variables. To test for associations between EC and task performance (hit-rate, false positives, and D-prime), we used the same derived difference score as dependent variable, and hit-rate, false positives, or D-prime as independent variables in separate analyses, in addition to age and sex.

In the same manner, using the β-estimates derived from dual regression on the n-back data, we tested for effect of task by performing one-sample t tests. To test for effect of age, we performed linear regression with task effect as the dependent variable and age and sex as independent variables.

To test for associations between task-related effects on centrality and activation for each IC, we correlated the difference EC-score (n-back minus rest) with β-estimates for task engagement. To account for multiple comparisons, we adjusted the false discovery rate (FDR, q = 0.05) across all tests and components (Genovese et al., 2002). For visualization of the association between centrality and activation, component-wise EC-difference-weights and β-estimates for the n-back task was imported to R (http://www.r-project.org) and plotted with the ggplot2-package (Wickham, 2009).

Results

ICA and hierarchical clustering

ICA of EC maps yielded 31 spatial maps corresponding to cortical gray-matter components, including frontoparietal, default mode, visual networks, and nine maps corresponding to white matter and CSF (for an anatomic description of the 31 maps included in the hierarchical clustering, see Table 1). Figure 1,1-1 shows the hierarchical clustering based on the correlation between IC-weights across n-back and rest, and Figure 1,1-2 shows the associated spatial maps. Clustering revealed a structure coherent with known large-scale functional networks, largely reflecting visual, sensorimotor, frontoparietal, subcortical, cingulo-opercular, and DMN.

View this table:
  • View inline
  • View popup
Table 1.

Anatomic location for each IC

Figure 1.
  • Download figure
  • Open in new tab
  • Download powerpoint
Figure 1.

Results from the ICA analysis and corresponding statistics. (1-1) The hierarchical clustering of the components, based on the partial correlations between the difference weights (n-back minus rest). (1-2) Visualization of the IC spatial maps. (1-3) Visualization of statistics reflecting the effect of age on EC during both n-back and rest, and the interaction between age and task engagement respectively. (1-4) The effect of task engagement on EC for the ICs, and effect of EC on hit-rate, false positives and d-prime. (1-5) The significant effects of age on task activation, and the effect of task engagement. Summary of statistics for task effect is displayed in table 2, age effects in table 3. (1-6) The IC-subject weight correlation-matrix. Correlations across both conditions are displayed below the diagonal and was used for the hierarchical clustering displayed in 1-1. Above the diagonal are the correlations between IC difference-weights (n-back minus rest).

Component-wise EC task effects

Task engagement (n-back > rest) was associated with distributed differences in EC across most nodes. Figure 1,1-4 displays significant (FDR corrected, q = 0.05) associations between EC, task engagement and task performance, and Table 2 summarizes corresponding statistics. All frontoparietal components displayed a significant increase in EC with task engagement, and for one of the components (IC 2) higher centrality was significantly associated with better performance. Three of the four cingulo-opercular nodes displayed significant increase of centrality with task engagement, and higher EC was associated with better performance (two of four ICs). The subcortical components displayed a mixed pattern of centrality changes, thalamus decreased, but cerebellum increased with task engagement. Higher EC for both cerebellum and thalamus was associated with better performance. DMN components displayed both increase (two of five ICs) and decrease (two of five ICs) in centrality with task engagement, but no significant associations with task performance. Sensorimotor components displayed reduced centrality (five of six ICs) with task engagement, and for two of the components, the degree of reduction was associated with task performance. Visual components displayed a mixed pattern with both increased (three of seven ICs) and decreased (three of seven ICs) centrality with task engagement, and centrality in two components showed negative correlations with task performance.

View this table:
  • View inline
  • View popup
Table 2.

Effect of task engagement on EC (n-back minus rest) and effect of EC on hit-rate, false positives, and D-prime, and effect of task on activation

Component-wise activation

Significant effects (FDR corrected, q = 0.05) of task engagement are displayed in Figure 1,1-5, lower panel. Table 2 summarizes the corresponding statistics. The component-wise activation pattern revealed several similarities with the pattern for EC. Task engagement was associated with significantly increased activation in the frontoparietal (six of seven ICs) and cingulo-opercular (four of four ICs) components. Among the subcortical components, we found increased activation in cerebellum and decreased activation in putamen. The visual, sensorimotor, and DMN components displayed reduced activation during task.

Associations between centrality and activation

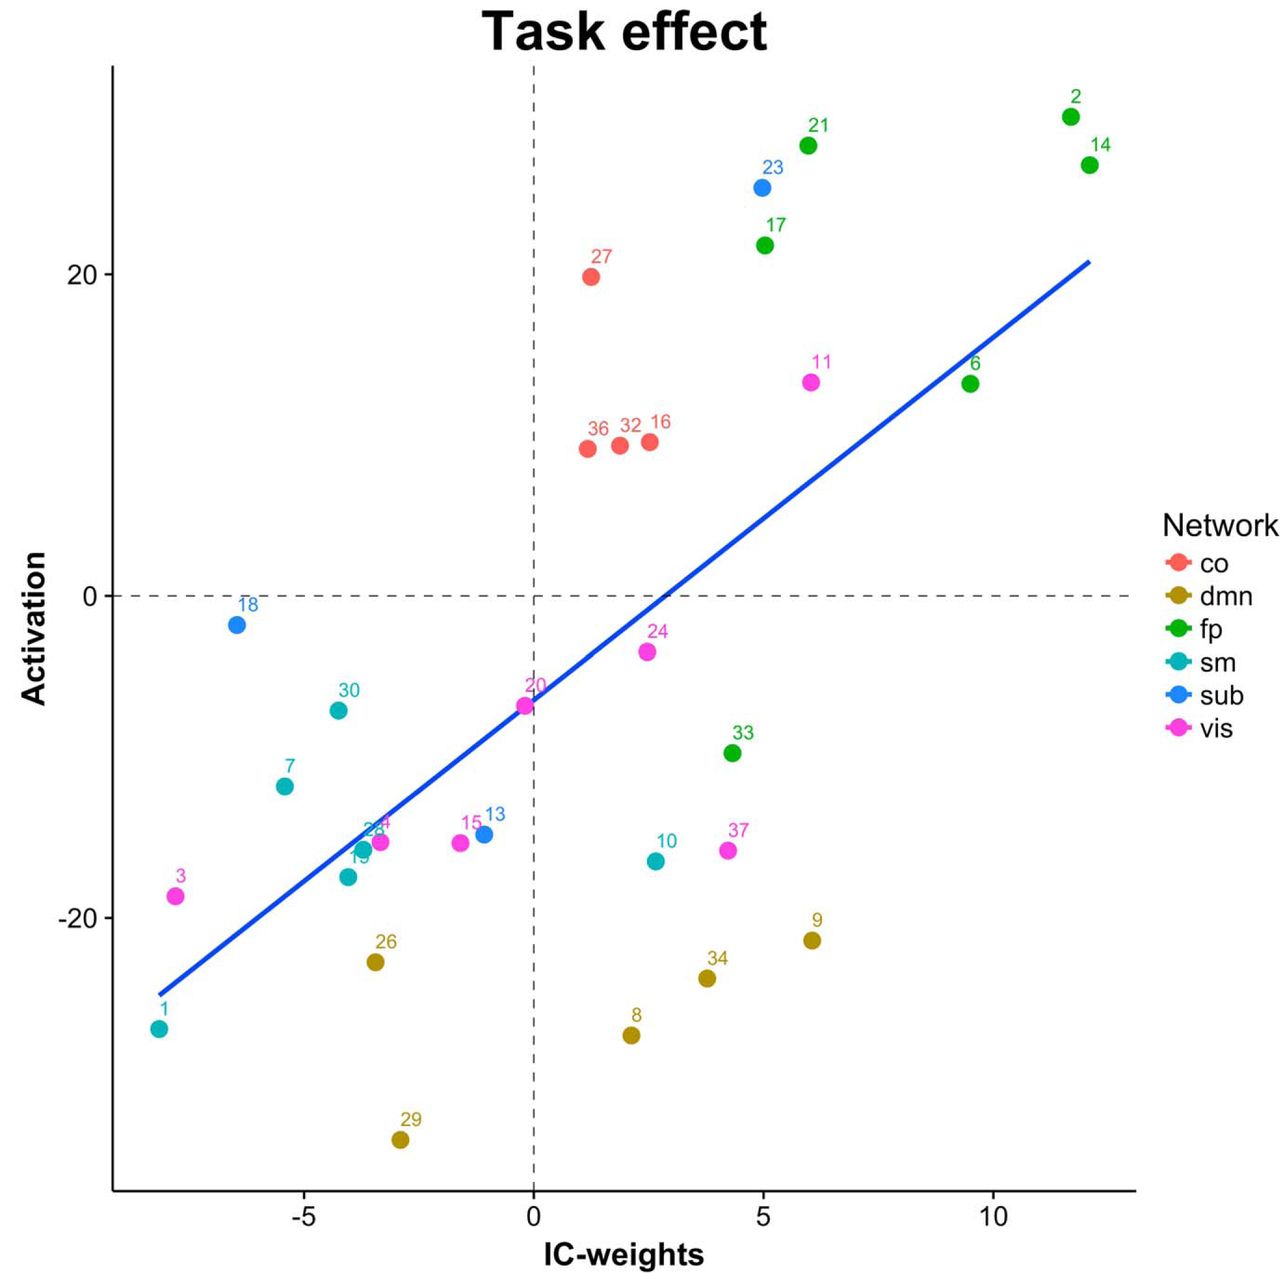
Overall, we found a positive correlation between activation and EC (r = 0.64, p = 1.11e−4): components showing increased activity with task generally also showed task-related increases in EC. Figure 2 displays the component-wise association between task-related activation and differences in EC between n-back and rest. However, the results revealed some notable exceptions. For example, whereas components in the frontoparietal cluster showed both strong task-related activation and increased centrality, and visual and sensorimotor cluster components showed deactivation and decreased centrality, DMN components showed overall task related deactivations, but a mixed pattern of increased and decreased centrality.

Figure 2.
  • Download figure
  • Open in new tab
  • Download powerpoint
Figure 2.

Associations between BOLD and EC changes due to task engagement. co: cingulo-opercular network; dmn: default-mode network; fp: frontoparietal; sm: sensorimotor; sub: subcortical; vis: visual.

Component-wise associations with age

Figure 1, 1-3 and 1-5, upper panel, shows the significant (FDR corrected, q = 0.05) associations between age centrality and task-related activation, whereas Figure 3 shows the age-associated trajectory for selected components. Table 3 summarizes the corresponding statistics. For frontoparietal components, we found significant positive associations between centrality and age in one component during n-back and two components during rest. One of the frontoparietal components displayed a significant interaction effect suggesting a stronger negative age effect during rest compared to n-back. In contrast, we found significantly increased activation with increasing age across all frontoparietal components, with the exception of one. Cingulo-opercular components displayed significant age-related increases in EC in two of four components, anterior cingulate and insula respectively. The increase in EC was paralleled by significant increase in activation in all cingulo-opercular components. Among the subcortical components, thalamus and cerebellum showed significant age-related decreased centrality, and the latter also showed age-related increased activation. Within the DMN cluster, one component showed significant age-related decrease in EC during n-back. In contrast, all DMN-components showed significant decrease in activation with increasing age, indicating stronger deactivation with higher age. Visual and sensorimotor components displayed a highly similar pattern: age-related increases in EC during both task and rest, but decreased activation with higher age. The exception was one component, showing age-related increases both in centrality and activation.

Figure 3.
  • Download figure
  • Open in new tab
  • Download powerpoint
Figure 3.

Age effect on EC during both n-back and rest on the left panel, and activation in different network nodes on the right panel. (3-1) Frontoparietal, (3-2) cingulo-opercular, (3-3) DMN, (3-4) visual, (3-5) sensorimotor, and (3-6) subcortical. Nonsignificant associations are annotated.

View this table:
  • View inline
  • View popup
Table 3.

Effect of age on EC in n-back, rest, and the interaction between n-back and age, and effect of age on activation

Voxel-wise analysis

Figure 4 shows the results from the full-brain voxel-wise analyses. Figure 4,4-1 displays the difference in centrality during n-back compared to rest, suggesting higher centrality in frontoparietal areas and posterior DMN and lower centrality in sensorimotor areas, mirroring the ICA-based analysis. Figure 4,4-2 and 4-3, shows associations between centrality and age during n-back and rest, respectively. We found significant age-related increases in centrality in both conditions in visual and sensorimotor regions as well as in the anterior cingulate. During n-back, we found significant age-related differences in the frontal pole, extending to the superior frontal gyrus. Negative associations with age were found in large white matter and CSF regions. However, there was no significant age effect in the derived difference maps, indicating no evidence of interactions between age and condition.

Figure 4.
  • Download figure
  • Open in new tab
  • Download powerpoint
Figure 4.

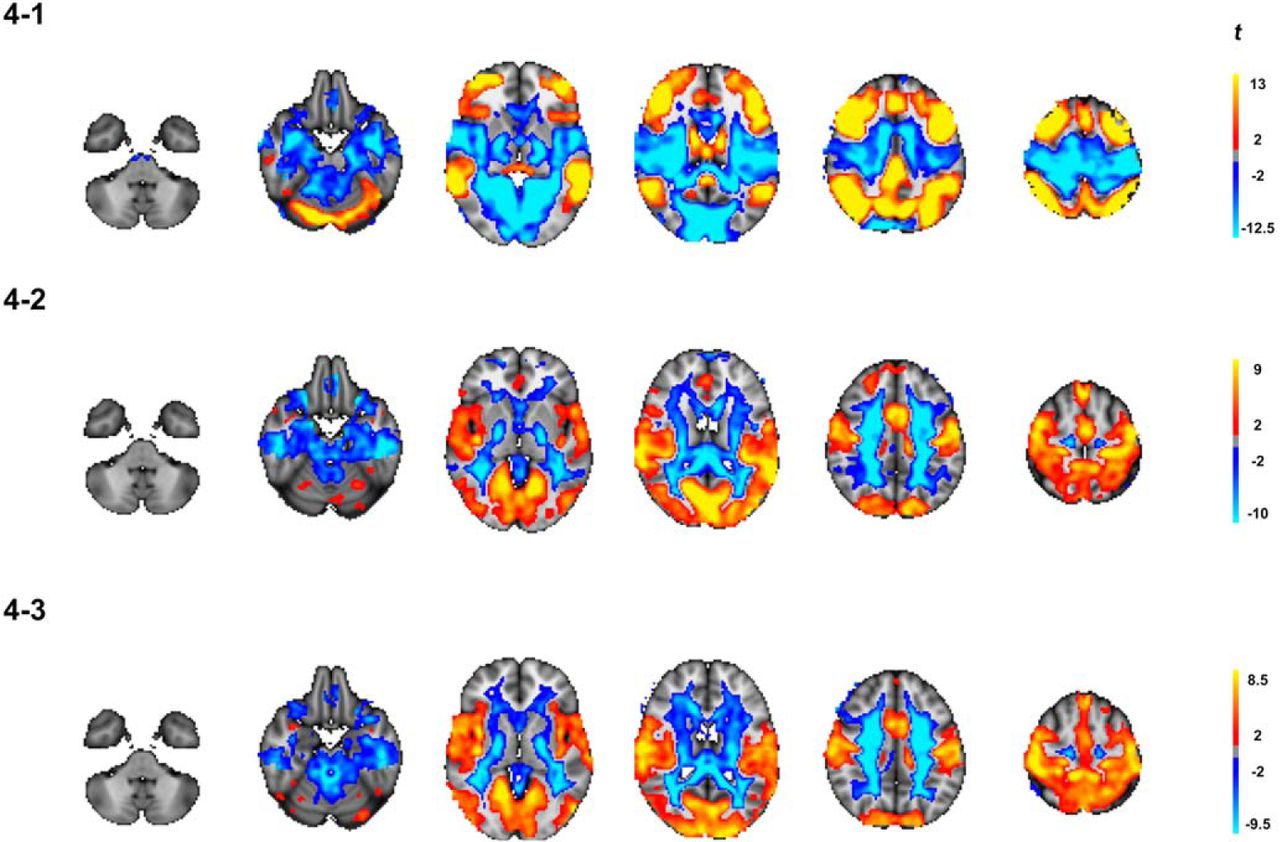
Results from full-brain voxel-wise analysis. (4-1) Significant changes in EC associated with differentiation between task and rest across the age-span. (4-2) Age-effect in the n-back data and (4-3) Age-effect in the rest-data. All maps were corrected for multiple comparisons using permutation testing (n = 5000) and TFCE with an alpha of 0.05 (FWE, two-tailed). Only significant results are displayed.

Discussion

Using graph-based metrics and data-driven decomposition of fMRI data obtained during an unconstrained resting state condition and performance of an n-back task, the current study yielded three main findings. First, we demonstrated the sensitivity of EC to differences in task demands. Next, we revealed age-dependent alterations in the centrality of key brain networks, with increasing centrality in sensorimotor, visual, and cingulo-opercular network components and decreasing centrality in thalamus, cerebellum, and left temporal gyrus. Finally, the lack of condition by age interactions suggests that these age-related differences in network centrality are not strongly dependent on mental state, supporting that the maturation of the functional architecture of the brain is relatively pervasive across psychological contexts. These main findings will be discussed below.

Brain network centrality and task engagement

The most prominent finding in the current study was increased centrality of frontoparietal, cerebellar and cingulo-opercular components, and decreased centrality in sensorimotor and thalamic components with task engagement, which align with previous investigations of EC in adults (Alnæs et al., 2015b; Hearne et al., 2017). FC during task engagement is associated with increased cross-network connectivity, and decreased network modularity (Di et al., 2013; Cole et al., 2014; Shine et al., 2016). This dynamic shift in connectivity pattern in response to task demands supports increased global effectiveness, through shortening path lengths in the network, and increased efficiency of information transfer across the global network (Stanley et al., 2015). These alterations in brain network dynamics enable flexible reconfiguration in response to task demands, which supports executive control, including working memory performance (Braun et al., 2015; Stanley et al., 2015). Among the proposed neurocognitive mechanisms is an increased influence of executive nodes exerting top down control (Chadick and Gazzaley, 2011), as well as suppression of task-irrelevant nodes to minimize interference which may be detrimental to performance (Tomasi et al., 2014). Indeed, within-network visual and sensorimotor connectivity have been reported to decrease with task demand, with simultaneous increases in connectivity with frontoparietal and cerebellar nodes (Kellermann et al., 2012; Spadone et al., 2015; Brissenden et al., 2016; Kwon et al., 2017), which facilitates both suppression and biasing of sensory input. Thalamus plays a key role in the gating of sensory input toward higher cortical network structures (Halassa and Kastner, 2017; Hwang et al., 2017). Interestingly, reduced connectivity between specific subclusters of the thalamus and visual and motor cortices in response to task demands has been reported, also in absence of altered FC with executive or DMN networks (Fan et al., 2015). In light of these observations, our findings indicate that task engagement reduces thalamic FC with cortical areas, facilitating the suppression and filtering of sensory signal during task engagement.

Our results align with previous findings highlighting the importance of increased influence of executive and cerebellar nodes during task engagement, as higher cingulo-opercular, cerebellar and frontoparietal centrality was associated with better task performance, and higher centrality in visual and sensorimotor nodes was associated with lower performance. Thalamus in particular was further associated with decrease in centrality during task engagement reflecting a drop in global FC, and the degree of differentiation between task and rest EC was positively associated with performance. Indeed, our results support both the interference hypothesis (D’Esposito et al., 1999), suggesting that performance during the n-back task is supported by increased influence from frontoparietal and cingulo-opercular nodes, providing top-down attentional control, as well as the sensory gating hypothesis (Cromwell et al., 2008), reflected through the decreased thalamic EC, which was associated with better performance.

Notably, to a large extent, the centrality pattern observed during task engagement paralleled the observed activation patterns. Studying activation and connectivity across several cognitive tasks, Gratton et al. (2016) reported coordinated changes in connectivity and activation, in which an increase in both measures were observed for brain regions involved in active task control. This supports the notion of connectivity and activation as coordinated aspects of brain functioning. Overall, our results comply with these findings of coordinated activity and network changes for the frontoparietal and the cingulo-opercular-network. However, while the DMN displayed a task-related increase in centrality, it also displayed the commonly observed deactivation in response to task demands. This could reflect a coordinated disengagement, as previous studies have reported task-driven increases in internal DMN connectivity and coherence during cognitive engagement (Anticevic et al., 2012; Goparaju et al., 2014). On the other hand, recent studies using a graph theoretical approach alternatively suggest that the DMN dynamically changes its cross talk with other networks during task execution (Vatansever et al., 2015a,b) and displays larger integration with the full connectome. In particular, variability in functional connectivity between executive networks and DMN during an executive task was shown to be positively associated with performance (Douw et al., 2016). Taken together, there is still a large degree of uncertainty regarding DMN involvement during task engagement, and further studies are needed to gain a better understanding of the DMN dynamics and its implications for brain development and cognitive functioning.

Age-related differences in activation

In line with our expectations and previous activation analysis in an overlapping sample (Satterthwaite et al., 2013), our analysis revealed age-related increases in the activation of frontoparietal components and increased deactivation of visual and DMN components, suggesting increased differentiation of these networks with age in response to task demands. We also observed additional age-related effects in cingulo-opercular and subcortical components, which were not reported earlier. This discrepancy may be related to higher sensitivity for the current ICA-based approach compared to the voxel-wise analysis, allowing for higher component-wise specificity and effectively reducing number of comparisons.

Age-related differences in centrality

For the connectivity and graph-based analysis, we found increasing centrality with increasing age in key cingulo-opercular components, as well as posterior cingulate, and superior frontal gyrus, reflecting increased centrality in task positive visual and sensorimotor components, along with reductions in thalamus, cerebellum and temporal gyrus during both n-back and rest. We found no significant interaction effects between task and age. Although one should be cautious when interpreting null findings, the lack of significant interactions suggests that age-related differences in network characteristics are not strongly dependent on cognitive load. A recent large-scale developmental study demonstrated that maturation of the structure and organization of the brain functional connectome is characterized by increasing segregation of large-scale functional networks, along with differentiation of the various networks’ influence on the full connectome (Gu et al., 2015). Indeed, converging evidence points toward an increasing global influence from DMN in general, and cingulo-opercular network nodes during cognitive processing, as hallmarks of healthy development (Gu et al., 2015; Marek et al., 2015). Specifically, Marek et al. (2015) reported that maturational increase in inhibitory control during early adolescence is accompanied by increased between-network connectivity, in particular within the sensorimotor, visual, and cingulo-opercular networks. Furthermore, temporal variability in cingulo-opercular connectivity has been suggested to serve as a proxy for brain maturation (Sato et al., 2015b).

The importance of the cingulo-opercular network for cognitive functioning is further supported by studies investigating both healthy adults and clinical groups. Cingulo-opercular activity in healthy adults is associated with the ability to maintain sustained attention and integrate feedback (Cocchi et al., 2013), and within-network efficiency measured as degree of edge density has been linked to cognitive flexibility (Sheffield et al., 2016). Complementary, decreased functional connectivity between cingulo-opercular, sensorimotor, and DMN nodes with aging has been linked to deteriorated cognitive performance (Meier et al., 2012), and lesions targeting hub cingulo-opercular nodes are associated with greater cognitive impairment compared to non-hub nodes (Warren et al., 2014). Indeed, structural abnormalities in hubs has been found to be overrepresented across a range of brain disorders (Crossley et al., 2014), and abnormalities in anterior cingulate of the cingulo-opercular network was proposed as one of the key brain predictors for schizophrenia. Identifying deviant hub development may show promise as a biomarker for risk of future psychopathology in the adolescent brain, as well as being a predictive marker for prognosis and the degree of symptom severity following brain insults.

Our results only displayed maturational effect in one of six frontoparietal components, and thus revealed sparse age associations with the centrality of the frontoparietal network. Recent studies suggest that maturation of task positive networks may be better reflected by dynamic rather than static measures of functional connectivity, and that development as well as aging are accompanied by changes in dynamic transitions between brain states, operationalized through temporal variability in between-network connectivity (Ryali et al., 2016; Córdova-Palomera et al., 2017; Faghiri et al., 2017). Thus, graph and centrality measures based on a static apprehension of the brain connectome may fail to capture key aspects of maturational differences in the brain temporal dynamics.

The most prominent age-related reduction in centrality was seen in thalamus and cerebellum, converging with previous reports (Baker et al., 2015; Sato et al., 2015a; Petrican et al., 2017). Subcortical nodes have been reported to display enhanced connectivity with prefrontal nodes during adolescence (Ezekiel et al., 2013; Sato et al., 2015a). In conjunction, these findings suggest that subcortical networks reduce its influence throughout adolescence, through a drop in internal connectivity, shifting toward higher influence from frontal cortices and increased top-down control (Baker et al., 2015). Indeed, aberrant thalamo-cortical connectivity in adults have been linked to mental disorders (Wang et al., 2015; Skåtun et al., 2018), where the suggested mechanisms include altered inhibition of sensory signaling. In line with the notion that cognitive and emotional development during childhood and adolescence is accompanied and supported by substantial tuning and specialization of brain network activation and connectivity, it was recently demonstrated that the brain connectome develops into a more stable and individualized pattern, and that a delay in this development is associated with increased burden of mental health issues (Kaufmann et al., 2017a).The balance between maintaining a stable and idiosyncratic connectivity pattern across contexts on one hand and brain network flexibility in response to dynamic contextual changes on the other may reflect a key characteristic of a healthy mind. Delineating the maturational trajectories of dynamic shifts in hub properties between mental states may provide important clues for healthy and pathologic brain development, as well as shed light on adult neuronal pathology. Indeed, degree of damage to hub locations have been shown to be a key predictor of cognitive impairment (Warren et al., 2014).

Limitations

The current study employed a cross-sectional design. This limits the conclusions that can be made, as there is no measure of within-person changes, and cohort effects cannot be ruled out. To further differentiate healthy and pathologic development, longitudinal studies will be of importance to better identify markers for delayed and aberrant maturation. Furthermore, the mounting evidence for misinterpreted motion-driven age effects in previous developmental studies on FC (Power et al., 2012), calls for caution when interpreting maturational findings. Although we implemented stringent procedures for data denoising (Kaufmann et al., 2017a), it is not possible to completely rule out residual motion effects as a confounder regarding age-related findings.

Conclusion

Our study adds to the mounting evidence supporting the importance of hub development for healthy maturation during adolescence. The activation and centrality of cingulo-opercular components were associated with task engagement, task performance, as well as increasing age. This supports the importance of the hub properties of cerebellum and cingulo-opercular network as key to healthy development of executive capacities, as well as its vulnerability to injuries and deviant development.

Footnotes

  • The authors declare no competing financial interests.

  • This work was supported by Research Council of Norway Grants 223273 and 249795; South-Eastern Norway Regional Health Authority Grants 2014097, 2015044, 2015073, and 2016083; and the Norwegian ExtraFoundation for Health and Rehabilitation. Support for the collection of the data sets was provided by the two grants RC2MH089983 awarded to R. Gur and RC2MH089924 awarded to H. Hakonarson.

This is an open-access article distributed under the terms of the Creative Commons Attribution 4.0 International license, which permits unrestricted use, distribution and reproduction in any medium provided that the original work is properly attributed.

References

  1. ↵
    Alnæs D, Kaufmann T, Richard G, Duff EP, Sneve MH, Endestad T, Nordvik JE, Andreassen OA, Smith SM, Westlye LT (2015a) Attentional load modulates large-scale functional brain connectivity beyond the core attention networks. Neuroimage 109:260–272. doi:10.1016/j.neuroimage.2015.01.026
    OpenUrlCrossRefPubMed
  2. ↵
    Alnæs D, Sneve MH, Richard G, Skåtun KC, Kaufmann T, Nordvik JE, Andreassen OA, Endestad T, Laeng B, Westlye LT (2015b) Functional connectivity indicates differential roles for the intraparietal sulcus and the superior parietal lobule in multiple object tracking. Neuroimage 123:129–137. doi:10.1016/j.neuroimage.2015.08.029
    OpenUrlCrossRef
  3. ↵
    Alnæs D, Kaufmann T, Doan NT, Córdova-Palomera A, Wang Y, Bettella F, Moberget T, Andreassen OA, Westlye LT (2018) Association of heritable cognitive ability and psychopathology with white matter properties in children and adolescents. JAMA Psychiatry 75:287–295.
    OpenUrl
  4. ↵
    Anticevic A, Cole MW, Murray JD, Corlett PR, Wang XJ, Krystal JH (2012) The role of default network deactivation in cognition and disease. Trends Cogn Sci 16:584–592. doi:10.1016/j.tics.2012.10.008 pmid:23142417
    OpenUrlCrossRefPubMed
  5. ↵
    Baker STE, Lubman DI, Yücel M, Allen NB, Whittle S, Fulcher BD, Zalesky A, Fornito A (2015) Developmental changes in brain network hub connectivity in late adolescence. J Neurosci 35:9078–9087. doi:10.1523/JNEUROSCI.5043-14.2015 pmid:26085632
    OpenUrlAbstract/FREE Full Text
  6. ↵
    Beckmann CF, Smith SM (2004) Probabilistic independent component analysis for functional magnetic resonance imaging. IEEE Trans Med Imaging 23:137–152. doi:10.1109/TMI.2003.822821 pmid:14964560
    OpenUrlCrossRefPubMed
  7. ↵
    Braun U, Schäfer A, Walter H, Erk S, Romanczuk-Seiferth N, Haddad L, Schweiger JI, Grimm O, Heinz A, Tost H, Meyer-Lindenberg A, Bassett DS (2015) Dynamic reconfiguration of frontal brain networks during executive cognition in humans. Proc Natl Acad Sci USA 112:11678–11683. doi:10.1073/pnas.1422487112 pmid:26324898
    OpenUrlAbstract/FREE Full Text
  8. ↵
    Brissenden JA, Levin EJ, Osher DE, Halko MA, Somers DC (2016) Functional evidence for a cerebellar node of the dorsal attention network. J Neurosci 36:6083–6096 . doi:10.1523/JNEUROSCI.0344-16.2016 pmid:27251628
    OpenUrlAbstract/FREE Full Text
  9. ↵
    Cao M, Wang JH, Dai ZJ, Cao XY, Jiang LL, Fan FM, Song XW, Xia MR, Shu N, Dong Q, Milham MP, Castellanos FX, Zuo XN, He Y (2014) Topological organization of the human brain functional connectome across the lifespan. Dev Cogn Neurosci 7:76–93. doi:10.1016/j.dcn.2013.11.004 pmid:24333927
    OpenUrlCrossRefPubMed
  10. ↵
    Cao M, Huang H, Peng Y, Dong Q, He Y (2016) Toward developmental connectomics of the human brain. Front Neuroanat 10:25. doi:10.3389/fnana.2016.00025 pmid:27064378
    OpenUrlCrossRefPubMed
  11. ↵
    Casey BJ, Jones RM, Hare TA (2008) The adolescent brain. Ann NY Acad Sci 1124:111–126. doi:10.1196/annals.1440.010 pmid:18400927
    OpenUrlCrossRefPubMed
  12. ↵
    Chadick JZ, Gazzaley A (2011) Differential coupling of visual cortex with default or frontal-parietal network based on goals. Nat Neurosci 14:830–832. doi:10.1038/nn.2823 pmid:21623362
    OpenUrlCrossRefPubMed
  13. ↵
    Cocchi L, Zalesky A, Fornito A, Mattingley JB (2013) Dynamic cooperation and competition between brain systems during cognitive control. Trends Cogn Sci 17:493–501. doi:10.1016/j.tics.2013.08.006 pmid:24021711
    OpenUrlCrossRefPubMed
  14. ↵
    Cole MW, Reynolds JR, Power JD, Repovs G, Anticevic A, Braver TS (2013) Multi-task connectivity reveals flexible hubs for adaptive task control. Nat Neurosci 16:1348–1355. doi:10.1038/nn.3470 pmid:23892552
    OpenUrlCrossRefPubMed
  15. ↵
    Cole MW, Bassett DS, Power JD, Braver TS, Petersen SE (2014) Intrinsic and task-evoked network architectures of the human brain. Neuron 83:238–251. doi:10.1016/j.neuron.2014.05.014 pmid:24991964
    OpenUrlCrossRefPubMed
  16. ↵
    Córdova-Palomera A, Kaufmann T, Persson K, Alnæs D, Doan NT, Moberget T, Lund MJ, Barca ML, Engvig A, Brækhus A, Engedal K, Andreassen OA, Selbæk G, Westlye LT (2017) Disrupted global metastability and static and dynamic brain connectivity across individuals in the Alzheimer’s disease continuum. Sci Rep 7:40268. doi:10.1038/srep40268
    OpenUrlCrossRef
  17. ↵
    Cromwell HC, Mears RP, Wan L, Boutros NN (2008) Sensory gating: a translational effort from basic to clinical science. Clin EEG Neurosci 39:69–72. doi:10.1177/155005940803900209
    OpenUrlCrossRefPubMed
  18. ↵
    Crossley NA, Mechelli A, Scott J, Carletti F, Fox PT, McGuire P, Bullmore ET (2014) The hubs of the human connectome are generally implicated in the anatomy of brain disorders. Brain 137:2382–2395. doi:10.1093/brain/awu132
    OpenUrlCrossRefPubMed
  19. ↵
    D’Esposito M, Postle BR, Jonides J, Smith EE (1999) The neural substrate and temporal dynamics of interference effects in working memory as revealed by event-related functional MRI. Proc Natl Acad Sci USA 96:7514–7519 . doi:10.1073/pnas.96.13.7514
    OpenUrlAbstract/FREE Full Text
  20. ↵
    Di X, Gohel S, Kim EH, Biswal BB (2013) Task vs. rest-different network configurations between the coactivation and the resting-state brain networks. Front Hum Neurosci 7:493. doi:10.3389/fnhum.2013.00493 pmid:24062654
    OpenUrlCrossRefPubMed
  21. ↵
    Dørum ES, Kaufmann T, Alnæs D, Andreassen OA, Richard G, Kolskår KK, Nordvik JE, Westlye LT (2017) Increased sensitivity to age-related differences in brain functional connectivity during continuous multiple object tracking compared to resting-state. NeuroImage 148:364–372. doi:10.1016/j.neuroimage.2017.01.048
    OpenUrlCrossRef
  22. ↵
    Douw L, Wakeman DG, Tanaka N, Liu H, Stufflebeam SM (2016) State-dependent variability of dynamic functional connectivity between frontoparietal and default networks relates to cognitive flexibility. Neuroscience 339:12–21. doi:10.1016/j.neuroscience.2016.09.034 pmid:27687802
    OpenUrlCrossRefPubMed
  23. ↵
    Ezekiel F, Bosma R, Morton JB (2013) Dimensional change card sort performance associated with age-related differences in functional connectivity of lateral prefrontal cortex. Dev Cogn Neurosci 5:40–50. doi:10.1016/j.dcn.2012.12.001 pmid:23328350
    OpenUrlCrossRefPubMed
  24. ↵
    Faghiri A, Stephen JM, Wang Y-P, Wilson TW, Calhoun VD (2017) Changing brain connectivity dynamics: from early childhood to adulthood. Hum Brain Mapp 39:1108–1117.
    OpenUrl
  25. ↵
    Fan Y, Nickerson LD, Li H, Ma Y, Lyu B, Miao X, Zhuo Y, Ge J, Zou Q, Gao JH (2015) Functional connectivity-based parcellation of the thalamus: an unsupervised clustering method and its validity investigation. Brain Connect 5:620–630. doi:10.1089/brain.2015.0338 pmid:26106821
    OpenUrlCrossRefPubMed
  26. ↵
    Fransson P, Aden U, Blennow M, Lagercrantz H (2011) The functional architecture of the infant brain as revealed by resting-state fMRI. Cereb Cortex 21:145–154. doi:10.1093/cercor/bhq071 pmid:20421249
    OpenUrlCrossRefPubMed
  27. ↵
    Genovese CR, Lazar NA, Nichols T (2002) Thresholding of statistical maps in functional neuroimaging using the false discovery rate. Neuroimage 15:870–878. doi:10.1006/nimg.2001.1037 pmid:11906227
    OpenUrlCrossRefPubMed
  28. ↵
    Goparaju B, Rana KD, Calabro FJ, Vaina LM (2014) A computational study of whole-brain connectivity in resting state and task fMRI. Med Sci Monit 20:1024–1042. doi:10.12659/MSM.891142
    OpenUrlCrossRef
  29. ↵
    Gratton C, Laumann TO, Gordon EM, Adeyemo B, Petersen SE (2016) Evidence for two independent factors that modify brain networks to meet task goals. Cell Rep 17:1276–1288. doi:10.1016/j.celrep.2016.10.002 pmid:27783943
    OpenUrlCrossRefPubMed
  30. ↵
    Grayson DS, Ray S, Carpenter S, Iyer S, Dias TGC, Stevens C, Nigg JT, Fair DA (2014) Structural and functional rich club organization of the brain in children and adults. PLoS One 9:e88297. doi:10.1371/journal.pone.0088297 pmid:24505468
    OpenUrlCrossRefPubMed
  31. ↵
    Gu S, Satterthwaite TD, Medaglia JD, Yang M, Gur RE, Gur RC, Bassett DS (2015) Emergence of system roles in normative neurodevelopment. Proc Natl Acad Sci USA 112:13681–13686. doi:10.1073/pnas.1502829112 pmid:26483477
    OpenUrlAbstract/FREE Full Text
  32. ↵
    Halassa MM, Kastner S (2017) Thalamic functions in distributed cognitive control. Nat Neurosci 20:1669–1679. doi:10.1038/s41593-017-0020-1 pmid:29184210
    OpenUrlCrossRefPubMed
  33. ↵
    Hearne LJ, Cocchi L, Zalesky A, Mattingley JB (2017) Reconfiguration of brain network architectures between resting state and complexity-dependent cognitive reasoning. J Neurosci 37:8399–8411.
    OpenUrlAbstract/FREE Full Text
  34. ↵
    Hwang K, Hallquist MN, Luna B (2013) The development of hub architecture in the human functional brain network. Cereb Cortex 23:2380–2393. doi:10.1093/cercor/bhs227 pmid:22875861
    OpenUrlCrossRefPubMed
  35. ↵
    Hwang K, Bertolero MA, Liu WB, Esposito M (2017) The human thalamus is an integrative hub for functional brain networks. J Neurosci 37:5594–5607 . doi:10.1523/JNEUROSCI.0067-17.2017 pmid:28450543
    OpenUrlAbstract/FREE Full Text
  36. ↵
    Jenkinson M, Bannister P, Brady M, Smith S (2002) Improved optimization for the robust and accurate linear registration and motion correction of brain images. Neuroimage 17:825–841. pmid:12377157
    OpenUrlCrossRefPubMed
  37. ↵
    Jenkinson M, Beckmann CF, Behrens TEJ, Woolrich MW, Smith SM (2012) FSL. Neuroimage 62:782–790. doi:10.1016/j.neuroimage.2011.09.015
    OpenUrlCrossRefPubMed
  38. ↵
    Kaufmann T, Alnæs D, Doan NT, Brandt CL, Andreassen OA, Westlye LT (2017a) Delayed stabilization and individualization in connectome development are related to psychiatric disorders. Nat Neurosci 20:513–515. doi:10.1038/nn.4511
    OpenUrlCrossRef
  39. ↵
    Kaufmann T, Alnæs D, Brandt CL, Doan NT, Kauppi K, Bettella F, Lagerberg TV, Berg AO, Djurovic S, Agartz I, Melle IS, Ueland T, Andreassen OA, Westlye LT (2017b) Task modulations and clinical manifestations in the brain functional connectome in 1615 fMRI datasets. Neuroimage 147:243–252. doi:10.1016/j.neuroimage.2016.11.073 pmid:27916665
    OpenUrlCrossRefPubMed
  40. ↵
    Kellermann T, Regenbogen C, De Vos M, Mößnang C, Finkelmeyer A, Habel U (2012) Effective connectivity of the human cerebellum during visual attention. J Neurosci 32:11453–11460 . doi:10.1523/JNEUROSCI.0678-12.2012 pmid:22895727
    OpenUrlAbstract/FREE Full Text
  41. ↵
    Kwon S, Watanabe M, Fischer E, Bartels A (2017) Attention reorganizes connectivity across networks in a frequency specific manner. Neuroimage 144:217–226. doi:10.1016/j.neuroimage.2016.10.014
    OpenUrlCrossRefPubMed
  42. ↵
    Lohmann G, Müller K, Bosch V, Mentzel H, Hessler S, Chen L, Zysset S, von Cramon DY (2001) LIPSIA - a new software system for the evaluation of functional magnetic resonance images of the human brain. Comput Med Imaging Graph 25(6):449–457. doi:10.1016/S0895-6111(01)00008-8
    OpenUrlCrossRefPubMed
  43. ↵
    Lohmann G, Margulies DS, Horstmann A, Pleger B, Lepsien J, Goldhahn D, et al. (2010) Eigenvector Centrality Mapping for Analyzing Connectivity Patterns in fMRI Data of the Human Brain. PLoS ONE 5(4):e10232. doi:10.1371/journal.pone.0010232
    OpenUrlCrossRefPubMed
  44. ↵
    Marek S, Hwang K, Foran W, Hallquist MN, Luna B (2015) The contribution of network organization and integration to the development of cognitive control. PLoS Biol 13:e1002328. doi:10.1371/journal.pbio.1002328 pmid:26713863
    OpenUrlCrossRefPubMed
  45. ↵
    Meier TB, Desphande AS, Vergun S, Nair VA, Song J, Biswal BB, Meyerand ME, Birn RM, Prabhakaran V (2012) Support vector machine classification and characterization of age-related reorganization of functional brain networks. Neuroimage 60:601–613. doi:10.1016/j.neuroimage.2011.12.052 pmid:22227886
    OpenUrlCrossRefPubMed
  46. ↵
    Mišić B, Sporns O (2016) From regions to connections and networks: new bridges between brain and behavior. Curr Opin Neurobiol 40:1–7. doi:10.1016/j.conb.2016.05.003 pmid:27209150
    OpenUrlCrossRefPubMed
  47. ↵
    Nickerson LD, Smith SM, Ongur D, Beckmann CF (2017) Using dual regression to investigate network shape and amplitude in functional connectivity analyses. Front Neurosci 11:115.
    OpenUrl
  48. ↵
    Paus T (2005) Mapping brain maturation and cognitive development during adolescence. Trends Cogn Sci 9:60–68. doi:10.1016/j.tics.2004.12.008 pmid:15668098
    OpenUrlCrossRefPubMed
  49. ↵
    Paus T, Keshavan M, Giedd JN (2008) Why do many psychiatric disorders emerge during adolescence? Nat Rev Neurosci 9:947–957 . doi:10.1038/nrn2513 pmid:19002191
    OpenUrlCrossRefPubMed
  50. ↵
    Petrican R, Taylor MJ, Grady CL (2017) Trajectories of brain system maturation from childhood to older adulthood: implications for lifespan cognitive functioning. Neuroimage 163:125–149. doi:10.1016/j.neuroimage.2017.09.025 pmid:28917697
    OpenUrlCrossRefPubMed
  51. ↵
    Pope AR, Lowe DG (1994) Vista: A Software enviroment for computer vision research. Experimental Environments for Computer Vision and Image Processing. pp. 281–289. doi:10.1142/9789812797827_0012
    OpenUrlCrossRef
  52. ↵
    Power JD, Fair DA, Schlaggar BL, Petersen SE (2010) The development of human functional brain networks. Neuron 67:735–748. doi:10.1016/j.neuron.2010.08.017 pmid:20826306
    OpenUrlCrossRefPubMed
  53. ↵
    Power JD, Barnes KA, Snyder AZ, Schlaggar BL, Petersen SE (2012) Spurious but systematic correlations in functional connectivity MRI networks arise from subject motion. Neuroimage 59:2142–2154. doi:10.1016/j.neuroimage.2011.10.018 pmid:22019881
    OpenUrlCrossRefPubMed
  54. ↵
    Pruim RHR, Mennes M, van Rooij D, Llera A, Buitelaar JK, Beckmann CF (2015) ICA-AROMA: a robust ICA-based strategy for removing motion artifacts from fMRI data. Neuroimage 112:267–277. doi:10.1016/j.neuroimage.2015.02.064 pmid:25770991
    OpenUrlCrossRefPubMed
  55. ↵
    Ryali S, Supekar K, Chen T, Kochalka J, Cai W, Nicholas J, Padmanabhan A, Menon V (2016) Temporal dynamics and developmental maturation of salience, default and central-executive network interactions revealed by variational Bayes hidden Markov Modeling. PLoS Comput Biol 12:e1005138. doi:10.1371/journal.pcbi.1005138 pmid:27959921
    OpenUrlCrossRefPubMed
  56. ↵
    Salimi-Khorshidi G, Douaud G, Beckmann CF, Glasser MF, Griffanti L, Smith SM (2014) Automatic denoising of functional MRI data: combining independent component analysis and hierarchical fusion of classifiers. Neuroimage 90:449–468. doi:10.1016/j.neuroimage.2013.11.046 pmid:24389422
    OpenUrlCrossRefPubMed
  57. ↵
    Sato JR, Salum GA, Gadelha A, Vieira G, Zugman A, Picon FA, Pan PM, Hoexter MQ, Anés M, Moura LM, Del’Aquilla MAG, Crossley N, Amaro E, McGuire P, Lacerda ALT, Rohde LA, Miguel EC, Jackowski AP, Bressan RA (2015a) Decreased centrality of subcortical regions during the transition to adolescence: a functional connectivity study. Neuroimage 104:44–51. doi:10.1016/j.neuroimage.2014.09.063
    OpenUrlCrossRef
  58. ↵
    Sato JR, Biazoli CE Jr., Salum GA, Gadelha A, Crossley N, Satterthwaite TD, Vieira G, Zugman A, Picon FA, Pan PM, Hoexter MQ, Anés M, Moura LM, Del'aquilla MA, Amaro E Jr., McGuire P, Lacerda AL, Rohde LA, Miguel EC, Jackowski AP, et al. (2015b) Temporal stability of network centrality in control and default mode networks: specific associations with externalizing psychopathology in children and adolescents. Hum Brain Mapp 36:4926–4937.
    OpenUrl
  59. ↵
    Satterthwaite TD, Wolf DH, Erus G, Ruparel K, Elliott MA, Gennatas ED, Hopson R, Jackson C, Prabhakaran K, Bilker WB, Calkins ME, Loughead J, Smith A, Roalf DR, Hakonarson H, Verma R, Davatzikos C, Gur RC, Gur RE (2013) Functional maturation of the executive system during adolescence. J Neurosci 33:16249–16261. doi:10.1523/JNEUROSCI.2345-13.2013 pmid:24107956
    OpenUrlAbstract/FREE Full Text
  60. ↵
    Satterthwaite TD, Elliott MA, Ruparel K, Loughead J, Prabhakaran K, Calkins ME, Hopson R, Jackson C, Keefe J, Riley M, Mentch FD, Sleiman P, Verma R, Davatzikos C, Hakonarson H, Gur RC, Gur RE (2014) Neuroimaging of the Philadelphia Neurodevelopmental Cohort. Neuroimage 86:544–553. doi:10.1016/j.neuroimage.2013.07.064
    OpenUrlCrossRefPubMed
  61. ↵
    Sheffield JM, Kandala S, Burgess GC, Harms MP, Barch DM (2016) Cingulo-opercular network efficiency mediates the association between psychotic-like experiences and cognitive ability in the general population. Biol Psychiatry Cogn Neurosci Neuroimaging 1:498–506. doi:10.1016/j.bpsc.2016.03.009
    OpenUrlCrossRef
  62. ↵
    Shine JM, Bissett PG, Bell PT, Koyejo O, Balsters JH, Gorgolewski KJ, Moodie CA, Poldrack RA (2016) The dynamics of functional brain networks: integrated network states during cognitive task performance. Neuron 92:544–554. doi:10.1016/j.neuron.2016.09.018 pmid:27693256
    OpenUrlCrossRefPubMed
  63. ↵
    Skåtun KC, Kaufmann T, Tønnesen S, Biele G, Melle I, Agartz I, Alnæs D, Andreassen OA, Westlye LT (2016) Global brain connectivity alterations in patients with schizophrenia and bipolar spectrum disorders. J Psychiatry Neurosci 41:331–341. doi:10.1503/jpn.150159 pmid:26854755
    OpenUrlCrossRefPubMed
  64. ↵
    Skåtun KC, Kaufmann T, Brandt CL, Doan NT, Alnæs D, Tønnesen S, Biele G, Vaskinn A, Melle I, Agartz I, Andreassen OA, Westlye LT (2018) Thalamo-cortical functional connectivity in schizophrenia and bipolar disorder. Brain Imaging Behav 12:640–652.
    OpenUrl
  65. ↵
    Smith SM, Brady JM (1997) SUSAN—A new approach to low level image processing. Int J Comput Vis 23:45–78. doi:10.1023/A:1007963824710
    OpenUrlCrossRef
  66. ↵
    Smith SM (2002) Fast robust automated brain extraction. Hum Brain Mapp 17(3):143–155. doi:10.1002/hbm.10062
    OpenUrlCrossRefPubMed
  67. Smith SM, Jenkinson M, Woolrich MW, Beckmann CF, Behrens TEJ, Johansen-Berg H, Bannister PR, De Luca M, Drobnjak I, Flitney DE, Niazy R, Saunders J, Vickers J, Zhang Y, De Stefano N, Brady JM, Matthews PM (2004) Advances in functional and structural MR image analysis and implementation as FSL. NeuroImage, 23(S1):208–219. doi:10.1016/j.neuroimage.2004.07.051
    OpenUrlCrossRefPubMed
  68. ↵
    Smith SM, Jenkinson M, Woolrich MW, Beckmann CF, Behrens TEJ, Johansen-Berg H, Bannister PR, De Luca M, Drobnjak I, Flitney DE, Niazy RK, Saunders J, Vickers J, Zhang Y, De Stefano N, Brady JM, Matthews PM (2004) Advances in functional and structural MR image analysis and implementation as FSL. Neuroimage 23 [Suppl 1]:S208–S219. doi:10.1016/j.neuroimage.2004.07.051
    OpenUrlCrossRefPubMed
  69. ↵
    Smith SM, Nichols TE (2009) Threshold-free cluster enhancement: addressing problems of smoothing, threshold dependence and localisation in cluster inference. Neuroimage 44:83–98. doi:10.1016/j.neuroimage.2008.03.061 pmid:18501637
    OpenUrlCrossRefPubMed
  70. ↵
    Smith SM, Fox PT, Miller KL, Glahn DC, Fox PM, Mackay CE, Filippini N, Watkins KE, Toro R, Laird AR, Beckmann CF (2009) Correspondence of the brain’s functional architecture during activation and rest. Proc Natl Acad Sci USA 106:13040–13045. doi:10.1073/pnas.0905267106 pmid:19620724
    OpenUrlAbstract/FREE Full Text
  71. ↵
    Smith SM, Miller KL, Salimi-Khorshidi G, Webster M, Beckmann CF, Nichols TE, Ramsey JD, Woolrich MW (2011) Network modelling methods for FMRI. Neuroimage 54:875–891. doi:10.1016/j.neuroimage.2010.08.063 pmid:20817103
    OpenUrlCrossRefPubMed
  72. ↵
    Spadone S, Della Penna S, Sestieri C, Betti V, Tosoni A, Perrucci MG, Romani GL, Corbetta M (2015) Dynamic reorganization of human resting-state networks during visuospatial attention. Proc Natl Acad Sci USA 112:8112–8117 . doi:10.1073/pnas.1415439112
    OpenUrlAbstract/FREE Full Text
  73. ↵
    Spear LP (2000) The adolescent brain and age-related behavioral manifestations. Neurosci Biobehav Rev 24:417–463. pmid:10817843
    OpenUrlCrossRefPubMed
  74. ↵
    Stanislaw H, Todorov N (1999) Calculation of signal detection theory measures. Behav Res Methods Instrum Comput 31:137–149. pmid:10495845
    OpenUrlCrossRefPubMed
  75. ↵
    Stanley ML, Simpson SL, Dagenbach D, Lyday RG, Burdette JH, Laurienti PJ (2015) Changes in brain network efficiency and working memory performance in aging. PLoS One 10:e0123950. doi:10.1371/journal.pone.0123950 pmid:25875001
    OpenUrlCrossRefPubMed
  76. ↵
    Tomasi D, Wang R, Wang GJ, Volkow ND (2014) Functional connectivity and brain activation: a synergistic approach. Cereb Cortex 24:2619–2629.
    OpenUrlCrossRefPubMed
  77. ↵
    Vatansever D, Menon DK, Manktelow AE, Sahakian BJ, Stamatakis EA (2015a) Default mode dynamics for global functional integration. J Neurosci 35:15254–15262 . doi:10.1523/JNEUROSCI.2135-15.2015 pmid:26586814
    OpenUrlAbstract/FREE Full Text
  78. ↵
    Vatansever D, Menon DK, Manktelow AE, Sahakian BJ, Stamatakis EA (2015b) Default mode network connectivity during task execution. Neuroimage 122:96–104. doi:10.1016/j.neuroimage.2015.07.053
    OpenUrlCrossRefPubMed
  79. ↵
    Wang HL, Rau CL, Li YM, Chen YP, Yu R (2015) Disrupted thalamic resting-state functional networks in schizophrenia. Front Behav Neurosci 9:45. doi:10.3389/fnbeh.2015.00045
    OpenUrlCrossRef
  80. ↵
    Warren DE, Power JD, Bruss J, Denburg NL, Waldron EJ, Sun H, Petersen SE, Tranel D (2014) Network measures predict neuropsychological outcome after brain injury. Proc Natl Acad Sci USA 111:14247–14252 . doi:10.1073/pnas.1322173111
    OpenUrlAbstract/FREE Full Text
  81. ↵
    Westlye LT, Walhovd KB, Dale AM, Bjornerud A, Due-Tonnessen P, Engvig A, Grydeland H, Tamnes CK, Ostby Y, Fjell AM (2010) Life-span changes of the human brain white matter: diffusion tensor imaging (DTI) and volumetry. Cerebral Cortex 20:2055–2068. doi:10.1093/cercor/bhp280
    OpenUrlCrossRefPubMed
  82. ↵
    Wickham H (2009) ggplot2: elegant graphics for data analysis. New York: Springer.
  83. ↵
    Winkler AM, Ridgway GR, Webster MA, Smith SM, Nichols TE (2014) Permutation inference for the general linear model. Neuroimage 92:381–397. doi:10.1016/j.neuroimage.2014.01.060 pmid:24530839
    OpenUrlCrossRefPubMed
  84. ↵
    Wu K, Taki Y, Sato K, Hashizume H, Sassa Y, Takeuchi H, Thyreau B, He Y, Evans AC, Li X, Kawashima R, Fukuda H (2013) Topological organization of functional brain networks in healthy children: differences in relation to age, sex, and intelligence. PLoS One 8:e55347. doi:10.1371/journal.pone.0055347 pmid:23390528
    OpenUrlCrossRefPubMed

Synthesis

Reviewing Editor: Cheryl Sisk, Michigan State University

Decisions are customarily a result of the Reviewing Editor and the peer reviewers coming together and discussing their recommendations until a consensus is reached. When revisions are invited, a fact-based synthesis statement explaining their decision and outlining what is needed to prepare a revision will be listed below. The following reviewer(s) agreed to reveal their identity: Kathryn Mills, Marie-Helene Grosbras.

Reviewers agree that your paper is well-written, methodologically sound, and provides new information on how brain regions change in centrality across adolescence, and how these changes relate to working memory performance. There are a few suggestions for clarification and revision. Please address these in a revised manuscript, which will be reviewed by me.

1. It is unclear why the authors had to resample the EC-maps back to 2mm to continue with the rest of the analysis.

2. The EC maps of three components were related to working memory task performance, yet it appears that one cingulo-opecular node is overshadowing the narrative of this manuscript. Could the authors unpack the cerebellum and bilateral thalamus findings a bit further?

3. Please provide more detailed figure descriptions, as some figures are difficult to understand without referring to the main text (e.g. figure 1 color bar needs labels; figure 3 needs clearer labeling).

4. Please consider uploading all statistical maps to NeuroVault for easier interpretability.

5. Will processing and/or analysis scripts be made available to facilitate reproducibility and replication efforts?

Author Response

Response to the Reviewers:

Dear Dr. Cheryl L Sisk

Thank you for the positive and constructive feedback, and for the opportunity to submit a revised version of our paper “Key brain network nodes show differential cognitive relevance and developmental trajectories during childhood and adolescence” for consideration in eNeuro.

Below we address the comments: -It is unclear why the authors had to resample the EC-maps back to 2mm to continue with the rest of the analysis.

Response: The filtered and denoised fMRI datasets were resampled to 3 mm space due to the high computational demands of the voxelwise EC estimation. The main reason for the subsequent resampling of the EC maps from 3 mm to 2 mm isotropic space after EC estimation was convenience. The initial fMRI preprocessing and registration to MNI space included a sampling of the raw data to 2 mm MNI space. The common mask used during EC estimation is based on the individual normalized masks in 2 mm space, and the MNI 2 mm brain template was used as background for visualization and anatomical interpretation of the group ICA maps. A possible concern regarding resampling of the ECM maps to a higher resolution before further analysis is that the interpolation may influence the degrees of freedom and smoothness of the maps. Importantly, both ICA estimation on the EC maps, as well as the TFCE performed for the full brain voxel-vise analysis adapts to the smoothness of the images and it is highly unlikely likely that the resampling have influenced or biased the results.

The EC maps of three components were related to working memory task performance, yet it appears that one cingulo-opecular node is overshadowing the narrative of this manuscript. Could the authors unpack the cerebellum and bilateral thalamus findings a bit further?

Response: We thank the reviewer for these thoughtful comments, and the opportunity to expand the discussion regarding our results. To clarify our findings, we have now revised a section of the discussion, which now reads:

p. 14, line 326-328: “The most prominent finding in the current study was increased centrality of frontoparietal, cerebellar and cingulo-opercular components, and decreased centrality in sensorimotor and thalamic components”

p14, line 340-342: “Indeed, within-network visual and sensorimotor connectivity have been reported to decrease with task demand, with simultaneous increases in connectivity with frontoparietal and cerebellar nodes.”

p. 14 -- 15, line 344 -- 363: “Thalamus plays a key role in the gating of sensory input towards higher cortical network structures (Halassa and Kastner, 2017; Hwang et al., 2017). Interestingly, reduced connectivity between specific sub-clusters of the thalamus and visual and motor cortices in response to task demands has been reported, also in absence of altered FC with executive or DMN networks (Fan et al., 2015). In light of these observations, our findings indicate that task engagement reduces thalamic FC with cortical areas, facilitating the suppression and filtering of sensory signal during task engagement.

2

Our results align with previous findings highlighting the importance of increased influence of executive and cerebellar nodes during task engagement, as higher cingulo-opercular, cerebellar and frontoparietal centrality was associated with better task performance, and higher centrality in visual and sensorimotor nodes was associated with lower performance. Thalamus in particular was further associated with decrease in centrality during task engagement reflecting a drop in global FC, and the degree of differentiation between task and rest EC was positively associated with performance. Indeed, our results support both the interference-hypothesis (D‘Esposito et al., 1999), suggesting that performance during the n-back task is supported by increased influence from frontoparietal and cingulo-opercular nodes, providing top-down attentional control, as well as the sensory gating hypothesis (Cromwell et al., 2008), reflected through the decreased thalamic EC, which was associated with better performance.”

p. 18, line 444-447: “Indeed, aberrant thalamo-cortical connectivity in adults have been linked to mental disorders (Wang et al., 2015; Skatun et al., 2017), where the suggested mechanisms include altered inhibition of sensory signaling.”

Please provide more detailed figure descriptions, as some figures are difficult to understand without referring to the main text (e.g. figure 1 color bar needs labels; figure 3 needs clearer labeling).

Response: We apologize for the poor labeling and legends in the initial version of the manuscript. Please see the revised version of the manuscript for improved figure layout and legends.

Please consider uploading all statistical maps to NeuroVault for easier interpretability.

Response: We thank the reviewer for this suggestion. We have now uploaded the ICA decomposition of the ECM maps estimated on resting state and n-back data, as well as t-maps from randomise for task effects on ECM maps to NeuroVault, under the collection-name ICA-ECM in the PNC sample: https://neurovault.org/collections/ACBWDVSP/

Will processing and/or analysis scripts be made available to facilitate reproducibility and replication efforts?

fMRI analyses and ECM estimation was done using freely available tools (FSL and Lipsia). For subsequent statistical analysis we wrote scripts in Matlab R2014a (The MathWorks Inc., Natick, USA). All code is available from the authors upon request, and we are looking into ways to share the scripts online.

Back to top

In this issue

eneuro: 5 (4)
eNeuro
Vol. 5, Issue 4
July/August 2018
  • Table of Contents
  • Index by author
Email

Thank you for sharing this eNeuro article.

NOTE: We request your email address only to inform the recipient that it was you who recommended this article, and that it is not junk mail. We do not retain these email addresses.

Enter multiple addresses on separate lines or separate them with commas.
Key Brain Network Nodes Show Differential Cognitive Relevance and Developmental Trajectories during Childhood and Adolescence
(Your Name) has forwarded a page to you from eNeuro
(Your Name) thought you would be interested in this article in eNeuro.
CAPTCHA
This question is for testing whether or not you are a human visitor and to prevent automated spam submissions.
Print
View Full Page PDF
Citation Tools
Key Brain Network Nodes Show Differential Cognitive Relevance and Developmental Trajectories during Childhood and Adolescence
Knut K. Kolskår, Dag Alnæs, Tobias Kaufmann, Geneviève Richard, Anne-Marthe Sanders, Kristine M. Ulrichsen, Torgeir Moberget, Ole A. Andreassen, Jan E. Nordvik, Lars T. Westlye
eNeuro 2 July 2018, 5 (4) ENEURO.0092-18.2018; DOI: 10.1523/ENEURO.0092-18.2018

Citation Manager Formats

  • BibTeX
  • Bookends
  • EasyBib
  • EndNote (tagged)
  • EndNote 8 (xml)
  • Medlars
  • Mendeley
  • Papers
  • RefWorks Tagged
  • Ref Manager
  • RIS
  • Zotero
Respond to this article
Share
Key Brain Network Nodes Show Differential Cognitive Relevance and Developmental Trajectories during Childhood and Adolescence
Knut K. Kolskår, Dag Alnæs, Tobias Kaufmann, Geneviève Richard, Anne-Marthe Sanders, Kristine M. Ulrichsen, Torgeir Moberget, Ole A. Andreassen, Jan E. Nordvik, Lars T. Westlye
eNeuro 2 July 2018, 5 (4) ENEURO.0092-18.2018; DOI: 10.1523/ENEURO.0092-18.2018
Reddit logo Twitter logo Facebook logo Mendeley logo
  • Tweet Widget
  • Facebook Like
  • Google Plus One

Jump to section

  • Article
    • Abstract
    • Significance Statement
    • Introduction
    • Materials and Methods
    • Results
    • Discussion
    • Footnotes
    • References
    • Synthesis
    • Author Response
  • Figures & Data
  • Info & Metrics
  • eLetters
  • PDF

Keywords

  • adolescence
  • development
  • Eigenvector centrality
  • fMRI
  • graph theory
  • independent component analysis

Responses to this article

Respond to this article

Jump to comment:

No eLetters have been published for this article.

Related Articles

Cited By...

More in this TOC Section

New Research

  • Deciding while acting - Mid-movement decisions are more strongly affected by action probability than reward amount
  • CaMKIIα promoter-controlled circuit manipulations target both pyramidal cells and inhibitory interneurons in cortical networks
  • Gas7 is a novel dendritic spine initiation factor
Show more New Research

Development

  • Heterozygous Dab1 null mutation disrupts neocortical and hippocampal development
  • The Mobility of Neurofilaments in Mature Myelinated Axons of Adult Mice
  • Development of the Functional Connectome Topology in Adolescence: Evidence from Topological Data Analysis
Show more Development

Subjects

  • Development

  • Home
  • Alerts
  • Visit Society for Neuroscience on Facebook
  • Follow Society for Neuroscience on Twitter
  • Follow Society for Neuroscience on LinkedIn
  • Visit Society for Neuroscience on Youtube
  • Follow our RSS feeds

Content

  • Early Release
  • Current Issue
  • Latest Articles
  • Issue Archive
  • Blog
  • Browse by Topic

Information

  • For Authors
  • For the Media

About

  • About the Journal
  • Editorial Board
  • Privacy Policy
  • Contact
  • Feedback
(eNeuro logo)
(SfN logo)

Copyright © 2023 by the Society for Neuroscience.
eNeuro eISSN: 2373-2822

The ideas and opinions expressed in eNeuro do not necessarily reflect those of SfN or the eNeuro Editorial Board. Publication of an advertisement or other product mention in eNeuro should not be construed as an endorsement of the manufacturer’s claims. SfN does not assume any responsibility for any injury and/or damage to persons or property arising from or related to any use of any material contained in eNeuro.