

Article Figures & Data
Figures
- Figure 1.
Tsc2 deletion in Nav1.8-positive neurons activates mTORC1 signaling and increases soma size. A, Western blotting of L4 DRG from adult Nav-Tsc2 mice showed decreased expression of Tsc2 and increased phosphorylation of the direct mTORC1 target S6 kinase T389 relative to control mice; N = 8–10. B, C, TMP histochemistry of adult control and Nav-Tsc2 L4 DRG. Scale bar: 50 µm; N = 6. D, E, Immunohistochemistry of adult control and Nav-Tsc2 L4 DRG for CGRP and NF200. Arrows point to CGRP-positive, NF200-negative neurons; N = 5. F, Average cell area of labeled neurons. Individual animals plotted with mean ± SEM; N.S, p > 0.05, ****p < 0.0001.
- Figure 2.
C-fiber axon diameter is increased in Nav-Tsc2 mice. A, Transmission electron micrographs of representative transverse sections of sciatic nerve of P29 (N = 5) and adult (N = 6) mice. Arrows point to axons greater than one micron in diameter. Scale bar: 1 µm. B, Average diameter of axons bundled by Remak Schwann cells. C, Percentages of axons bundled by Remak Schwann cells that have diameter greater that one micron. D, Average number of axons within individual Remak bundles. Individual animals plotted with mean ± SEM; *p < 0.05, **p < 0.01.
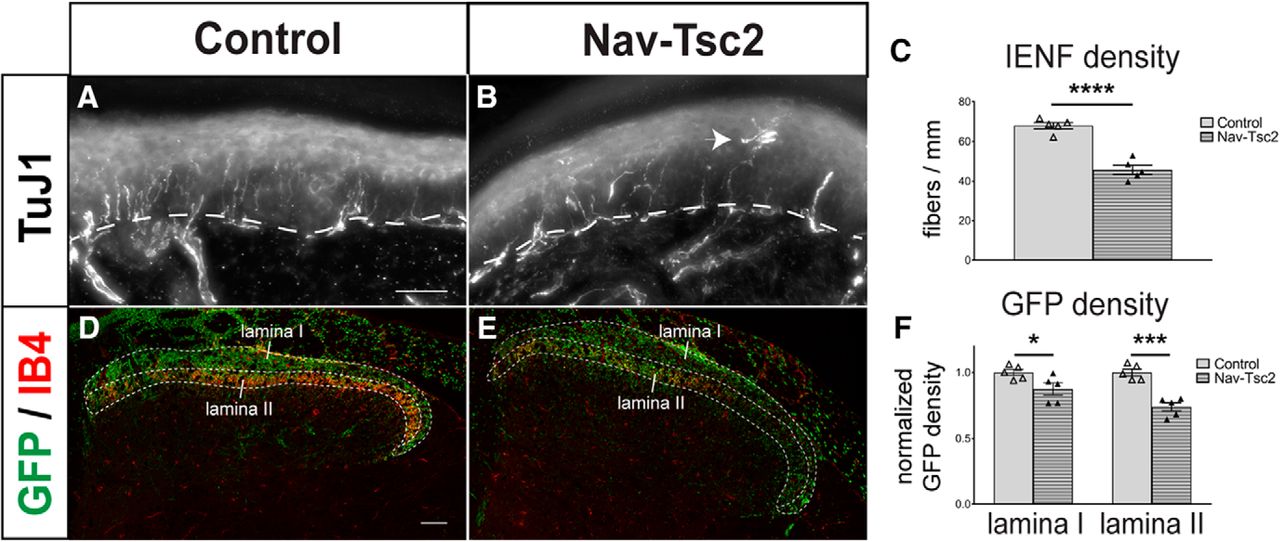
- Figure 3.
Fiber innervation is reduced in both central and peripheral targets of DRG neurons in Nav-Tsc2 mice. A, B, Projection of a z-stack of hindpaw glabrous skin labeled with TuJ1. Arrowhead shows aberrant fiber morphology in Nav-Tsc2 mice. Dotted line denotes epidermal-dermal border. Scale bar: 50 µm. C, Number of TuJ1-positive fibers crossing the epidermal-dermal border were counted in control and Nav-Tsc2 mice; N = 5. D, E, Confocal micrographs of Rosa-GFP reporter in control and Nav-Tsc2 lumbar spinal cord transverse sections labeled with IB4. Laminas I and II used for quantification are outlined. Scale bar: 50 µm. F, Normalized area fraction of GFP signal in Laminas I and II; N = 5. Individual animals plotted with mean ± SEM; *p < 0.05, ***p < 0.001, ****p < 0.0001.
- Figure 4.
Laminar targeting of peptidergic and nonpeptidergic fibers is normal in dorsal horn of Nav-Tsc2 mice. A–F, Control and Nav-Tsc2 lumbar spinal cord transverse sections labeled with CGRP (A, B) or IB4 (C, D) as well as merged images (E, F). Note ectopic binding of IB4 in dorsal white matter of Nav-Tsc2 mice (D, F). Arrows show deep lamina innervation by CGRP. Scale bar: 500 µm; N = 7. G, H, TMP histochemistry of control and Nav-Tsc2 lumbar spinal cord transverse sections. Scale bar: 500 µm; N = 11. I–K, High-magnification confocal micrographs of lumbar spinal cord transverse sections from Nav-Tsc2; Rosa-GFP mice imaged for GFP fluorescence and IB4 labeling. Note lack of colocalization in the dorsal column (DC) white matter compared to dorsal horn (DH) gray matter. Scale bar: 50 µm; N = 5.
- Figure 5.
Peptidergic nociceptor markers are reduced in DRG from Nav-Tsc2 mice. Immunohistochemisty of adult L4 DRG transverse sections stained for SP and TuJ1 (A, B) or NF200 and CGRP (D, E), NF200 and TrkA (G, H), or NF200 and IB4 (J, K). Scale bar: 100 µm. Arrows point to neurons that colabeled with NF200. C, F, G, L, Total number of L4 DRG neurons labeling with markers as indicated. Individual animals plotted with mean ± SEM; N = 4-6; N.S. p > 0.05, **p < 0.01, ***p < 0.001, ****p < 0.0001.
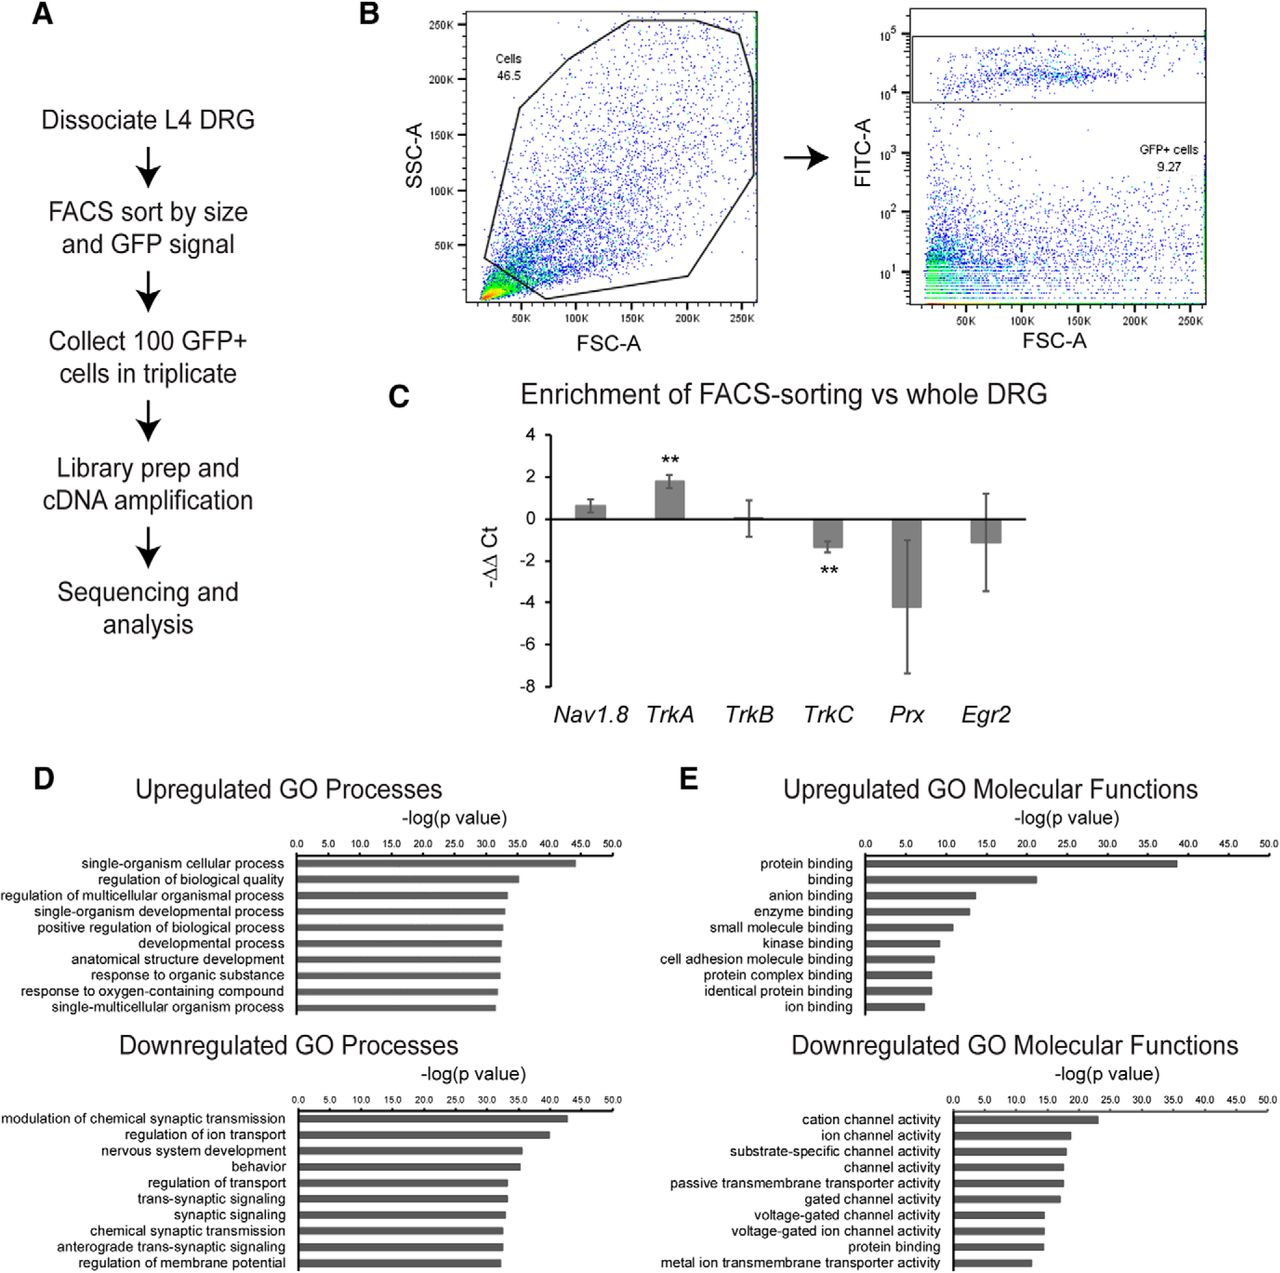
- Figure 6.
Transcriptional profiling of nociceptors reveals reduction of ion channel expression in Nav-Tsc2 DRG. A, Experimental design for transcriptional profiling. B, After gating by forward and side scatter, FITC-positive events were purified. C, qPCR comparison of normalized neuronal and glial markers from FACS-sorted cells relative to whole DRG. D, E, Top 10 GO processes (D) and molecular functions (E) by statistical significance that were upregulated and downregulated in Nav-Tsc2 DRG as determined by p value; **p < 0.01.
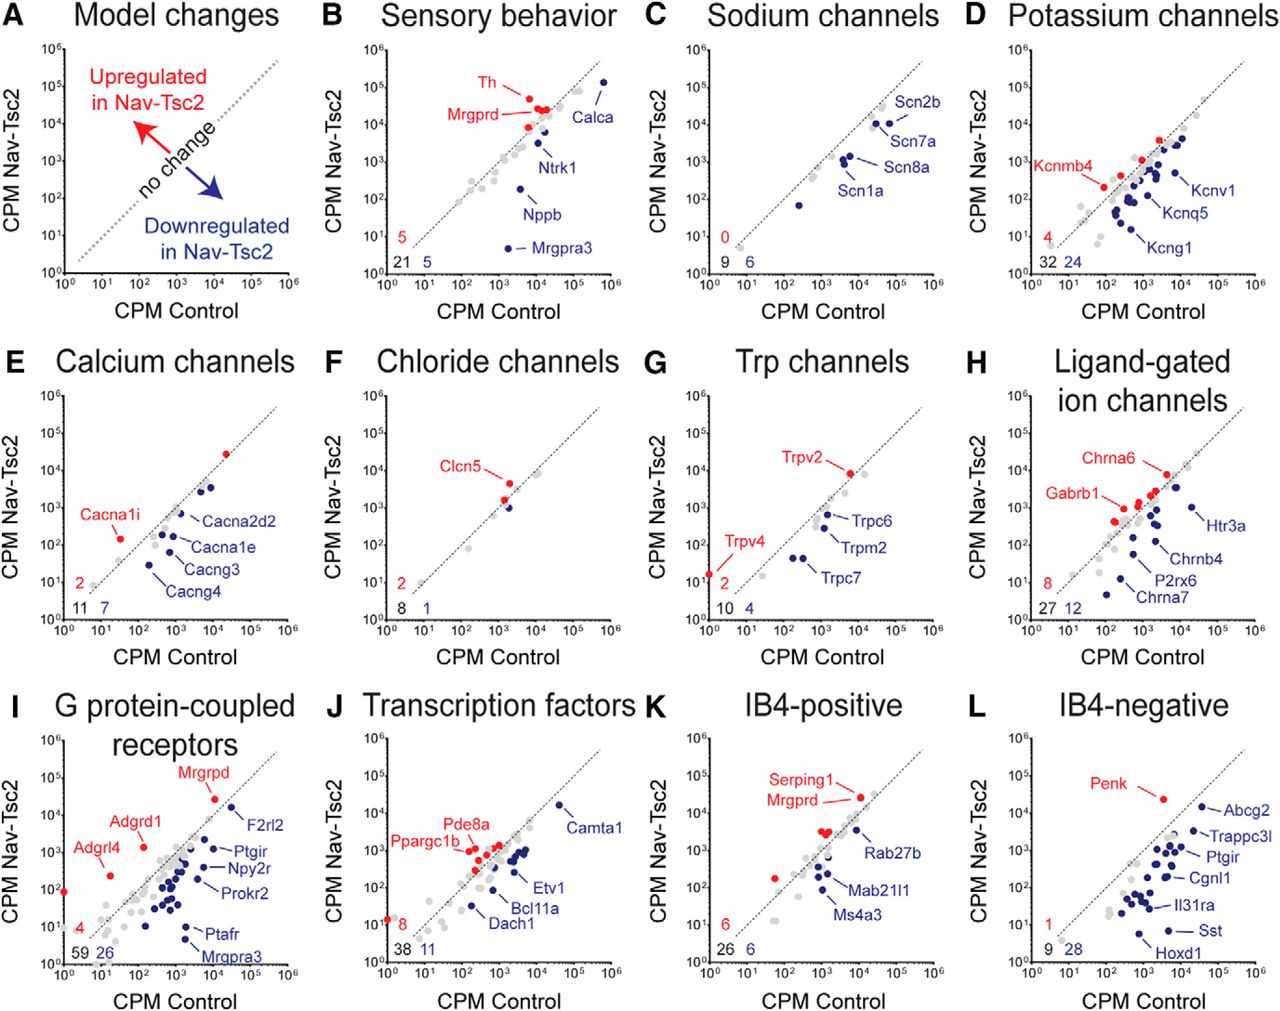
- Figure 7.
Tsc2 is required for full expression of ion channels and markers of IB4-negative DRG neurons. A, Model of expression changes in Nav-Tsc2 mice. B–L, Scatterplots of normalized counts in control and Nav-Tsc2 mice for candidate genes involved in sensory behavior (B), ion channels (C–H), G protein-coupled receptors (I), transcription factors (J), and the most enriched genes in IB4-positive (K) and IB4-negative (L) neurons expressing Nav1.8-Cre (Chiu et al., 2014). Red and blue points denote upregulated and downregulated genes, respectively, in Nav-Tsc2 DRG compared to control (adjusted p < 0.05, log2 fold change >0.5 or <-0.5). Gray points denote no change in expression. Gene lists and values can be found in Extended Data Figure 7-1. Select genes that were highly differentially expressed in each category are highlighted. Numbers in bottom left corner of panels denote number of upregulated (red), downregulated (blue), and unchanged (black) genes analyzed. Dotted line is representative plot of y = x for reference purposes only.
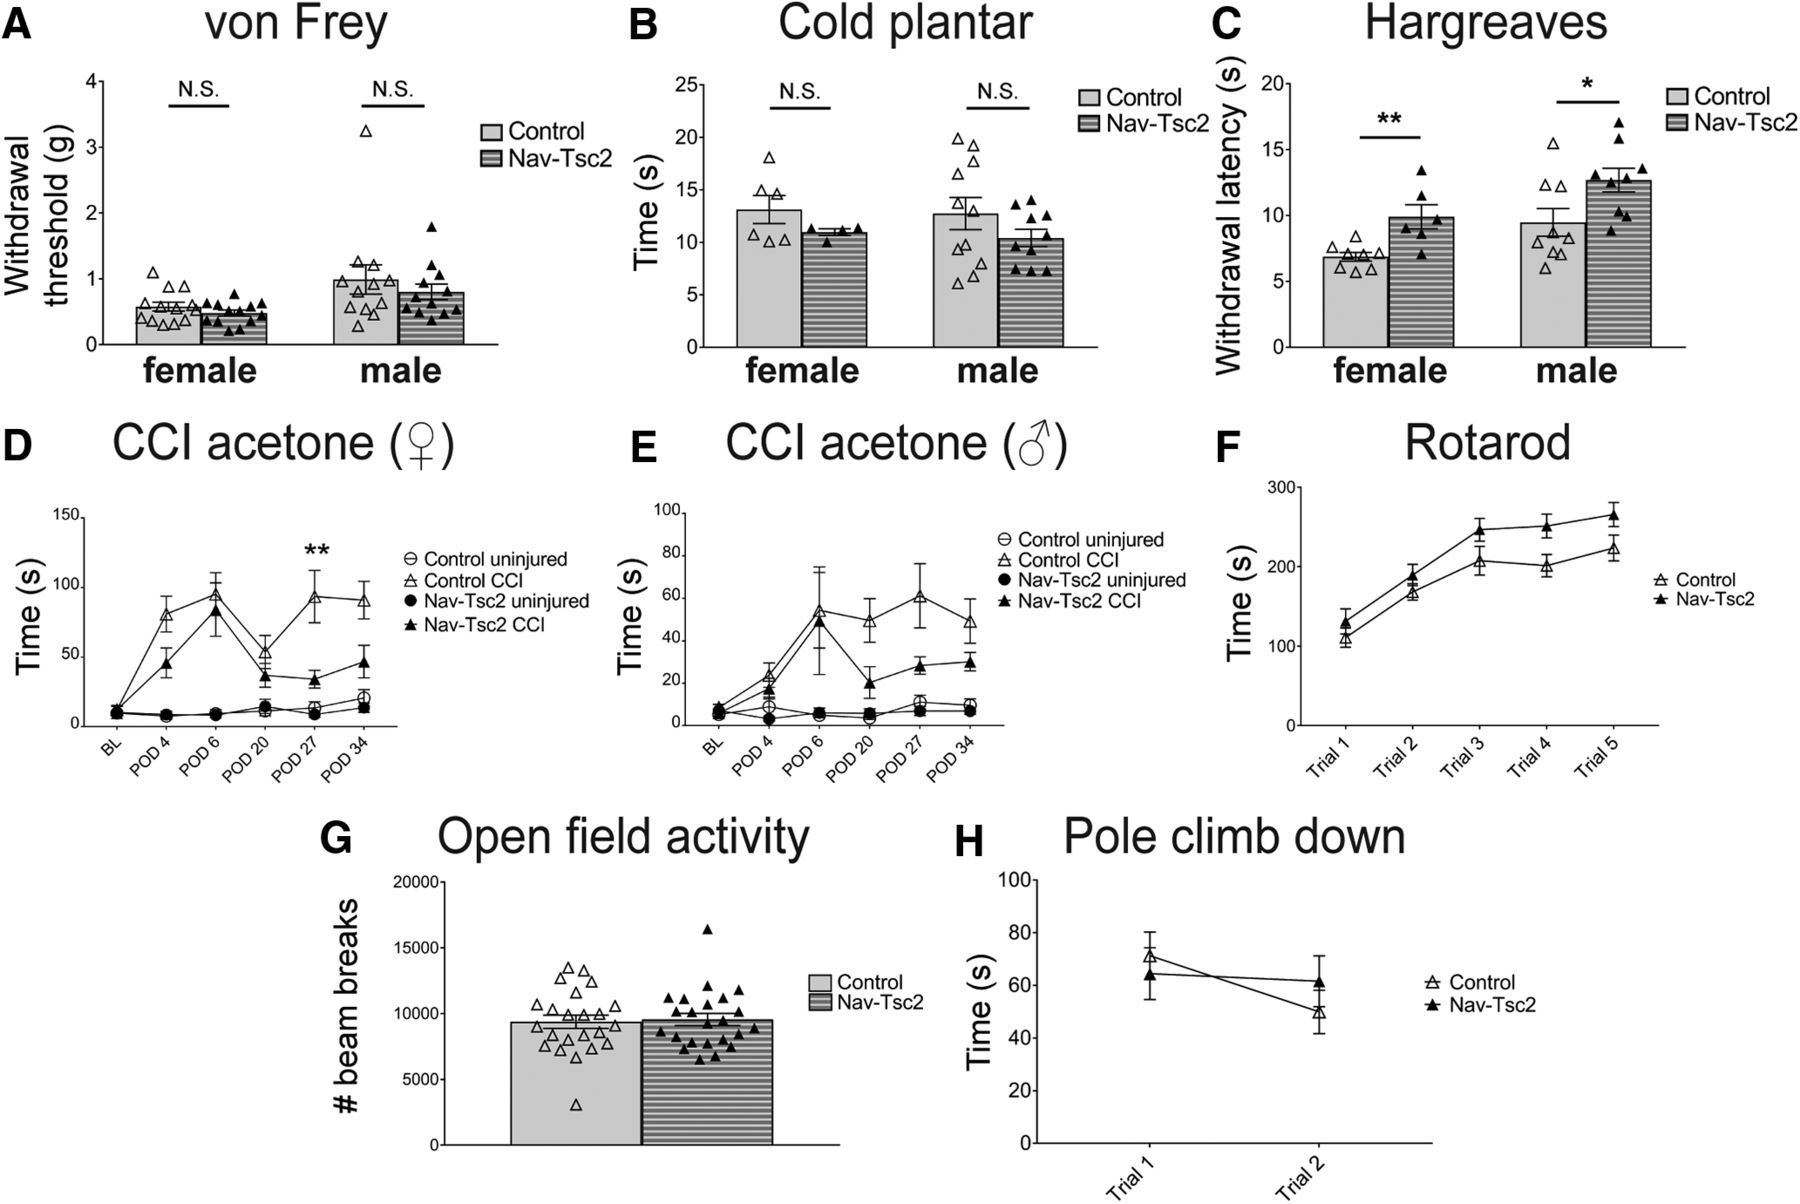
- Figure 8.
Nav-Tsc2 mice shows normal responses to mechanical and cold stimuli but have decreased heat sensitivity and injury-induced cold hypersensitivity. A–C, Sensory behavior analysis of control and Nav-Tsc2 mice. A, Withdrawal threshold for control and Nav-Tsc2 male and female mice using von Frey test; N = 12–13. B, Latency to paw withdrawal from cold stimulus; N = 4–11. C, Latency to paw withdrawal in Hargreaves test. Individual animals plotted with mean ± SEM; N = 9–13. D, E, Time spent in spontaneous pain behavior as a result of acetone application to paw of uninjured (circles) or injured (triangles) hindpaw at baseline and indicated time after CCI for female (D) and male (E) Nav-Tsc2 mice (closed shapes) and their control littermates (open shapes). Plotted as mean ± SEM; N = 8–11. BL, baseline. POD, post-operative day. F–H, Sensorimotor battery showed no difference between control and Nav-Tsc2 mice. F, Time to fall off an accelerating Rotarod was measured for Nav-Tsc2 mice (closed) and their control littermates (open). Data are graphed for each of five trials; N = 17. G, Open field locomotor behavior was assessed over 1 h in Nav-Tsc2 mice and their control littermates with individual data points plotted; N = 23. H, Time required to climb down a pole was measured for Nav-Tsc2 mice (closed) and their control littermates (open). Data graphed for each of two trials; N = 22. Data in G, H shown as mean ± SEM; N.S. p > 0.05, *p < 0.05, **p < 0.01.


Tables
Gene name Forward primer (5'-3') Reverse primer (5'-3') Ntrk1 / TrkA GCCTAACCATCGTGAAGAGTG CCAACGCATTGGAGGACAGAT Scn10a / Nav1.8 TCCGTGGGAACTACCAACTTC GCTCGCCATAGAACCTGGG Ntrk2 / TrkB CTGGGGCTTATGCCTGCTG AGGCTCAGTACACCAAATCCTA Ntrk3 / TrkC CCGCATCCCAGTCATTGAGAA TGACCTTGGGTAAGACACATCC Periaxin CTCAGCTTGCAAGAAGGGGA CGTACCAGCTTGGCCACTTT Egr2 / Krox20 GGCTCAGTTCAACCCCTCTC GCGCAAAAGTCCTGTGTGTT Figure Statistical test N Statistical significance 1E Unpaired t test, two-tailed TMPase: N = 6 TMPase: p < 0.0001 Cell area CGRP: N = 5 CGRP+,NF200-: p < 0.0001 CGRP+,NF200+: p = 0.4803 Table 3 Unpaired t test, two-tailed N = 5–6 See Table 3 Cell distribution 2B Unpaired t test, two-tailed Adult: N = 6 Adult control vs adult Nav-Tsc2: p = 0.0047 Axon diameter P29: N = 5 P29 control vs P29 Nav-Tsc2: p = 0.0442 Adult control vs P29 control: p = 0.318 Adult Nav-Tsc2 vs P29 Nav-Tsc2: p = 0.0258 2C Unpaired t test, two-tailed Adult: N = 6 Adult control vs adult Nav-Tsc2: p = 0.0055 Axons >1 micron P29: N = 5 P29 control vs P29 Nav-Tsc2: p = 0.2076 Adult control vs P29 control: p = 0.4211 Adult Nav-Tsc2 vs P29 Nav-Tsc2: p = 0.0125 2D Unpaired t test, two-tailed Adult: N = 6 Adult control vs adult Nav-Tsc2: p = 0.0371 Axons/bundle P29: N = 5 P29 control vs P29 Nav-Tsc2: p = 0.0747 Adult control vs P29 control: p = 0.5018 Adult Nav-Tsc2 vs P29 Nav-Tsc2: p = 0.0202 3C Unpaired t test, two-tailed N = 5 TuJ1: p < 0.0001 Skin innervation 3F Unpaired t test, two-tailed N = 5 Lamina I: p = 0.0403 GFP density Lamina II: p = 0.0002 5C,F,G,L Unpaired t test, two-tailed N = 5 Total neurons: p = 0.081 DRG neuron SP: N = 6 NF200 total: p = 0.314 counting SP total: p = 0.0006 CGRP+,NF200-: p < 0.0001 CGRP+,NF200+: p = 0.0007 TrkA+,NF200-: p < 0.0001 TrkA+,NF200+: p = 0.0005 IB4 total: p = 0.0001 IB4+,NF200+: p = 0.0037 6C Unpaired t test, two-tailed N = 4 whole DRG Nav1.8: p = 0.0613 qPCR of N = 3 FACS-sorted samples TrkA: p = 0.0015 FACS-sorting TrkB: p = 0.9758 TrkC: p = 0.0020 Prx: p = 0.1784 Egr2: p = 0.5834 8A Unpaired t test, two-tailed Female: N = 13 Female: p = 0.2513 von Frey Male: N = 12 Male: p = 0.462 8B Unpaired t test, two-tailed Female: N = 6 control, N = 4 cKO Female: p = 0.2390 Cold plantar male: N = 11 control, N = 10 cKO Male: p = 0.2102 8C Unpaired t test, two-tailed Female: N = 13 Female: p = 0.0046 Hargreaves Male: N = 9 Male: p = 0.0337 8D Two-way RM ANOVA Control: N = 9 Interaction: F(5,75) = 1.82; p = 0.1191 Female CCI Nav-Tsc2: N = 8 Time: F(5,75) = 10.04; p < 0.0001 Genotype: F(1,15) = 9.032; p = 0.0089 8D Sidak’s multiple Control: N = 9 BL: adjusted p > 0.9999 Female CCI comparison test Nav-Tsc2: N = 8 POD 4: adjusted p = 0.269 POD 6: adjusted p = 0.9896 POD 20: adjusted p = 0.9209 POD 27: adjusted p = 0.0071 POD 34: adjusted p = 0.0836 8E Two-way RM ANOVA Control: N = 11 Interaction: F(5,75) = 0.7719; p = 0.5723 Male CCI Nav-Tsc2: N = 10 Time: F(5,95) = 4.873; p = 0.0005 Genotype: F(1,19) = 3.403; p = 0.0807 8E Sidak’s multiple Control: N = 11 BL: adjusted p > 0.9999 Male CCI comparison test Nav-Tsc2: N = 10 POD 4: adjusted p = 0.9992 POD 6: adjusted p = 0.9998 POD 20: adjusted p = 0.3652 POD 27: adjusted p = 0.236 POD 34: adjusted p = 0.8045 8F Two-way RM ANOVA Control: N = 17 Interaction: F(4,128) = 1.03; p = 0.3946 Rotarod Nav-Tsc2: N = 17 Trial number: F(4,128) = 60.26; p < 0.0001 Genotype: F(1,32) = 4.08; p = 0.0518 8F Sidak’s multiple Control: N = 17 Trial 1: adjusted p = 0.8576 Rotarod comparison test Nav-Tsc2: N = 17 Trial 2: adjusted p = 0.8396 Trial 3: adjusted p = 0.2686 Trial 4: adjusted p = 0.0812 Trial 5: adjusted p = 0.1971 8G Unpaired t test, two-tailed Control: N = 23 p = 0.8027 Open field activity Nav-Tsc2: N = 23 8H Two-way RM ANOVA Control: N = 23 Interaction: F(1,43) = 2.62; p = 0.1129 Pole climb down Nav-Tsc2: N = 22 Trial number: F(1,43) = 4.516; p = 0.0394 Genotype: F(1,43) = 0.04254; p = 0.8376 8H Sidak’s multiple Control: N = 23 Trial 1: adjusted p = 0.84 Pole climb down comparison test Nav-Tsc2: N = 22 Trial 2: adjusted p = 0.606 - Table 3.
Percentage of small, medium, and large diameter neurons labeled with cell type-specific markers
Small Medium Large TMPase Control 67 ± 1.98% 33 ± 1.98% 0 ± 0% Nav-Tsc2 20.83 ± 1.68% 73.83 ± 1.66% 5.33 ± 1.31% p value (N) <0.0001 (6) <0.0001 (6) 0.0712 (6) CGRP+, NF200- Control 41 ± 4.63% 58.4 ± 4.5% 0.6 ± 0.4% Nav-Tsc2 4.2 ± 1.88% 77.8 ± 0.97% 18 ± 2.35% p value (N) <0.0001 (5) 0.0003 (5) 0.001 (5) CGRP+, NF200+ Control 4.4 ± 0.75% 46.8 ± 6.28% 48.8 ± 6.22% Nav-Tsc2 2 ± 1.1% 50.8 ± 3.83% 47.2 ± 4.59% p value (N) 0.9736 (5) 0.893 (5) 0.9918 (5) Data are presented as mean percentage ± SEM for control and Nav-Tsc2 mice with corresponding p value and N. Small, medium, and large diameter categorized defined in Materials and Methods.
Extended Data Figure 7-1
RNA-seq analysis of FACS-sorted neurons from control; Rosa-GFP and Nav-Tsc2; Rosa-GFP summarized in Figure 7. Red and blue text denotes upregulated and downregulated genes, respectively, in Nav-Tsc2 DRG compared to control (adjusted p < 0.05, log2 fold change >0.5 or <-0.5). Black text denotes no change in expression; padj denotes adjusted p value. Download Figure 7-1, DOCX file.
In this issue


