

Article Figures & Data
Figures
- Figure 1.
Locomotor activity rhythms were improved by the TRF regimen. A, Examples of cage activity rhythms recorded from Q175 mutants under control (left) and TRF (right) conditions. The activity levels in the actograms were normalized to the same scale (85% of the maximum of the most active individual). Each row represents two consecutive days, and the second day is repeated at the beginning of the next row. The orange bar on the top of actograms indicates the time when food hopper is opened. B, The strength of the activity rhythm is indicated by the power (%V) of the χ2 periodogram analysis. C, The averaged level of cage activity. D, The averaged variation in onset from the best-fit regression line. E, Average waveforms from 10 d of cage activity (1-h window) are shown and SEs across animals are indicated. F, The number of activity bouts (separated by a gap of 21 mins or more) during rest phase (ZT 0-12), active phase (ZT 12-24), and 24 h are reported as the level of fragmentation of the circadian activity cycle. Black bars represent Q175 mutants under ad lib condition, and orange bars represent Q175 mutants under timed feeding condition. G, The average length of activity bouts during their active phase. The white/black bar on the top of actograms (A) and waveforms (E) indicates the 12/12 h LD cycle. The temporal activity wave form was analyzed using a two-way RM ANOVA with time and treatment as factors. Other comparisons between Q175 cohorts were made using a t test. Asterisks represent significant differences due to TRF regimen compared to ad lib controls (p < 0.05); n = 8/group.
- Figure 2.
TRF prevented disease-caused awakening time without altering the amount of sleep behavior. Video recording in combination with automated mouse tracking analysis software was used to measure immobility-defined sleep. A, Running averages (1-h window) of immobility-defined sleep in Q175 mutants with ad lib (black) and timed feeding (orange) are plotted. The white/black bar on the top of wave form indicates the 12/12 h LD cycle. B–F, Quantification of the immobility-defined sleep rhythms. The temporal sleep wave form was analyzed using a two-way RM ANOVA with time and treatment as factors. Other comparisons between Q175 cohorts were made using a t test. Asterisks represent significant differences due to TRF regimen compared to ad lib controls (p < 0.05); n = 8/group.
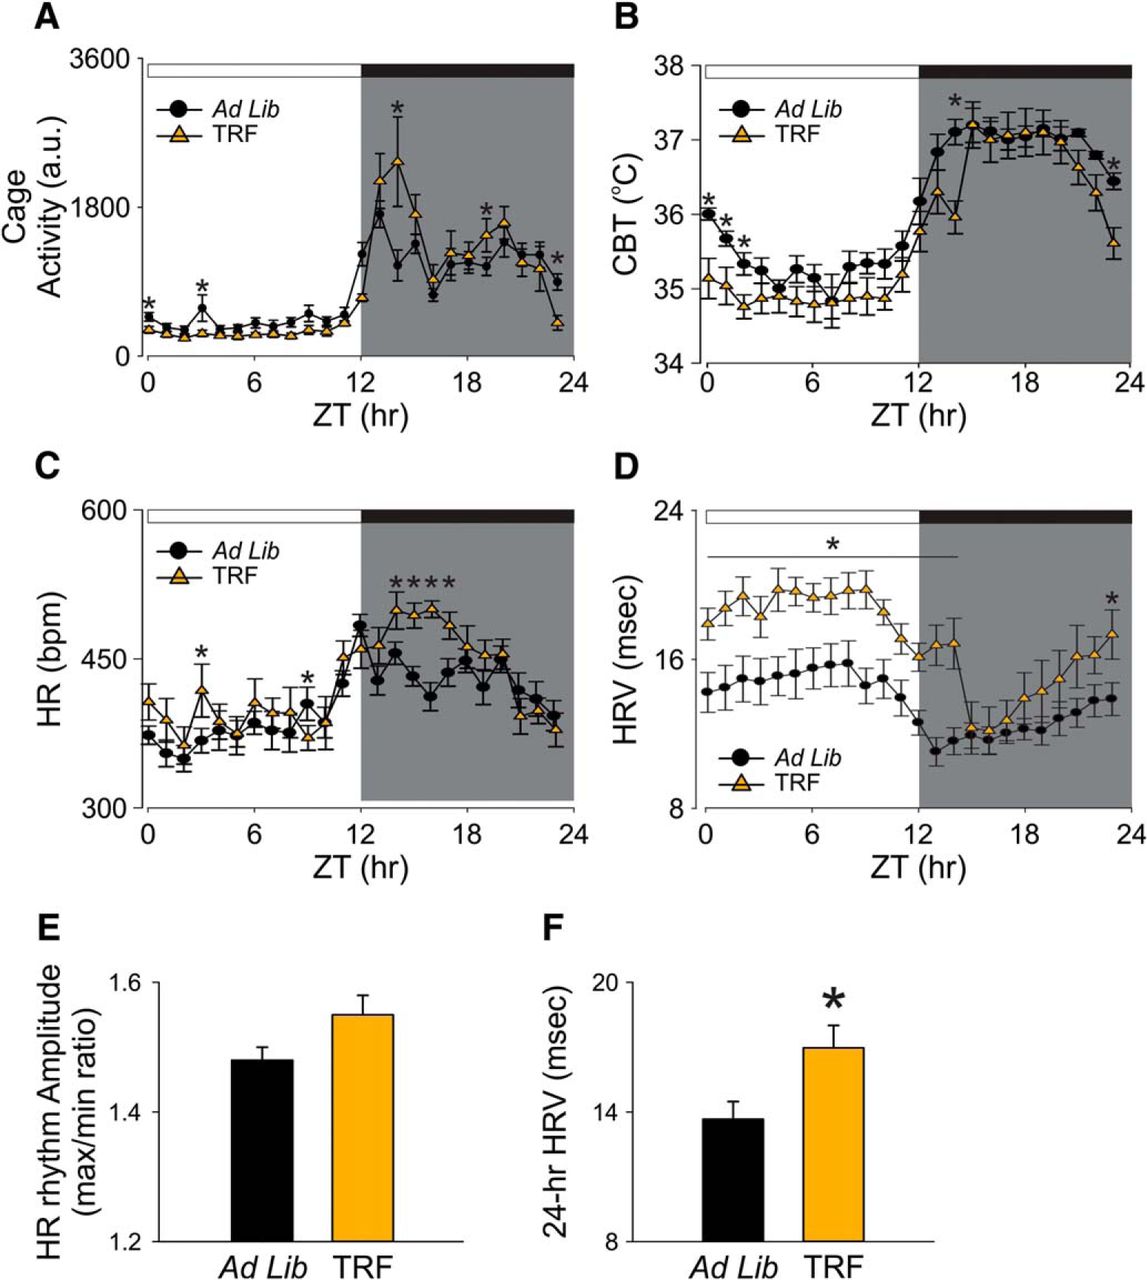
- Figure 3.
Autonomic output rhythms were improved by the TRF regimen. The autonomic outputs from ad lib (black circles) and TRF (orange triangles) Q175 mice were recorded simultaneously using telemetry device. A–D, Hourly running averages of activity (A), CBT (B), HR (C), and HRV from both groups are plotted (D). E, The HR rhythm amplitude, determined by the ratio of max and min of the day, in control and TRF-treated Q175 mice. F, The 24-h averaged HRV in control and TRF-treated Q175 mice. The temporal waveforms of autonomic outputs were analyzed using a two-way RM ANOVA with time and treatment as factors. Other comparisons between Q175 cohorts were made using a t test. Asterisks represent significant differences due to TRF regimen compared to ad lib controls (p < 0.05); n = 7/group.
- Figure 4.
TRF improved motor performance in the Q175 HD model. A, The accelerating rotarod test revealed that the TRF treatment improved motor performance by showing longer latency to fall. B, The challenging beam motor test indicated that the TRF treatment improved performance (fewer errors) by making fewer errors when the mice crossed the balanced beam. C, The circadian parameters and the performance in the two motor tests of individual mouse in ad lib group (black circles) and TRF group (orange triangles) are plotted in a 3D-XYZ grid. In this XYZ grid, there are two distinctive clusters, suggesting that the mouse with stronger circadian rhythms performed better in both motor tests. Comparisons between Q175 cohorts were made using a t test. Asterisks represent significant differences due to TRF regimen compared to ad lib controls (p < 0.05). The correlations between circadian parameters and motor performance are described in the text; n = 8/group.
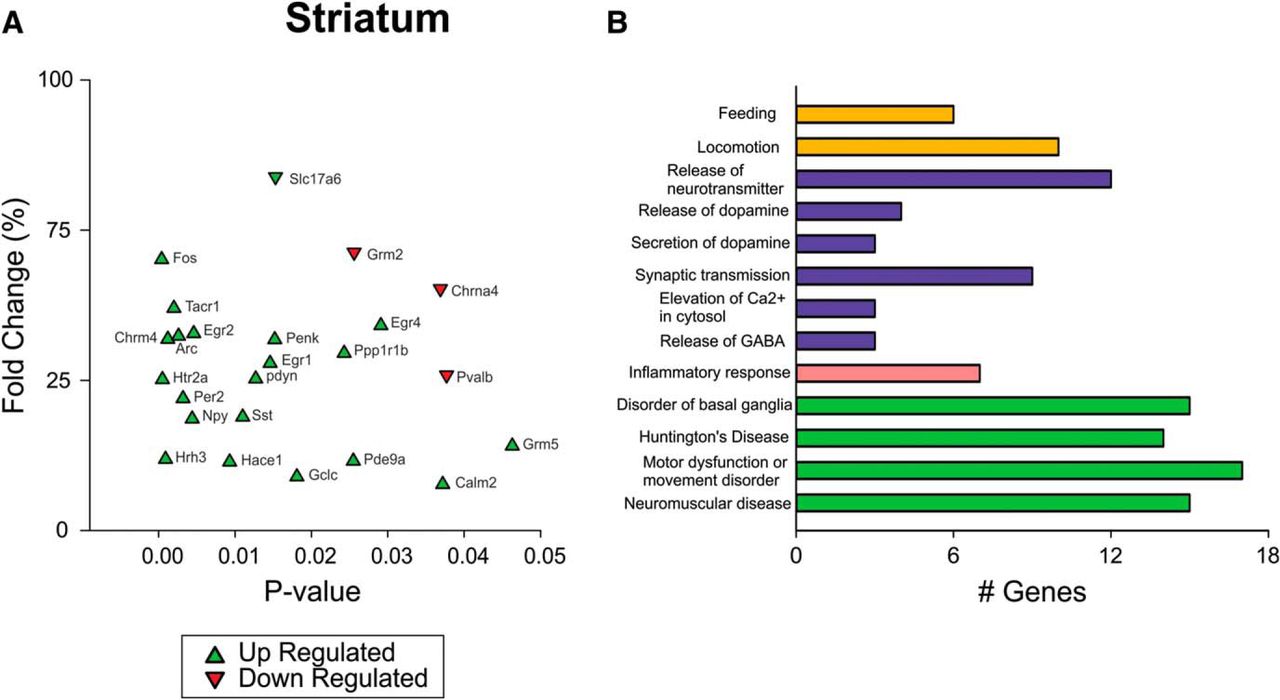
- Figure 5.
Altered expression level of multiple HD markers in the striatum of the Q175 HD model. A, Differentially expressed genes in the striatum observed between TRF group and ad lib group using NanoString (find all gene expression data in Table 6). The same Q175 mice that underwent activity/sleep monitoring and behavioral tests were allowed to recover for four weeks from manipulations before tissue collection. The signal intensity of individual genes was normalized by adjusting to internal positive standards within each sample (see Materials and Methods). B, Enriched functional clustering in the striatum using the IPA analysis tool (based on data in Table 6; uncorrected Fisher’s exact test p value < 0.05). The clusters of interest with statistical significance are picked and enriched biofunctions in those picked clusters are shown (in descending order of significance). The picked clusters include Behavior (p = 2.72E-17, color orange), Cell-to-cell signaling and interaction (p = 1.02E-17, color blue), inflammatory response (p = 2.87E-04, color pink), and neurologic disease (p = 8.74E-14, color green).


Tables
- Table 1.
List of distribution, statistical test, and power for each dataset analyzed in this study
Letter Data structure Type of test Power a food consumption Normal distribution t test 0.052 b body weight Normal distribution t test 0.050 c power Normal distribution t test 0.956 d onset Normal distribution t test 0.536 e cage activity Normal distribution t test 0.843 f bout # Normal distribution t test 0.605 g waveform Normal distribution Two-way ANOVA Time 1.000 Treatment 0.843 h bout duration Normal distribution t test 0.729 i bout # Normal distribution t test 0.413 j sleep waveform Normal distribution Two-way ANOVA Time 1.000 Treatment 0.179 K sleep duration Normal distribution t test 0.050 l bout # Normal distribution t test 0.328 m bout duration Normal distribution t test 0.895 n wake time onset Normal distribution t test 0.944 o cycle to cycle Normal distribution t test 0.440 p daytime activity Normal distribution t test 0.884 q activity waveform Normal distribution Two-way ANOVA Time 1.000 Treatment 0.997 r average CBT Normal distribution t test 0.529 s CBT waveform Normal distribution Two-way ANOVA Time 1.000 Treatment 0.729 t HR average Normal distribution t test 0.382 u HR amplitude Normal distribution t test 0.560 v HR waveform Normal distribution Two-way ANOVA Time 1.000 Treatment 0.895 w average HVR Normal distribution t test 0.632 x HRV waveform Normal distribution Two-way ANOVA Time 1.000 Treatment 1.000 y rotarod Normal distribution t test 0.911 z beam errors Normal distribution t test 0.989 aa error by beam Normal distribution Two-way ANOVA beam 1.000 Treatment 1.000 The first column lists the superscript lowercase letter referring to statistical test in the Results section. The second column is the structure of the data (normal distribution or non-normal). Each of the datasets was examined for normality (Shapiro–Wilk test) and equal variance (Brown–Forsythe test). The third column lists the statistical test. The fourth column gives the observed power value of the statistical test calculated from the actual data.
- Table 2.
Comparisons of age-matched WT under ad lib conditions to Q175 mice under ad lib or TRF regimen (n = 8/group)
WT ad lib WT ad lib vs Q175 ad lib WT ad lib vs Q175 TRF Locomotor activity rhythm AVG ± SEM Difference p value Difference p value Rhythmic power (V%) >32.59 ± 2.12 3.93 0.234 −10.82 0.009 Cage activity (a.u/h) 152.47 ± 19.08 75.67 0.002U −8.23 0.7 Onset variability (min) 23.20 ± 2.84 −4.13 0.461 7.41 0.068 Bouts/d 8.44 ± 0.39 −2.34 0.007 0.50 0.517 Average bout length (rest-phase) 166.82 ± 22.33 106.20 0.002 38.01 0.305 Sleep behavior rhythm Daily sleep 665.42 ± 16.28 −57.12 0.081 −20.89 0.534 Bouts/d 8.44 ± 0.79 0.25 0.779 −0.88 0.443 Average bout length (night) 85.54 ± 21.52 −74.83 0.075 20.03 0.721 Awake time (ZT) 12.03 ± 0.1 −0.60 0.002U 0.10 0.329 Awake deviation time I (min) 13.62 ± 3.26 −24.07 0.004 −5.70 0.382 Motor performance Latency to fall (s) 320.65 ± 24.37 64.65 0.119 −99.4 0.028 Crossing errors (#) 3.09 ± 0.21 −4.35 <0.001 −1.88 0.002U The results of t tests are reported if data passed normality tests. DF = 14. For parameters that did not pass normality tests, the Mann–Whitney rank-sum test was run and the U statistic reported; p < 0.05 was considered significant. In this and subsequent tables significant differences are shown in bold.
WT TRF WT TRF vs WT ad lib Locomotor activity rhythm AVG ± SEM Difference p value Rhythmic power (V%) 57.03 ± 3.15 24.44 <0.001 Cage activity (a.u/h) 269.96 ± 20.24 117.49 <0.001 Onset variability (min) 31.54 ± 2.49 8.34 0.028U Bouts/d 6.8 ± 0.38 −1.64 0.009 Average bout length (rest-phase) 202.55 ± 25.87 35.74 0.313 Sleep behavior rhythm Daily sleep 646.25 ± 31.61 −19.17 0.598 Bouts/d 9.5 ± 0.61 1.06 0.279 Average bout length (night) 60.06 ± 12.8 −25.47 0.326 Awake time (ZT) 11.90 ± 0.16 −0.12 0.095 Awake deviation time I (min) 19.57 ± 6.04 5.94 0.42 Motor performance Latency to fall (sec) 457.08 ± 22.12 136.43 <0.001 Crossing errors (#) 3.28 ± 0.31 0.19 0.6 Body weight (g) 29.02 ± 0.87 −0.76 0.343 Find the values of ad lib in Table 2. The results of t tests are reported if data passed normality tests. DF = 14. For parameters that did not pass normality tests, the Mann–Whitney rank-sum test was run and the U statistic reported; p < 0.05 was considered significant.
Comparison Q175 vs WT Ad lib vs TRF Age 2 months 6 months o 10 months 9 months Gene Symbol Full name Log2 fold change Log2 fold change p value Striatum Fos FBJ osteosarcoma oncogene ns ↓ ns ↑ 0.0004 Htr2a* 5-Hydroxytryptamine (serotonin) receptor 2A ns ns ns ↑ 0.0005 Hrh3 Histamine receptor H3 ns ↓ ↓ ↑ 0.0009 Chrm4 Cholinergic receptor, muscarinic 4 ↓ ↓ ↓ ↑ 0.0012 Tacr1 Tachykinin receptor 1 ns ↓ ↓ ↑ 0.0020 P value of the t test comparison with Q175 housed under ad lib is shown. Asterisk indicates HD markers changed in both the striatum and cortex. Transcripts increased by the treatment (Log2 fold change) are shown in green (↑) and those decreased by the treatment in red (↓). Transcripts without significant change (p > 0.05) are shown in gray (ns); 24% gene expressions in the striatum and 7% gene expressions in the cortex are altered by the TRF treatment. Among altered genes in striatum, >50% genes (13/24) that are shown downregulated in Q175 controls (comparison with age-matched WT controls (Lengfelder et al., 2016) are upregulated by TRF.
- Table 5.
Top 10 canonical pathways and upregulators identified using IPA analysis in striatum of Q175 under TRF regimen
Ingenuity canonical pathways −log (p value) G protein-coupled receptor signaling 7.65 cAMP-mediated signaling 6.73 Glutamate receptor signaling 6.08 Neuropathic pain signaling in dorsal horn neurons 5.02 Gαi signaling 4.94 Synaptic long-term potentiation 3.38 Gαq signaling 3.03 iNOS signaling 2.88 CREB signaling in neurons 2.87 Serotonin receptor signaling 2.77 Upstream regulator −log (p value) BDNF 13.41 CREB1 12.27 Cocaine 11.87 CNTF 11.14 HTT 10.82 TET1 10.40 GDNF 9.74 ADCYAP1R1 9.72 Dalfampridine 8.95 Haloperidol 8.90 - Table 6.
Full dataset of expression of HD markers in the striatum of Q175 that are tested by using NanoString technology. Bold text indicates significant difference between ad lib and TRF feeding protocols
Gene symbol −Log (p value) Log 2 Fold Change Aco2 0.51 −0.09 Aif1 0.58 0.13 Apba2bp 0.60 −0.37 Arc 2.58 0.11 Bdnf 0.54 −0.56 Bhlhb2 0.16 −0.12 C1qc 0.17 0.14 C3 0.49 0.05 C4a 0.60 0.08 calb1 0.39 0.11 Calm1 0.74 0.03 Calm2 1.43 −0.16 Calm3 0.06 −0.09 Cdkn1c 0.04 −0.21 Chat 0.55 0.07 Chga 0.54 −0.01 Chrm1 0.33 −0.13 Chrm4 2.92 0.17 Chrna4 1.43 −0.15 Chrnb2 0.62 0.07 Cnr1 1.02 0.04 Cth 0.28 0.09 Dnajb5 0.13 −0.04 Drd1a 1.06 0.21 Drd2 1.00 0.25 Egr1 1.84 0.13 Egr2 2.34 0.24 Egr3 0.86 0.08 Egr4 1.54 0.21 F8a 1.24 −0.01 Fos 3.39 0.23 Fth1 0.34 0.03 Gabra1 0.43 −0.02 Gabrd 0.05 0.11 Gclc 1.74 0.15 Gclm 0.07 −0.08 Gfap 1.03 0.03 Grm2 1.59 −0.47 Grm5 1.33 0.01 Hace1 2.03 −0.03 Hmox1 0.86 0.20 Hrh3 3.04 0.31 Htr1a 0.03 −0.36 Htr1b 1.22 0.27 Htr2a 3.32 0.15 Htt 0.50 −0.10 Il12b 0.73 0.04 Il6 0.41 −0.16 Kcnip2 1.05 0.10 Lonp1 0.67 0.05 Nfe2l2 0.01 −0.05 Ngf 0.75 −0.26 Nos1 0.96 0.02 Nos3 0.09 0.10 Npy 2.35 −0.02 Nqo1 0.90 0.03 Ntrk1 1.18 0.13 Ntrk2 1.12 −0.09 Pde10a 0.97 0.20 Pde9a 1.59 0.02 (Continued) pdyn 1.89 0.22 Penk 1.82 0.26 Penk1 1.80 0.23 Per2 2.50 −0.01 Ppargc1a 0.08 0.05 Ppp1r1b 1.61 0.19 Ptpn5 0.76 0.09 Pvalb 1.42 0.02 Rgs4 0.09 0.00 Rrs1 0.88 0.16 Ryr1 0.15 −0.14 Sap25 0.72 0.03 Slc17a6 1.81 −0.15 Slc17a7 0.10 −0.70 Slc1a2 0.12 −0.09 Slc6a3 0.78 0.16 Slco6b1 0.61 0.41 Snap25 0.12 −0.08 Sod1 1.01 0.01 Sod2 0.00 0.05 Sst 1.96 0.17 Tac1 1.09 0.15 Tacr1 2.71 0.33 Tfeb 0.98 0.03 Tmsb10 0.05 0.24 Vgf 0.69 0.08 hHTT polypro 0.01 −0.12 mHTT polypro 0.15 −0.01
In this issue


