

Article Figures & Data
Figures
- Figure 1.
Near-linear scaling with excitatory optogenetic stimulation in mouse V1. A, Schematic of experimental stimulus protocol. If scaling is linear, the same input pulse produces the same response when baseline (spontaneous) rate is changed. B, Baseline rates are raised using ChR2 in excitatory (E) neurons (Cre-dependent virus in Emx1-Cre mouse line). C, Population histograms showing responses to combined ChR2 and visual (90% contrast) stimuli. In the top row, columns show three groups of neurons, divided based on size of ChR2 baseline firing rate changes: left, smallest ChR2 effects (n = 94; 36 single, 58 multiunits); middle, intermediate ChR2 effects (n = 101; 31 single, 70 multiunits); right, largest ChR2 effects (n = 94; 28 single, 66 multiunits). Brown, responses to visual stimulus with no optogenetic stimulus; cyan, responses to visual stimulus when baseline rates are changed by sustained optogenetic stimulus. The bottom row shows the same data as the top row, with spontaneous firing rates subtracted. Visual responses differ somewhat between columns because each column is a different group of neurons, but within each group there is little response change as spontaneous rate varies. D, Linear scaling is seen across a wide contrast range. Top row, responses without baseline subtraction; bottom row, baseline subtracted. Error bars are SEM of pooled unit responses. E, Linear scaling is seen on average, across neurons with a variety of ChR2-induced baseline rate changes, with some weak sublinearity at the highest rate changes and highest contrasts. Y axes, difference in visual responses (relative to baseline) with and without ChR2 stimulation; dashed line at zero shows a perfectly linear response. Red, LOWESS regression; shaded region is a bootstrapped 95% confidence interval. Two outlier points in 90% contrast plot are omitted for visual clarity although they are included in the regression; the two outliers are shown in Fig. 2A.
- Figure 2.
Different units can be sub- or supralinear, although mean of population is near-linear. A, Unit responses to excitatory neuron optogenetic (Emx1-ChR2) stimulation, showing that many individual units are significantly supra- or sublinear. X-axis, average firing rate change with ChR2 stimulus; y-axis, difference between visual responses (90% contrast; each visual response measured from preceding baseline) with and without optogenetic stimulus. Error bars are SEM. Points that are at least 1 SEM away from horizontal line at zero (linear response) are colored blue (single units; SU) or black (multiunits; MU). Points within 1 SEM of linear are gray. Data are as in Fig. 1E for 90% contrast, here with SEM for each point, and adding on the negative y-axis the few units that are suppressed by stimulation. 34% of single units are significantly nonlinear (17/50, p < 0.01, KS test), and 28% of multiunits are significantly nonlinear (67/239, p < 0.01, KS test). B, Four example units. Pink region shows visual stimulus presentation time. Shaded regions around mean response are SEM.
- Figure 3.
Spiking model shows sublinear scaling with feedforward inhibition. A, Schematic of network architecture. Blue, E cells; green, I cells. The conductance-based spiking model produces stochastic Vm and spikes as seen in vivo, and an example membrane potential (Vm) trace from one excitatory cell is shown. B, Response scaling as feedforward (FF) input to E and I cells is varied. To measure response scaling, inputs to E and/or I cells with rate given by x and y axes are delivered, and average response over all E cells is measured. Then, the E and I input rates are multiplied by a constant (here, 2), and the size of the second response is compared to the first. Percentage change shown by color: yellow, second response is similar (linear); blue, second response is smaller (sublinear). Contour lines show first response (spk/s). Response rates <5 and >20 spk/s are masked (gray). Average spontaneous rate is adjusted to 5 spk/s (Methods), and 33% of network neurons receive external input, to approximate the sparse set of cortical neurons that typically respond to sensory inputs (Fig. 1). There is a gradual increase in sublinearity moving up and to the right in the figure. Pink points show E and I rate combinations used in C and D. C, Near-linear responses to a range of input sizes when feedforward input is provided to E cells only. Parameters here are indicated by pink dot in B, and first two responses here are the same two responses used to compute percentage change shown in color there. Left, average rates; right, same data replotted showing change (spk/s) in response (y-axis) as a function of prior response (x-axis). For these plots, a linear response is a horizontal line (dashed gray line). Heavy lines, prior rates <50 spk/s, highlighting for visual clarity rates far from potential saturation caused by absolute refractory period (3 ms). D, Sublinear responses to a range of input sizes when input provided to both E and I cells. Same conventions as C. In this case, heavy green line in right panel lies farther below horizontal than heavy blue line in C, showing more sublinear scaling.
- Figure 4.
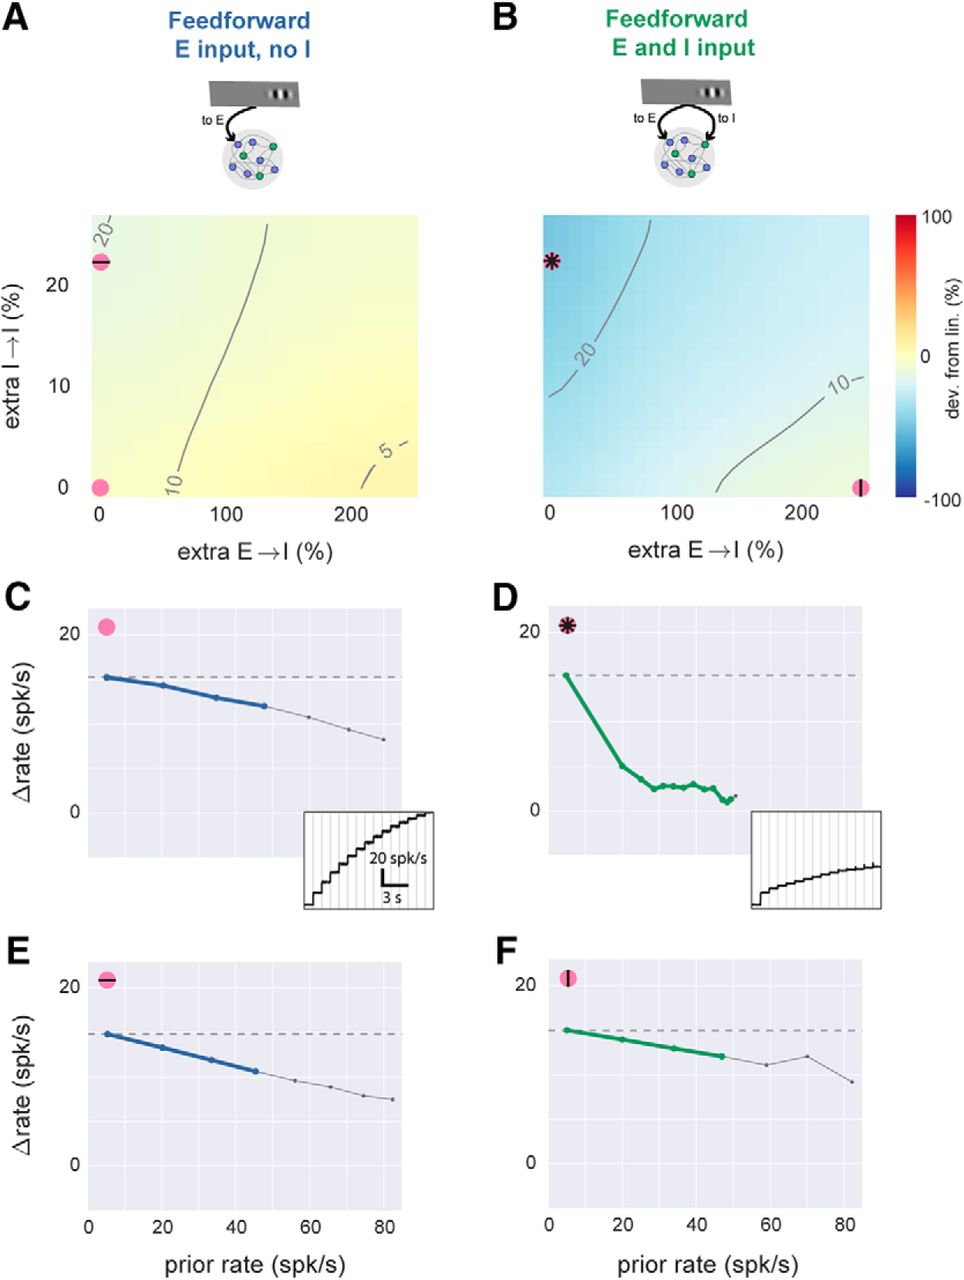
With feedforward inhibition, network model can produce linear or sublinear responses. A, Simulations with feedforward input to E cells only, while local network connectivity is varied. x-axis, E-to-I connection strength; y-axis, I-to-I connection strength. Axes give percentage change in total synaptic input that a single cell receives from one (E or I) population (see Methods), where zero is a balanced network (e.g. Fig. 3) with equal probability of synapses onto E and I cells. Other conventions as in Fig. 3B (contour lines show evoked response to first stimulus, color shows percentage difference in response to doubled external stimulus). Spontaneous rate and external stimulus rates are constant for entire panel. B, Simulations with feedforward input to E and I cells while local connectivity is varied. Pink symbols show parameter regions where scaling is sublinear (stronger I→I connectivity) or linear (stronger E→I connectivity). C, Scaling plot (response size as a function of previous rate) for parameters shown by pink dot in A: no extra local connections, feedforward E only, same parameters as Fig. 3C. Inset, time course of responses to the step stimulus; subtracting each rate from rate at the previous step gives y-axis in main panel. D–F, same plots, using parameters shown by corresponding pink dots in B. Comparing D and E shows that large sublinearity can be produced by extra I→I connections only with feedforward inhibition. Comparing D and F shows that linearity can also be achieved with feedforward inhibition if E→I connectivity is strengthened.
- Figure 5.
Feedforward inhibition leads to sublinearity in networks with a range of recurrent synaptic sparsities and synaptic strengths. Top row, simulations in the conductance-based network with 10% connectivity, with strong synapses (each cell receives 10× more E and I input than in the networks of Figs. 3 and 4). Other rows show networks with different sparsity and synaptic strength. The network of Figs. 3 and 4 is the fourth row (2% sparsity, 1× strength). A, Scaling plots showing network response as a function of prior rate before stimulus. Blue, feedforward E input only, parameters shown in column B; green, feedforward E and I input, corresponding parameters shown in column C. In all rows, feedforward inhibition (green) allows more sublinearity than feedforward excitation alone (blue). Dashed line, top row: network instability (rates diverge). B, Average network response as I-I synaptic strength (x-axis) and feedforward E input (y-axis) are varied. No feedforward inhibition. Black dot shows parameters used to plot blue line in A (parameters chosen to maximize sublinearity). Gray regions mask areas where evoked rates are <5 or >20 spk/s, or where network was unstable (rates diverged to maximum rate given by refractory period). Other conventions as in Figs. 3B and 4A,B. C, network response as a function of I→I and feedforward E input, in the presence of feedforward inhibition. Individual gray squares seen in fifth row (20% sparsity) column B, inside the 5–20 spk/s contours indicate strongly irregular (nonmonotonic) response scaling: strong sublinearity for at least one stimulus step, when both previous and later responses were linear or supralinear. Feedforward inhibition arrival rate to stimulated cells for each row, from top: 14k, 14k, 19k, 11k, 17k spk/s, chosen to give a 15 spk/s response for 3× the feedforward excitatory rate that alone produces a 15 spk/s response (see Fig. 3B). Fourth row (2% sparsity, same network as Figs. 3 and 4) uses 40% extra I→E connections to show that linear responses are robust to many forms of connectivity variation.
- Figure 6.
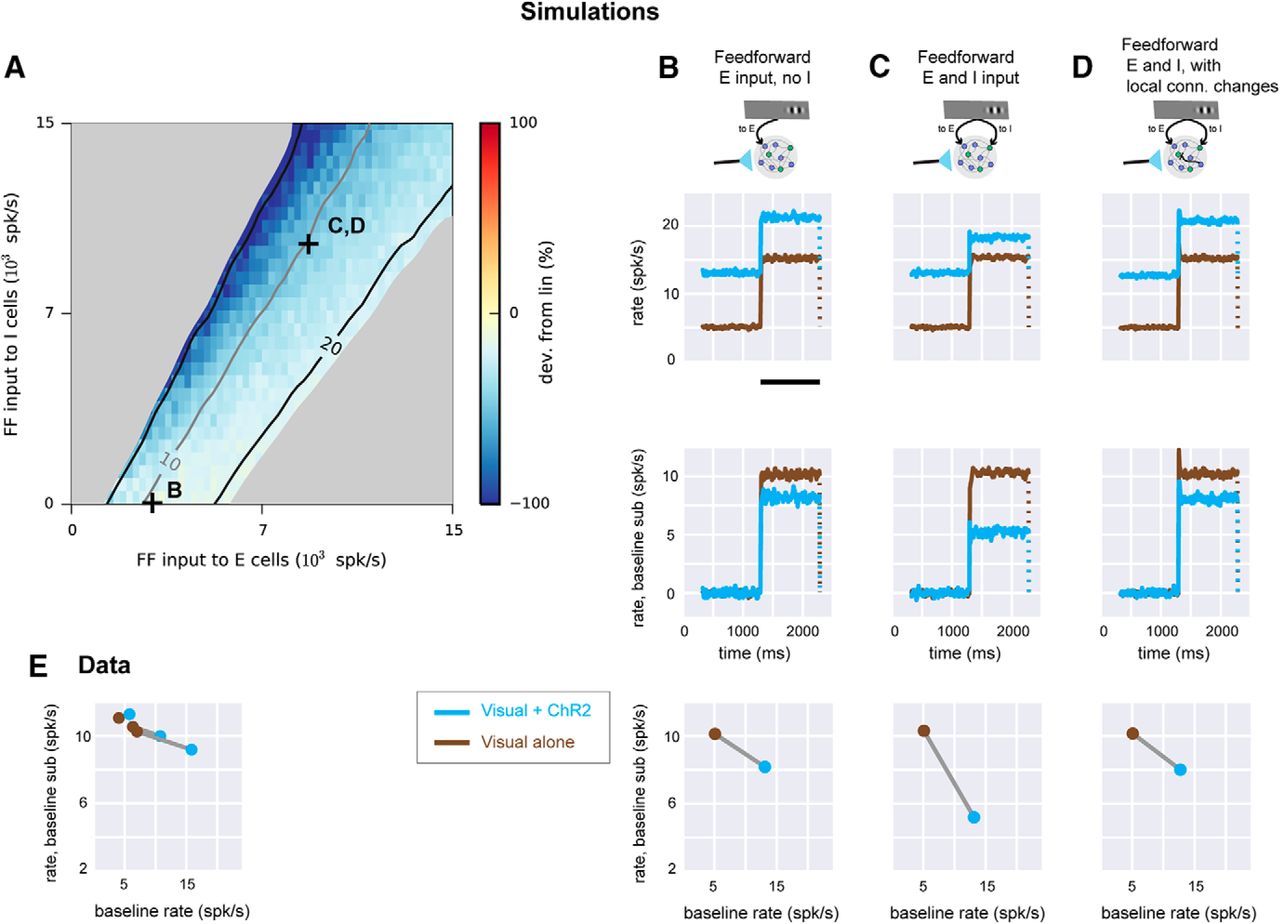
Experimental linear scaling can be replicated in networks receiving feedforward inhibition. A, Simulation where conductance steps (ChR2 input) and feedforward Poisson trains (visual input) are combined. Strengths of feedforward E input (x-axis) and feedforward I input (y-axis) are varied while spontaneous rate is set to 5 spk/s. Connection sparsity is 2%. Other conventions as in Fig. 3B. Symbols (+) show values of E, I input used in B–D. B, Network responses when feedforward input is supplied to E cells only. Top row, network responses (mean of E cell rates). Brown, feedforward Poisson (visual) input only; cyan, conductance (ChR2) input combined with visual input. Conductance increase lasts for the full duration of the cyan trace. Visual input duration is shown by black bar (bottom of plot). Dotted line indicates rates return to previous baseline when feedforward input ends. Second row, same data as top row, with baseline rate subtracted. Third row, response (y-axis) as a function of rate before feedforward input begins (x-axis). C, Same network simulations with feedforward input to both E and I cells (parameters marked by C in A). D, network receiving feedforward input to both E and I cells, but with stronger local connections from E to I cells (compare Fig. 4, with similar effect for two feedforward Poisson inputs instead of feedforward input paired with conductance step as shown here). E, data from Fig. 1C plotted to show how responses scale as baseline is changed. Three lines (brown, no ChR2; cyan, with ChR2) are the three groups of recorded neurons shown in Fig. 1C.
- Figure 7.
PV-ChR2 stimulation data support the recurrent model with feedforward inhibition. A, Moderately sublinear scaling of visual responses is seen when PV neurons are optogenetically stimulated. (Data set previously reported in (Glickfeld et al., 2013)). Same conventions as in Fig. 1D. n = 43 units, 6 SU, 37 MU. B, Response sizes plotted as a function of baseline rate; same conventions as bottom panels in Fig. 6B–D. Stimulation of PV inhibitory neurons lowers baseline firing rates (here 2.3× reduction), so visual + ChR2 response (blue point) is to the left of visual only (brown). C, D, Model (with feedforward inhibition) that best fits E neuron stimulation data also describes moderate sublinearity seen in PV-ChR2 stimulation. C, Model with feedforward input to E cells only (same model as in Fig. 6B) shows very strong sublinearity. Two lines show two different strengths of optogenetic input to I cells (chosen to produce 2× or 3× decrease in baseline rates). D, Model with feedforward input to E and I cells and stronger local E-to-I connectivity (same model as in Fig. 6D), shows a range of sublinear scaling similar to that seen in the experimental data (A, B).


In this issue


