

Article Figures & Data
Figures
- Figure 1.
Original recordings comparing cardio-respiratory responses to the third LCR activation by intratracheal water injection (10 µl) between pups subjected to (A) control conditions and (B) neonatal stress in the form of maternal separation. The traces illustrate (from top to bottom): intercostal EMG, Sp o2, and heart rate. These recordings were obtained following the third injection in 15-d-old male pups.
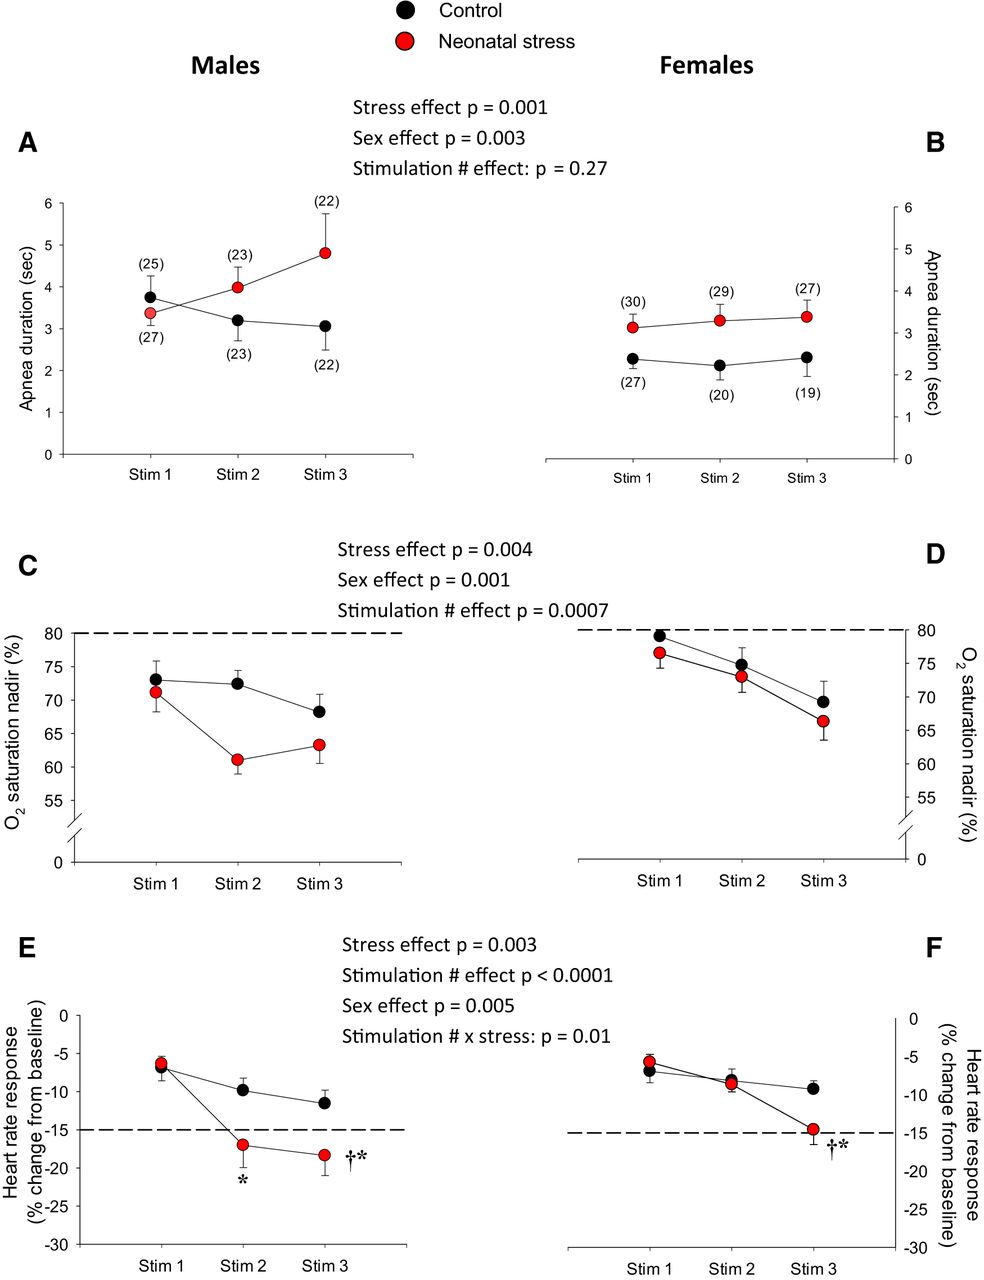
- Figure 2.
Neonatal stress augments cardio-respiratory inhibition following LCR stimulation. Top panels, Apnea duration for (A) males and (B) females. Middle panels, Nadirs in Sp o2 observed in (C) males and (D) females. Bottom panels, Peak heart rate responses (bradycardias) observed in (E) males and (F) females. A, B, The numbers in brackets indicate the number of pups in which measurements were obtained; this applies for all cardio-respiratory variables. Experiments were performed at postnatal days 14 and 15. In the lower panels, the dotted lines indicate the Sp o2 nadir (C, D) and change in heart rate (E, F) that are considered clinically significant in newborn (see Discussion for references and details). Black circles, pups that were not disturbed during the neonatal period (control); red circles, pups subjected to neonatal stress in the form of maternal separation (3 h/d, from postnatal days 3 to 12). Data are reported as mean ± SEM. For each variable, ANOVA results are reported in the figure; symbols indicate results from post hoc tests; *, statistically different from the value measured following the first stimulation (stim 1) at p < 0.05; †, statistically different from corresponding control value at p < 0.05.
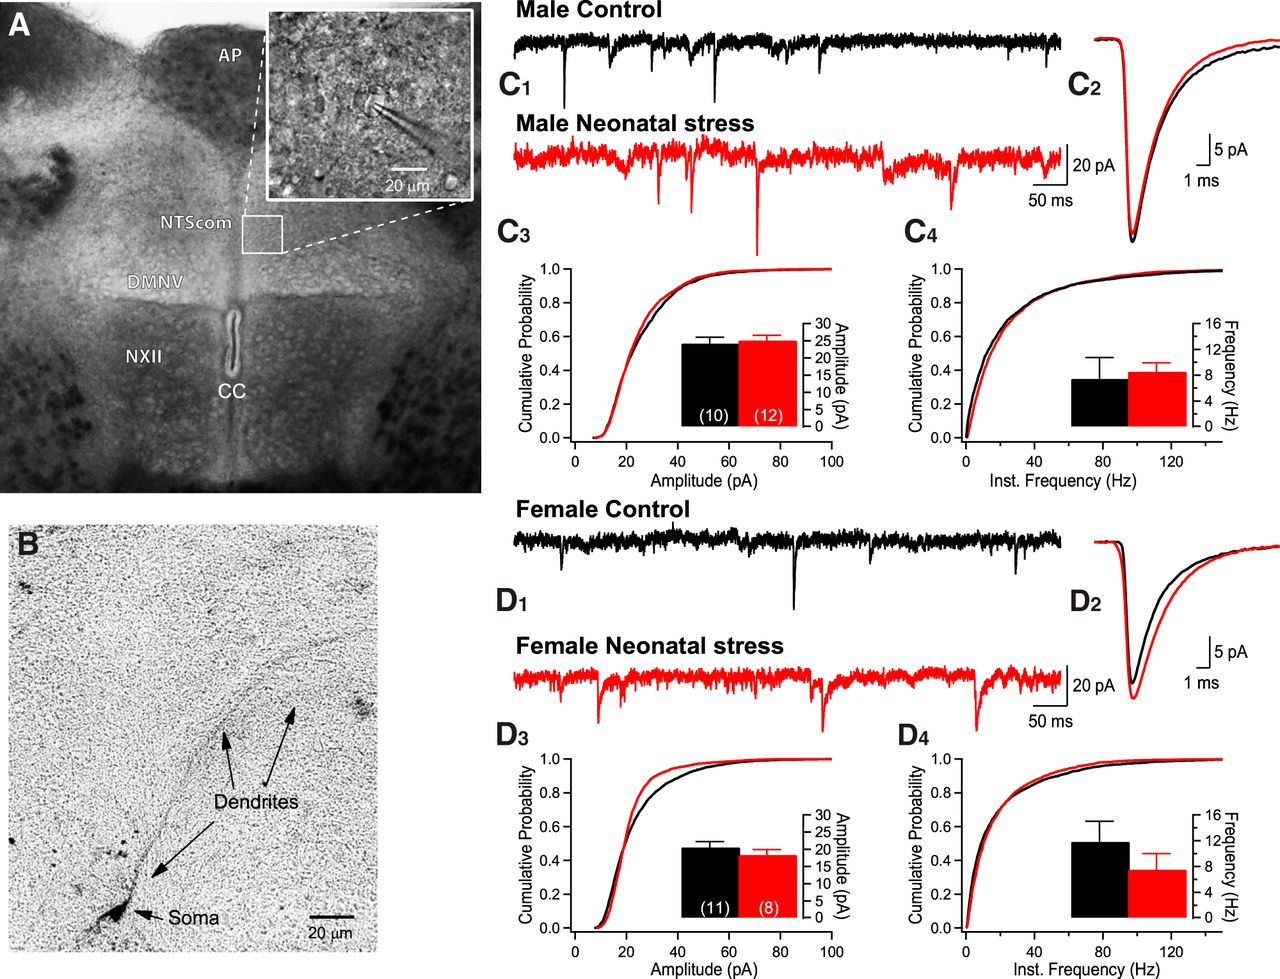
- Figure 3.
Neonatal stress has no effect on sEPSCs recorded in the NTScom. A, Collage of photomicrographs illustrating the caudal brainstem slice in which whole-cell recordings were performed in the NTScom and the DMNV. The area postrema (AP), central canal (CC), and hypoglossal motor nucleus (NXII) NXII were used as visual landmarks. The inset shows a patch pipette attached to a cell. B, Photomicrograph of a biocytin-labeled NTScom neuron in which recordings were obtained. C, Comparison of EPSCs recorded in the NTScom of 14-d-old male pups that were either raised under standard conditions (black; control) or subjected to the neonatal stress protocol (red; NMS 3 h/d, postnatal days 3-12.). C1, Original recordings. C2, Superimposed average EPSCs (10-min recording) comparing group data. C3, Cumulative probability plots of EPSC amplitudes; in the inset, the histograms show mean data from each cell ± SEM. Within each bar, the number in bracket indicates the number of cells that were recorded in this group. C4, Cumulative probability plots of EPSC frequencies; in the inset, the histograms show mean frequency data from each cell ± SEM. D, Comparison of EPSCs recorded in the NTScom of 14-d-old female pups (control vs neonatal stress). D1, Original recordings. D2, Superimposed average EPSCs (10-min recording) comparing group data. D3, Cumulative probability plots of EPSC amplitudes with histograms presenting the mean data in the inset ± SEM. D4, Cumulative probability plots of EPSC frequencies with histograms presenting the mean data in the inset ± SEM.
- Figure 4.
Neonatal stress induces sex-specific augmentation of sEPSCs in the DMNV. A, Photomicrograph of a patch pipette attached to a cell within the DMNV. B, Photomicrograph of a biocytin-labeled DMNV neuron in which recordings were obtained. C, Comparison of EPSCs recorded in the DMNV of 14-d-old male pups that were either raised under standard conditions (black; control) or subjected to the neonatal stress protocol (red; NMS 3 h/d, postnatal days 3–12). C1, Original recordings. C2, Superimposed average EPSCs (10-min recording) comparing group data. C3, Cumulative probability plots of EPSC amplitudes; in the inset, the histograms show mean data ± SEM for each group. Within each bar, the number in bracket indicates the number of cells that were recorded in this group. C4, Cumulative probability plots of EPSC frequencies; in the inset, the histograms show mean frequency data ± SEM for each group. D, Comparison of EPSCs recorded in the DMNV of 14-d-old female pups (controls vs neonatal stress). D1, Original recordings. D2, Superimposed average EPSCs (10-min recording) comparing group data. D3, Cumulative probability plots of EPSC amplitudes with histograms presenting the mean data ± SEM in the inset. D4, Cumulative probability plots of EPSC frequencies; p values reported above the histograms are results from post hoc tests.
- Figure 5.
Heterogeneous effects of neonatal stress on the EPSC responses to TTX application. Representative EPSC recording obtained within the DMNV of male control pups (A1) before (baseline; black) and (A2) after TTX application (gray); recording is from the same neuron. A3, Superimposed average EPSCs (10-min recording) comparing data before and after TTX application. Similar recording from a neuron from a male subjected to neonatal stress (B1) before (red) and (B2) after TTX application (gray). B3, Superimposed average EPSCs (10-min recording) for each condition. Mean EPSC data from the NTScom for (C1) frequency (C2) and amplitude before and after TTX application. For each variable, ANOVA results for each factor (and factorial interactions) appear in the graphs. In the NTScom, stress had no effect on either variable; data from control and stressed groups were pooled. Because the effect of sex was significant for amplitude, data from males (blue circles) and females (red circles) are reported separately. Within the DMNV, mean EPSC frequency (D1, E1) and amplitude data (D2, E2) are reported separately for each group and sex since the responses to TTX application were influenced by both factors. Data are reported as mean ± SEM; the numbers in brackets indicate the number of cells in each group. Symbols indicate results from post hoc tests; *, statistically different from the baseline (pre-TTX) value at p < 0.05; †, statistically different from corresponding control value at p < 0.05; #, statistically different from corresponding female value at p < 0.05.
- Figure 6.
Neonatal stress has sex-specific effects on the relationship between circulating testosterone and corticosterone levels in pups. Comparison of the correlations between corticosterone and testosterone in pups maintained in (A) control conditions or (B) subjected to neonatal stress in the form of maternal separation (3 h/d, from postnatal days 3 to 12). Data are reported for males (blue) and females (pink). C, Comparison of mean testosterone levels between control and stressed pups. Data are reported as mean ± SEM. Numbers in brackets within the bars indicate the number of samples analyzed in each group. ANOVA results are reported below the histogram. Note that the number of samples used for this panel is greater than in A, B because corticosterone values could not be obtained for some samples.
- Figure 7.
Sex-specific effects of testosterone incubation on the EPSC in the DMNV. Comparison of EPSC recordings obtained within the DMNV from tissue slices were either incubated in vehicle (A1; DMSO 0.004%, colored) or testosterone (A2; 10 nM, gray) for 1 h before recordings. Data were obtained in male pups raised in control conditions (black) or subjected to neonatal stress (maternal separation; red). A3, Superimposed average EPSCs (10-min recording) comparing data with and without testosterone incubation. Similar recordings from neurons from females in which tissue was previously incubated with vehicle (B1) or testosterone (B2). B3, Superimposed average EPSCs (10-min recording) for each condition. Mean EPSC data from males comparing (C1) frequency (C2) and amplitude with or without testosterone preincubation application in pups raised in control conditions or subjected to neonatal stress. Similar data are reported for females in D1, D2. ANOVA results for each factor (and factorial interactions) appear in the graphs. Data are reported as mean ± SEM; the numbers in brackets indicate the number of cells in each group; *, statistically different from the vehicle value at p < 0.05; †, statistically different from corresponding control value at p < 0.05; #, statistically different from corresponding male value at p < 0.05.


Tables
- Table 1.
Comparison of body weight, selected cardio-respiratory variables, and arterial blood gases between pups maintained under standard conditions (control) versus those subjected to neonatal stress (maternal separation)
Control Neonatal stress Female Male Female Male Stress effect Sex effect Factorial interaction Body weight (g) 41 ± 1.4 41 ± 1.3 37 ± 1.2 37 ± 1.4 p = 0.003
F(1,124) = 9.408p = 0.49
F(1,124) = 0.469p = 0.96
F(1,124) = 0.002Respiratory frequency (breaths/min) 51 ± 2.9 51 ± 3.5 47 ± 2.4 47 ± 2.7 p = 0.17
F(1,120) = 1.895p = 0.98
F(1,120) = 0.001p = 0.98
F(1,120) = 0.001SpO2 (%) 91 ± 1.0 90 ± 1.2 90 ± 1.1 88 ± 1.2 p = 0.11
F(1,119) = 2.601p = 0.19
F(1,119) = 1.745p = 0.69
F(1,119) = 0.160Heart rate (beats/min) 414 ± 15 418 ± 15 394 ± 12 430 ± 16 p = 0.79
F(1,120) = 0.066p = 0.29
F(1,120) = 1.151p = 0.17
F(1,120) = 1.892Body temperature (oC) 35.0 ± 0.0 35 ± 0.0 34.9 ± 0.0 35.0 ± 0.0 p = 0.34
F(1,116) = 0.935p = 0.34
F(1,116) = 0.935p = 0.34
F(1,116) = 0.935pHa 7.25 ± 0.03 7.27 ± 0.03 7.33 ± 0.03 7.36 ± 0.03 p = 0.01
F(1,24) = 7.072p = 0.51
F(1,24) = 0.456p = 0.85
F(1,24) = 0.035PaO2 (mm Hg) 97 ± 5.9 99 ± 5.6 102 ± 8.9 100 ± 4.4 p = 0.62
F(1,25) = 0.250p = 0.94
F(1,25) = 0.006p = 0.78
F(1,25) = 0.082PaCO2 (mm Hg) 38 ± 3.5 40 ± 4.1 32 ± 2.2 30 ± 3.1 p = 0.01
F(1,25) = 7.351p = 0.98
F(1,25) = 0.0005p = 0.57
F(1,25) = 0.334Measurements were performed in anesthetized pups (14-15 d old) under resting conditions. Note that blood gas measurements were obtained in a distinct series of experiments; LCR in these pups was not tested. Data are reported as mean ± SEM. A bold value indicates a significant effect of factors (ANOVA).
In this issue


