

Article Figures & Data
Figures
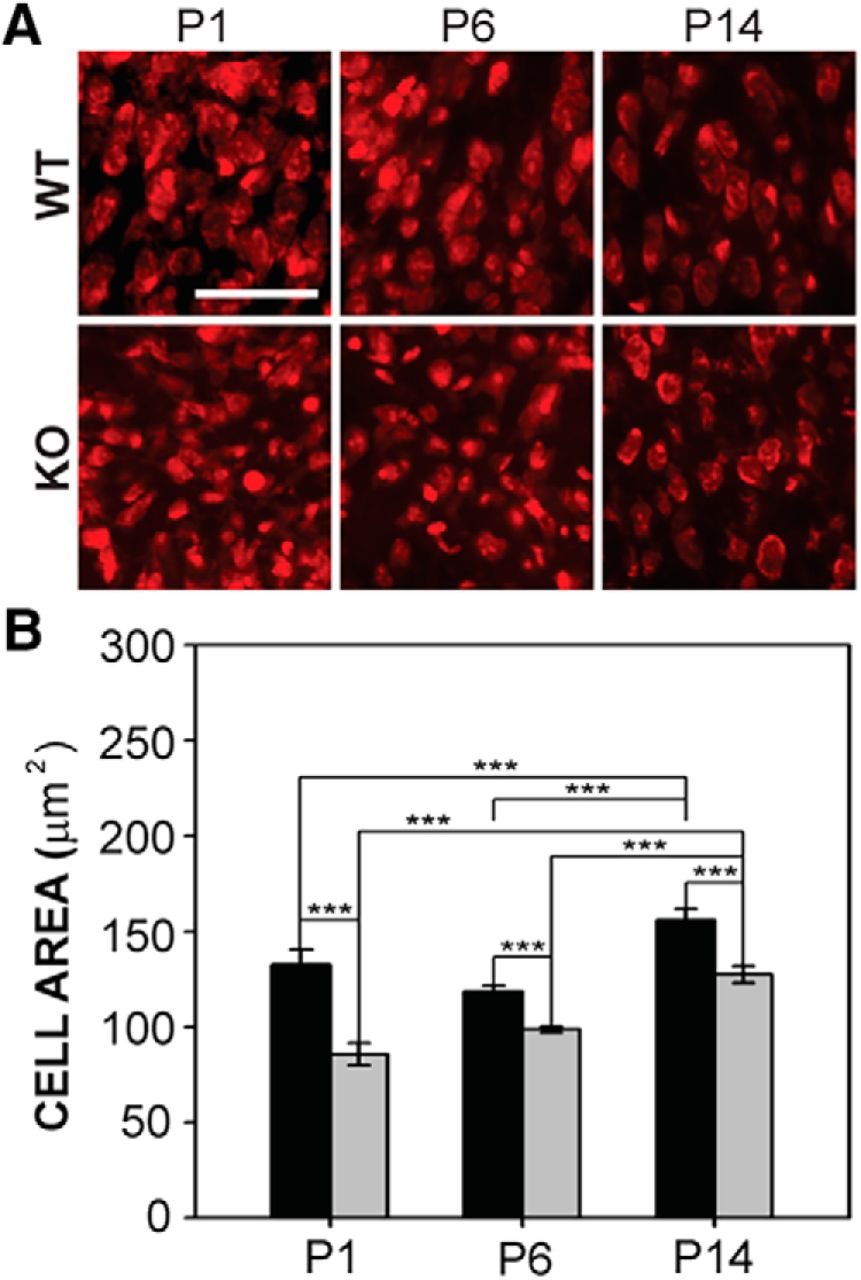
- Figure 1.
VCN cell size in wild-type and Fmr1 KO mice. A, VCN cells stained with fluorescent Nissl in wild-type (top) and Fmr1 KO (bottom) mice at P1, P6, and P14. Scale bar = 100 μm. B, Cell size did not differ between wild-type mice (black bars) and Fmr1 KO mice (gray bars) at P1, P6, or P14. Both genotypes showed increases in cell size between P1 and P14, and between P6 and P14. *, p < 0.05; **, p < 0.01; and ***, p < 0.001.
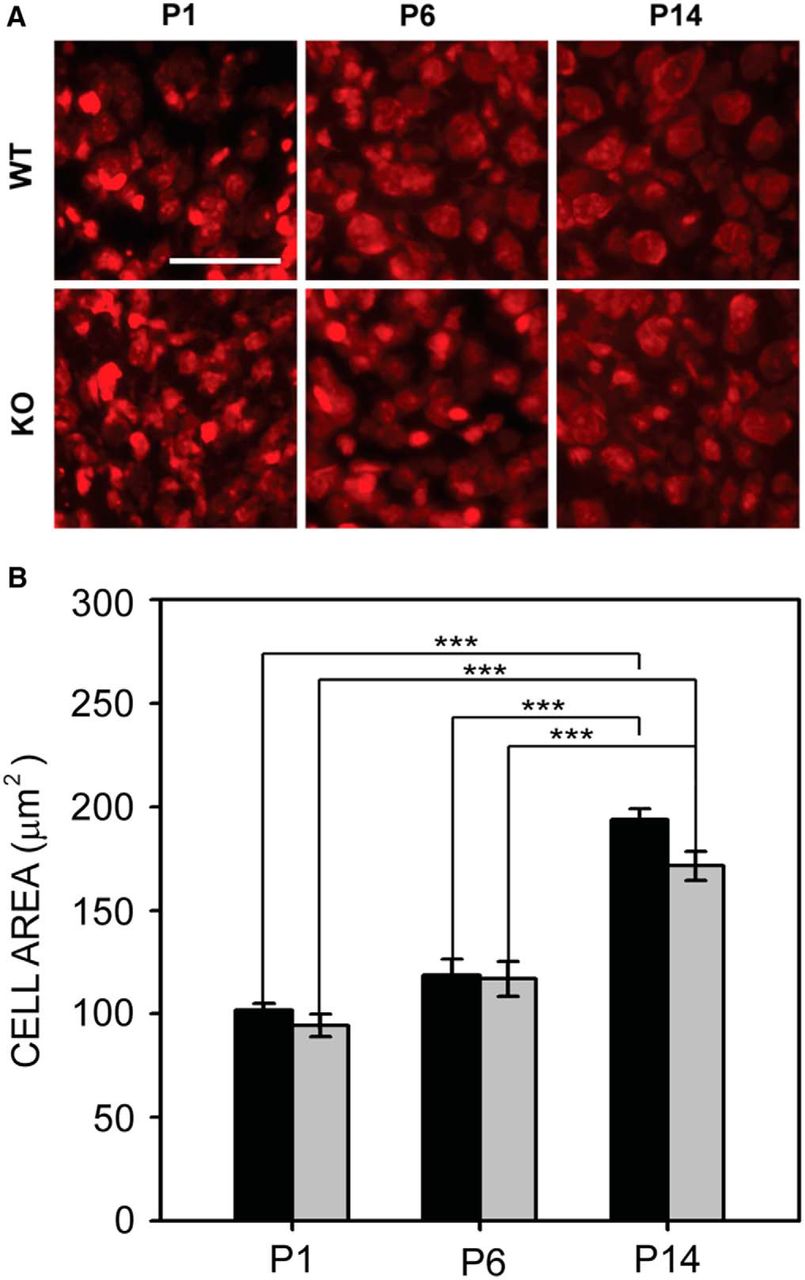
- Figure 2.
MNTB cell size in wild-type and Fmr1 KO mice. A, MNTB cells in wild-type mice (top) and Fmr1 KO mice (bottom) at P1, P6, and P14. Scale bar = 100 μm. B, The cross-sectional area of Fmr1 KO neurons was significantly reduced compared to wild-type mice at all ages tested. *, p < 0.05; **, p < 0.01; and ***, p < 0.001.
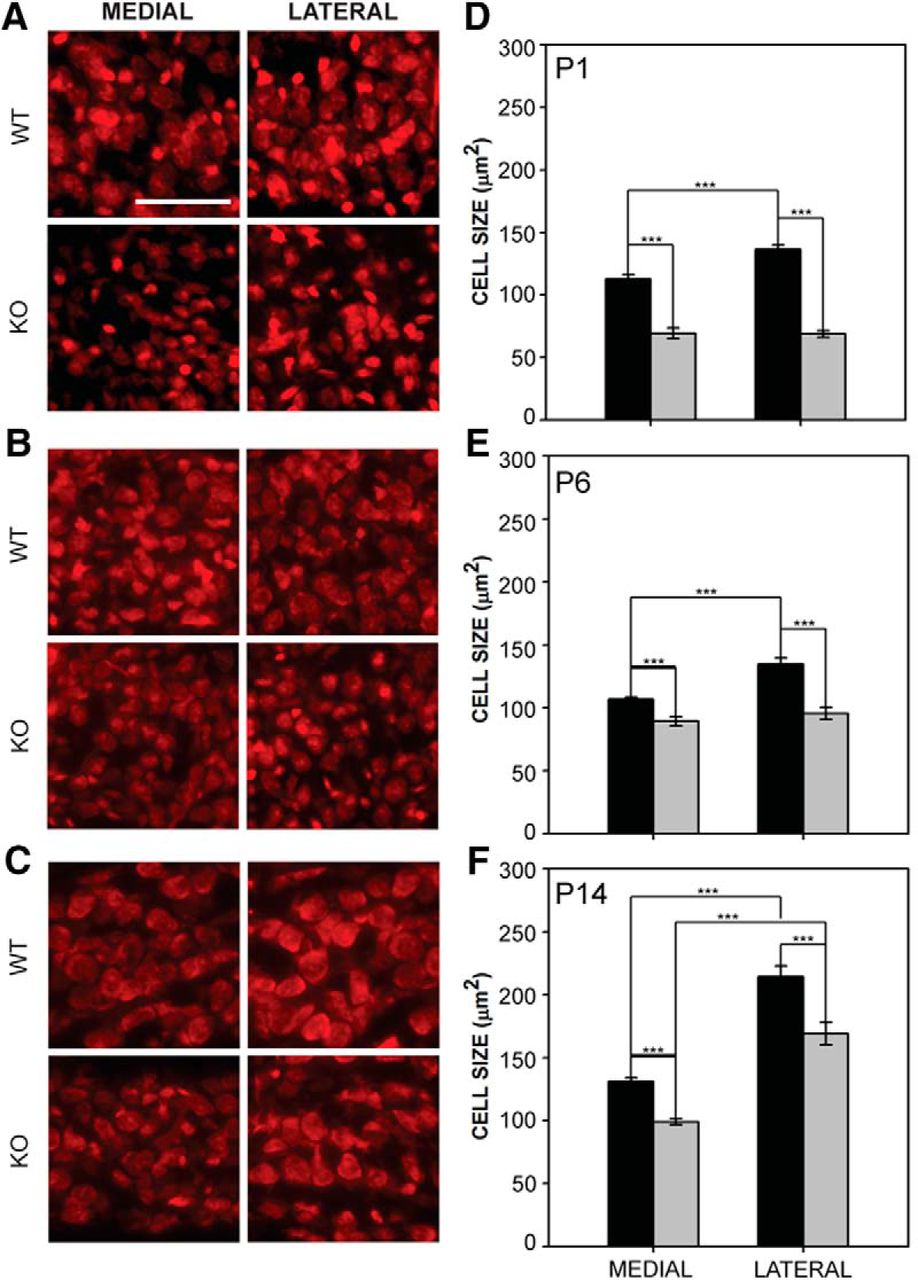
- Figure 3.
MNTB cell size was reduced and medial-lateral cell size gradient development delayed in Fmr1 KO mice. A–C, Cell area in wild-type and Fmr1 KO MNTB at P1, P6, and P14. D–F, Cells in the Fmr1 KO medial and lateral MNTB were smaller than those found in wild-type mice at P1, P6, and P14. In P1 and P6 wild-type mice, medial MNTB cells were significantly smaller than lateral MNTB cells, but in Fmr1 KO mice, this difference was not observed. By P14, both genotypes showed significantly smaller cell size in medial MNTB compared to lateral MNTB. Scale bar in A = 100 μm; applies to A–C. *, p < 0.05; **, p < 0.01; and ***, p < 0.001.
- Figure 4.
LSO cell size in wild-type and Fmr1 KO mice. A, Fluorescent Nissl stain in LSO in wild-type mice (top) and Fmr1 KO mice (bottom) at P1, P6, and P14. Scale bar = 100 μm. B, Fmr1 KO cell size was significantly smaller than those in wild-type mice at all ages tested. *, p < 0.05; **, p < 0.01; and ***, p < 0.001.
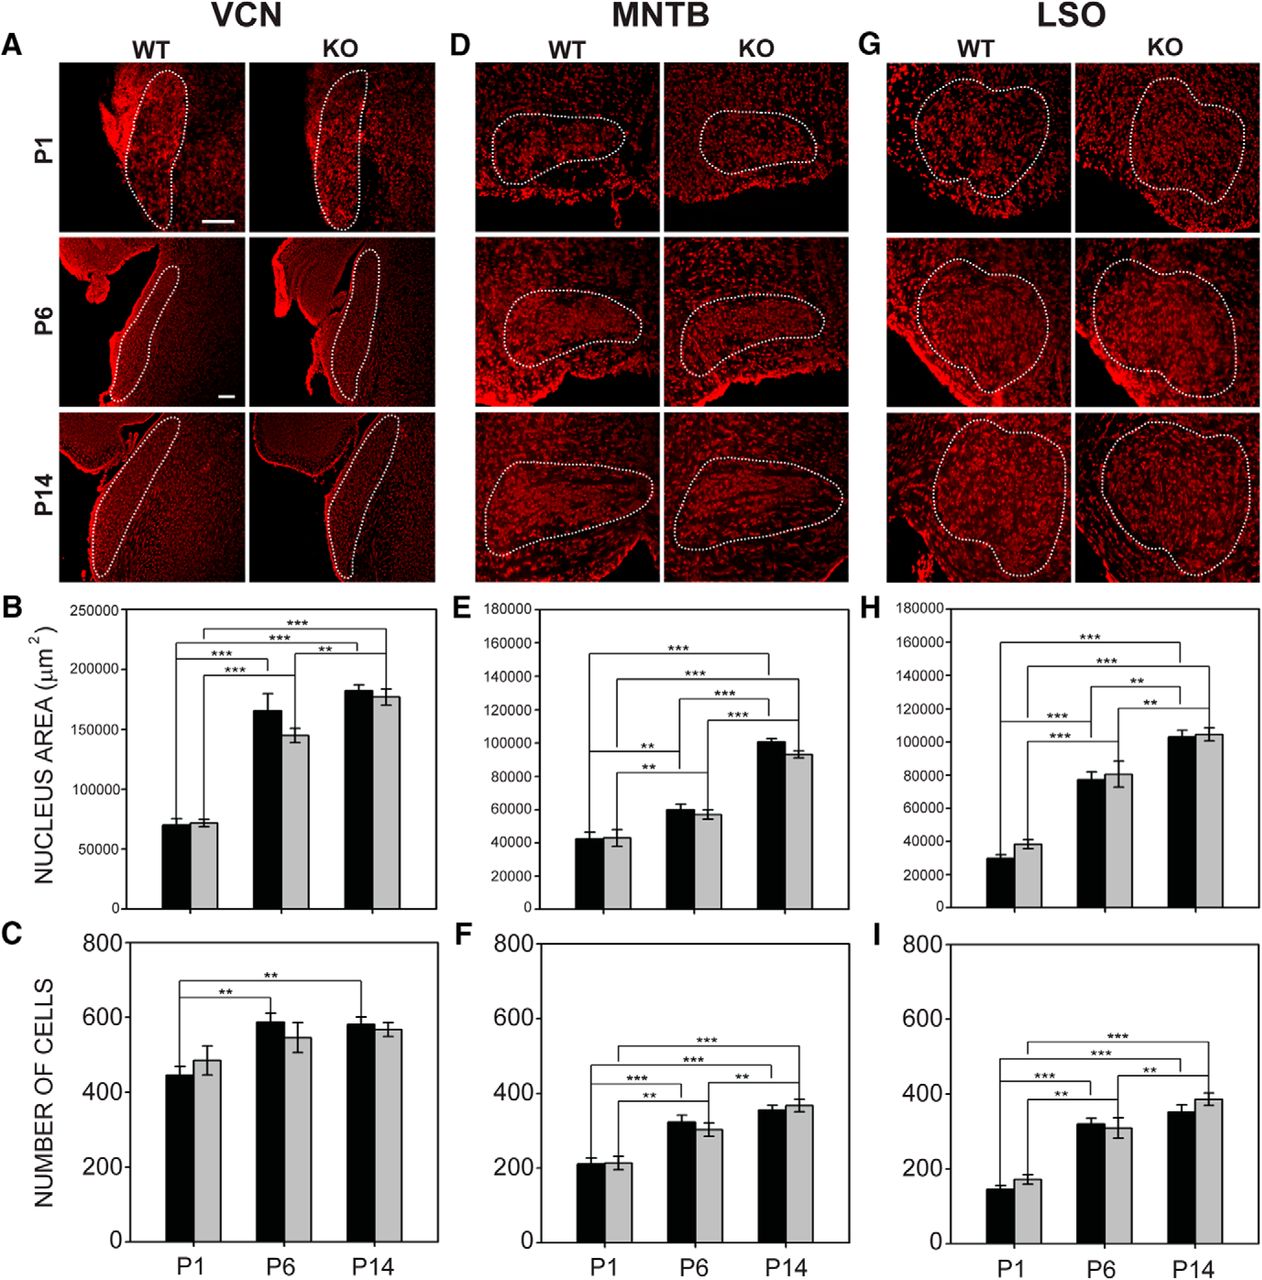
- Figure 5.
Nucleus growth and cell acquisition in wild-type and Fmr1 KO mice. A, Outlines of VCN in coronal sections at P1, P6, and P14. Medial is to the right. B, In VCN, both wild-type mice and Fmr1 KO mice show age-related increases in nucleus area. C, The number of cells in the wild-type VCN increased with age. Increases in cell number in Fmr1 KO mice did not reach significance. D, Outlines of MNTB in wild-type and Fmr1 KO mice at P1, P6, and P14. E, In MNTB, wild-type and Fmr1 KO mice both showed significant increases in nucleus size at all ages tested. F, Both wild-type mice and Fmr1 KO mice showed age-dependent increases in cell number in MNTB. G, Outlines of LSO in wild-type and Fmr1 KO mice at P1, P6, and P14. H, LSO grew in size at each age in both wild-type and Fmr1 KO mice. I, The number of cells in LSO in both wild-type mice and Fmr1 KO mice increased significantly with age. Top row in A: 100-μm scale bar applies to P1 images (20× magnification). Second row in A: 100-μm scale bar applies to for P6 and P14 images (10× magnification). *, p < 0.05; **, p < 0.01; and ***, p < 0.001.
- Figure 6.
VGLUT, VGAT, and synaptophysin expression in VCN. A, B, VGLUT and VGAT immunofluorescence in VCN in wild-type (top) and Fmr1 KO (bottom) mice at P6 (A) and P14 (B). C, Synaptophysin expression in VCN in wild-type (top) and Fmr1 KO (bottom) mice at P6 (left) and P14 (right). D, In VCN in both wild-type and Fmr1 KO mice, VGLUT fractional coverage was reduced at P14 compared to P6, but did not vary between genotypes. E, VGAT fractional coverage decreased significantly from P6 to P14 in Fmr1 KO mice. F, Synaptophysin fractional coverage did not differ with age or genotype. G, VGLUT relative to VGAT expression (ISP) did not differ significantly between genotypes, but ISP values decreased significantly from P6 to P14. Scale bar in A = 50 μm; applies to A–C. *, p < 0.05; **, p < 0.01; and ***, p < 0.001.
- Figure 7.
VGLUT, VGAT, and synaptophysin expression in MNTB. A, B, VGLUT and VGAT expression in wild-type and Fmr1 KO MNTB at P6 (A) and P14 (B). C, Synaptophysin expression in MNTB in wild-type (top) and Fmr1 KO (bottom) mice. D, VGLUT fractional coverage did not vary between genotypes or ages. E, VGAT fractional coverage was significantly greater in Fmr1 KO MNTB at both P6 and P14. F, Synaptophysin coverage did not differ significantly by age or by genotype. G, ISP values were significantly smaller in Fmr1 KO mice at both P6 and P14. Scale bar in A = 50 μm; applies to A–C. *, p < 0.05; **, p < 0.01; and ***, p < 0.001.
- Figure 8.
VGLUT, VGAT, and synaptophysin expression in LSO. A, B, Expression of VGLUT (left) and VGAT (right) at P6 and P14 in LSO. C, Synaptophysin expression at P6 and P14 in wild-type and mutant mice. D, In both wild-type and Fmr1 KO LSO, VGLUT expression decreased with age but did not differ between genotypes. E, VGAT fractional coverage increased between P6 and P14 in both genotypes but did not differ between genotypes. F, Synaptophysin fractional coverage was significantly greater in Fmr1 KO mice at both ages tested and did not change significantly between these ages. G, ISP values decreased significantly between P6 and P14. ISP was significantly smaller in Fmr1 KO mice than in wild-type mice at P14. Scale bar in A = 50 μm; applies to A–C. *, p < 0.05; **, p < 0.01; and ***, p < 0.001.
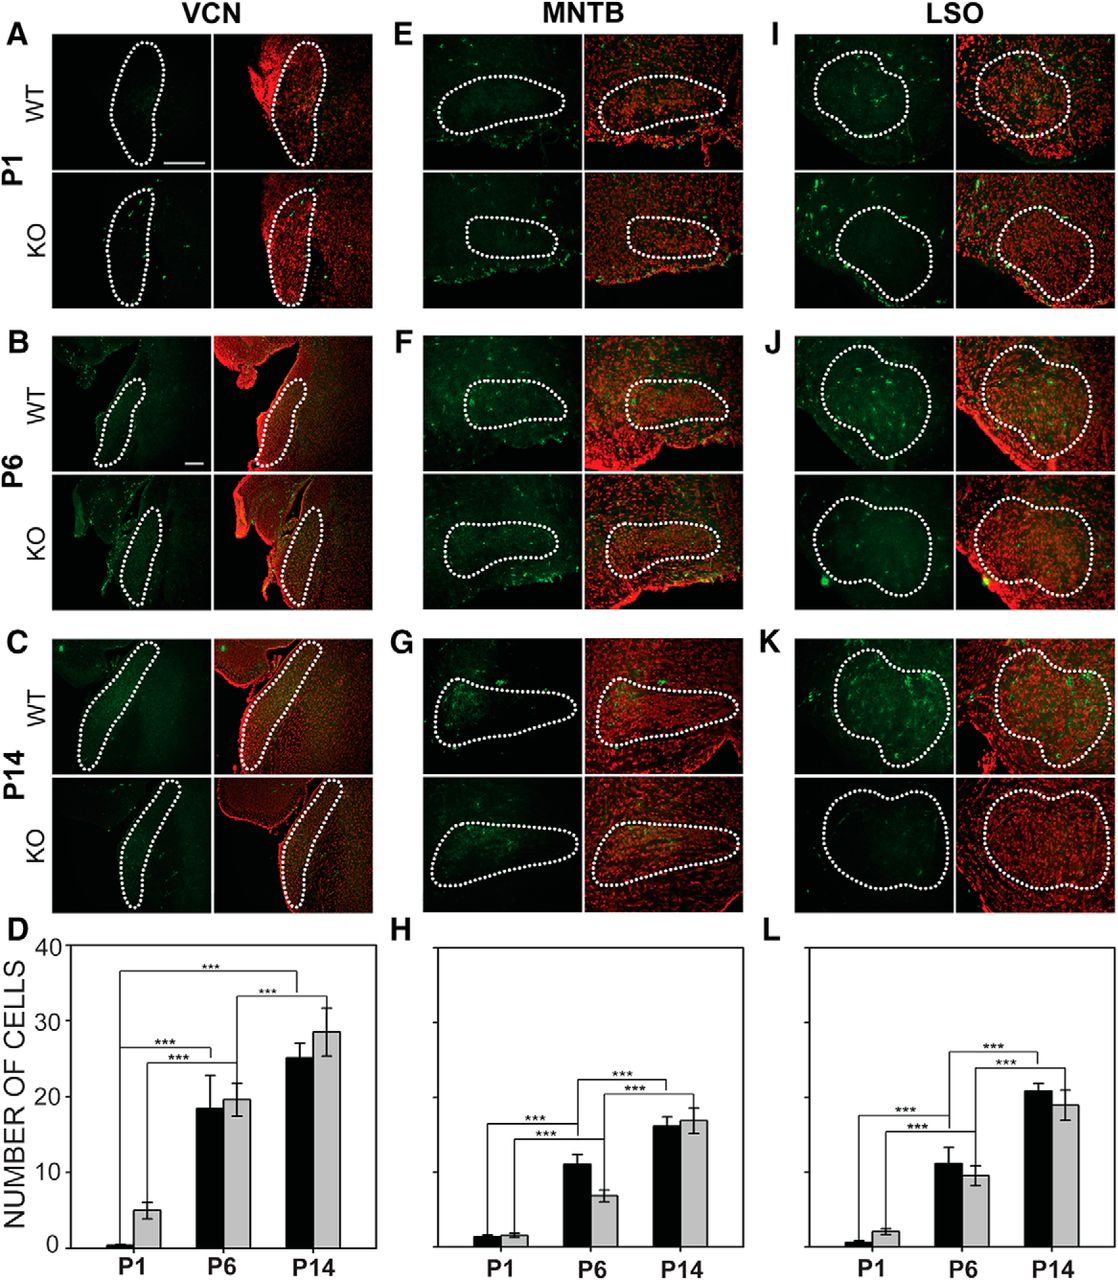
- Figure 9.
Emergence of microglia in the auditory brainstem nuclei in wild-type and Fmr1 KO mice. A–C, Increase in microglial population was studied in the VCN at P1, P6, and P14. Left column, Iba1 immunofluorescence in green; right column, Iba1 together with fluorescent Nissl. Nucleus outline is shown in dashed lines. D, The number of microglia in VCN increased with age in both wild-type and Fmr1 KO mice, but no difference was seen between the genotypes. E–G, Emergence of microglia was evaluated in MNTB using Iba1 immunofluorescence (left) together with Nissl (right). H, Wild type and Fmr1 KO mice both showed significant increases in the number of microglia present in MNTB each age tested, but no significant differences were found between genotypes. I–K, Emergence of microglia in LSO during development. L, The number of microglia expressed steadily increased at each age tested in both wild-type and Fmr1 KO mice. As for VCN and MNTB, no difference in numbers of microglia were seen between the genotypes. Scale bar in A = 100 μm, applies to A, E, and I. Scale bar in B = 10 0μm, applies to B, C, F, G, and J–K. *, p < 0.05; **, p < 0.01; and ***, p < 0.001.
- Figure 10.
Emergence of astrocytes in the wild-type and Fmr1 KO auditory brainstem. A, The number of astrocytes in the VCN was evaluated at P6 and P14 using ALDH1L1 immunofluorescence. B, Numbers of ALDH1L1-positive astrocytes in VCN increased between P6 and P14 in both genotypes. At P14, there were significantly more astrocytes in VCN in Fmr1 KO mice than in wild-type mice. C, Astrocytes labeled in MNTB at P6 and P14. D, Astrocyte numbers increased significantly in MNTB in both wild-type and Fmr1 KO mice, but no difference were seen between the genotypes. E, ALDH1L1 immunolabeled astrocytes in LSO. F, Astrocytes increased in number between P6 and P14 in both genotypes, and significantly more astrocytes were present in the Fmr1 KO LSO at P14. Scale bar in A = 100 μm; scale bar in C = 100 μm, applies to C and E. *, p < 0.05; **, p < 0.01; and ***, p < 0.001.


Tables
Figure Test Sample size (n) Test statistics p Power α = 0.050 1B Two-way ANOVA WT: P1 = 5, P6 = 8, P14 = 15; KO: P1 = 5, P6 = 10, P14 = 16 Age F = 74.469; genotype F = 2.714; age × genotype F = 1.251 Age p < 0.001; genotype p = 0.105; age × genotype p = 0.294 Age α = 1.000; genotype α = 0.236; age × genotype α = 0.085 2B Two-way ANOVA WT: P1 = 7, P6 = 8, P14 = 10; KO: P1 = 5, P6 = 9, P14 = 10 Age F = 234.948; genotype F = 56.277; age × genotype F = 3.471 Age p < 0.001; genotype p < 0.001; age × genotype p = 0.040 Age α = 1.000; genotype α = 1.000; age × genotype α = 0.460 3D Two-way ANOVA WT: P1 = 5, P6 = 8, P14 = 15; KO: P1 = 5, P6 = 10, P14 = 16 Location F = 10.762; genotype F = 240.432; location × genotype F = 11.572 Location p < 0.001; genotype p < 0.001; location × genotype p = 0.040 Location α = 0.859; genotype α = 1.000; location × genotype α = 0.887 3E Two-way ANOVA WT: P1 = 5, P6 = 8, P14 = 15; KO: P1 = 5, P6 = 10, P14 = 16 Location F = 14.142; genotype F = 39.594; location × genotype F = 5.922 Location p < 0.001; genotype p < 0.001; location × genotype p = 0.020 Location α = 0.958; genotype α = 1.000; location × genotype α = 0.577 3F Two-way ANOVA WT: P1 = 5, P6 = 8, P14 = 15; KO: P1 = 5, P6 = 10, P14 = 16 Location F = 144.012; genotype F = 36.820; location × genotype F = 1.056 Location p < 0.001; genotype p < 0.001; location × genotype p = 0.308 Location α = 1.000; genotype α = 1.000; location × genotype α = 0.053 4B Two-way ANOVA WT: P1 = 7, P6 = 8, P14 = 10; KO: P1 = 5, P6 = 9, P14 = 10 Age F = 30.240; genotype F = 48.714; age × genotype F = 2.404 Age p < 0.001; genotype p < 0.001; age × genotype p = 0.100 Age α = 1.000; genotype α = 1.000; age × genotype α = 0.278 5B Two-way ANOVA WT: P1 = 5, P6 = 8, P14 = 15; KO: P1 = 5, P6 = 10, P14 = 16 Age F = 74.602; genotype F = 1.300; age × genotype F = 0.839 Age p < 0.001; genotype p = 0.259; age × genotype p = 0.438 Age α = 1.000; genotype α = 0.0789; age × genotype α = 0.050 5C Two-way ANOVA WT: P1 = 5, P6 = 8, P14 = 15; KO: P1 = 5, P6 = 10, P14 = 16 Age F = 6.544; genotype F = 0.049; age × genotype F = 0.730 Age p = 0.003; genotype p = 0.824; age × genotype p = 0.487 Age α = 0.844; genotype α = 0.050; age × genotype α = 0.050 5E Two-way ANOVA WT: P1 = 5, P6 = 8, P14 = 15; KO: P1 = 5, P6 = 10, P14 = 16 Age F = 188.708; genotype F = 1.683; age × genotype F = 0.860 Age p < 0.001; genotype p = 0.200; age × genotype p = 0.428 Age α = 1.000; genotype α = 0.120; age × genotype α = 0.050 5F Two-way ANOVA WT: P1 = 5, P6 = 8, P14 = 15; KO: P1 = 5, P6 = 10, P14 = 16 Age F = 28.024; genotype F = 0.009; age × genotype F = 0.473 Age p < 0.001; genotype p = 0.925; age × genotype p = 0.626 Age α = 1.000; genotype α = 0.050; age × genotype α = 0.050 5H Two-way ANOVA WT: P1 = 5, P6 = 8, P14 = 15; KO: P1 = 5, P6 = 10, P14 = 16 Age F = 60.344; genotype F = 0.792; age × genotype F = 0.155 Age p < 0.001; genotype p = 0.377; age × genotype p = 0.857 Age α = 1.000; genotype α = 0.050; age × genotype α = 0.050 5I Two-way ANOVA WT: P1 = 5, P6 = 8, P14 = 15; KO: P1 = 5, P6 = 10, P14 = 16 Age F = 35.620; genotype F = 0.724; age × genotype F = 0.620 Age p < 0.001; genotype p = 0.398; age × genotype p = 0.541 Age α = 1.000; genotype α = 0.050; age × genotype α = 0.050 6D Two-way ANOVA WT: P6 = 7, P14 = 10; KO:P6 = 13, P14 = 16 Age F = 30.666; genotype F = 0.009; age × genotype F = 0.002 Age p < 0.001; genotype p = 0.926; age × genotype p = 0.967 Age α = 1.000; genotype α = 0.050; age × genotype α = 0.050 6E Two-way ANOVA WT: P6 = 7, P14 = 10; KO: P6 = 13, P14 = 16 Age F = 10.846; genotype F = 0.098; age × genotype F = 0.078 Age p = 0.002; genotype p = 0.756; age × genotype p = 0.782 Age α = 0.883; genotype α = 0.050; age × genotype α = 0.050 6F Two-way ANOVA WT: P6 = 7, P14 = 10; KO: P6 = 13, P14 = 16 Age F = 1.350; genotype F = 3.178; age × genotype F = 0.008 Age p = 0.255; genotype p = 0.085; age × genotype p = 0.927 Age α = 0.083; genotype α = 0.282; age × genotype α = 0.050 6G Two-way ANOVA WT: P6 = 7, P14 = 10; KO: P6 = 13, P14 = 16 Age F = 15.330; genotype F = 0.195; age × genotype F = 0.094 Age p < 0.001; genotype p = 0.661; age × genotype p = 0.760 Age α = 0.972; genotype α = 0.050; age × genotype α = 0.050 7D Two-way ANOVA WT: P6 = 8, P14 = 10; KO: P6 = 13, P14 = 16 Age F = 0.283; genotype F = 0.417; age × genotype F = 1.336 Age p = 0.600; genotype p = 0.525; age × genotype p = 0.260 Age α = 0.050; genotype α = 0.050; age × genotype α = 0.081 7E Two-way ANOVA WT: P6 = 8, P14 = 10; KO: P6 = 13, P14 = 16 Age F = 0.804; genotype F = 66.730; age × genotype F = 0.017 Age p = 0.379; genotype p < 0.001; age × genotype p = 0.896 Age α = 0.050; genotype α = 1.000; age × genotype α = 0.050 7F Two-way ANOVA WT: P6 = 8, P14 = 10; KO:P6 = 13, P14 = 16 Age F = 1.785; genotype F = 4.347; age × genotype F = 0.037 Age p = 0.194; genotype p = 0.047; age × genotype p = 0.849 Age α = 0.128; genotype α = 0.408; age × genotype α = 0.050 7G Two-way ANOVA WT: P6 = 8, P14 = 10; KO: P6 = 13, P14 = 16 Age F = 1.291; genotype F = 23.979; age × genotype F = 0.719 Age p = 0.268; genotype p < 0.001; age × genotype p = 0.406 Age α = 0.077; genotype α = 0.998; age × genotype α = 0.050 8D Two-way ANOVA WT: P6 = 8, P14 = 10; KO: P6 = 13, P14 = 16 Age F = 16.857; genotype F = 0.210; age × genotype F = 0.169 Age p < 0.001; genotype p = 0.649; age × genotype p = 0.683 Age α = 0.984; genotype α = 0.050; age × genotype α = 0.050 8E Two-way ANOVA WT: P6 = 8, P14 = 10; KO: P6 = 13, P14 = 16 Age F = 13.242; genotype F = 0.991; age × genotype F = 0.078 Age p < 0.001; genotype p = 0.325; age × genotype p = 0.782 Age α = 0.944; genotype α = 0.050; age × genotype α = 0.050 8F Two-way ANOVA WT: P6 = 8, P14 = 10; KO: P6 = 13, P14 = 16 Age F = 5.388; genotype F = 40.622; age × genotype F = 0.008 Age p < 0.001; genotype p = 0.027; age × genotype p = 0.929 Age α = 1.000; genotype α = 0.519; age × genotype α = 0.050 8G Two-way ANOVA WT: P6 = 8, P14 = 10; KO: P6 = 13, P14 = 16 Age F = 62.677; genotype F = 4.302; age × genotype F = 1.233 Age p < 0.001; genotype p = 0.044; age × genotype p = 0.273 Age α = 1.000; genotype α = 0.414; age × genotype α = 0.072 9D Two-way ANOVA WT: P1 = 7, P6 = 8, P14 = 15; KO: P1 = 5, P6 = 14, P14 = 16 Age F = 24.955; genotype F = 1.250; age × genotype F = 0.125 Age p < 0.001; genotype p = 0.269; age × genotype p = 0.882 Age α = 1.000; genotype α = 0.074; age × genotype α = 0.050 9H Two-way ANOVA WT: P1 = 7, P6 = 8, P14 = 15; KO: P1 = 5, P6 = 14, P14 = 16 Age F = 52.928; genotype F = 0.219; age × genotype F = 0.428 Age p < 0.001; genotype p = 0.642; age × genotype p = 0.654 Age α = 1.000; genotype α = 0.050; age × genotype α = 0.050 9L Two-way ANOVA WT: P1 = 7, P6 = 8, P14 = 15; KO: P1 = 5, P6 = 14, P14 = 16 Age F = 50.641; genotype F = 0.783; age × genotype F = 1.917 Age p < 0.001; genotype p = 0.380; age × genotype p = 0.156 Age α = 1.000; genotype α = 0.050; age × genotype α = 0.193 10B Two-way ANOVA WT: P6 = 8, P14 = 13; KO: P6 = 10, P14 = 11 Age F = 21.766; genotype F = 5.393; age × genotype F = 1.687 Age p < 0.001; genotype p = 0.026; age × genotype p = 0.203 Age α = 0.997; genotype α = 0.524; age × genotype α = 0.119 10D Two-way ANOVA WT: P6 = 8, P14 = 13; KO: P6 = 10, P14 = 11 Age F = 19.654; genotype F = 1.462; age × genotype F = 0.256 Age p < 0.001; genotype p = 0.234; age × genotype p = 0.616 Age α = 0.994; genotype α = 0.095; age × genotype α = 0.050 10F Two-way ANOVA WT: P6 = 8, P14 = 13; KO: P6 = 10, P14 = 11 Age F = 27.231; genotype F = 5.368; age × genotype F = 2.468 Age p < 0.001; genotype p = 0.026; age × genotype p = 0.125 Age α = 1.000; genotype α = 0.523; age × genotype α = 0.205 Source MNTB cell size LSO cell size P6 wild type VCN cell size Pearson’s r = 0.014; p = 0.975; n = 8 Pearson’s r = 0.393; p = 0.335; n = 8 MNTB cell size — Pearson’s r = –0.375; p = 0.360; n = 8 P6 Fmr1 KO VCN cell size Pearson’s r = 0.675; p = 0.096; n = 7 Pearson’s r = –0.544; p = 0.068; n = 12 MNTB cell size — Pearson’s r = –0.785; p = 0.037; n = 7 P14 wild type VCN cell size Pearson’s r = –0.239; p = 0.507; n = 10 Pearson’s r = 0.655; p = 0.008; n = 15 MNTB cell size — Pearson’s r = 0.440; p = 0.203; n = 10 P14 Fmr1 KO VCN cell size Pearson’s r = –0.176; p = 0.650; n = 9 Pearson’s r = 0.772; p = 0.0012; n = 14 MNTB cell size — Pearson’s r = 0.048; p = 0.902; n = 9 - Table 3.
Correlations between Iba1 expression levels and expression of each synaptic protein
Comparison, age, and genotype Nucleus Correlation coefficient and statistics Iba1 vs. VGLUT P6 Wild type VCN Pearson’s r = 0.781; p = 0.038; n = 7 Wild type MNTB Pearson’s r = 0.818; p = 0.013; n = 8 Wild type LSO Pearson’s r = 0.664; p = 0.073; n = 8 Fmr1 KO VCN Pearson’s r = 0.386; p = 0.271; n = 10 Fmr1 KO MNTB Pearson’s r = 0.793; p = 0.001; n = 13 Fmr1 KO LSO Pearson’s r = 0.305; p = 0.310; n = 13 P14 Wild type VCN Pearson’s r = –0.179; p = 0.620; n = 10 Wild type MNTB Pearson’s r = 0.493; p = 0.148; n = 10 Wild type LSO Pearson’s r = –0.036; p = 0.921; n = 10 Fmr1 KO VCN Pearson’s r = 0.176; p = 0.515; n = 16 Fmr1 KO MNTB Pearson’s r = –0.039; p = 0.887; n = 16 Fmr1 KO LSO Pearson’s r = –0.392; p = 0.133; n = 16 Iba1 vs. VGAT P6 Wild type VCN Pearson’s r = 0.119; p = 0.799; n = 7 Wild type MNTB Pearson’s r = 0.737; p = 0.037; n = 8 Wild type LSO Pearson’s r = 0.236; p = 0.574; n = 8 Fmr1 KO VCN Pearson’s r = 0.0006; p = 0.999; n = 10 Fmr1 KO MNTB Pearson’s r = 0.695; p = 0.008; n = 13 Fmr1 KO LSO Pearson’s r = 0.130; p = 0.673; n = 13 P14 Wild type VCN Pearson’s r = 0.097; p = 0.789; n = 10 Wild type MNTB Pearson’s r = 0.149; p = 0.682; n = 10 Wild type LSO Pearson’s r = –0.292; p = 0.412; n = 10 Fmr1 KO VCN Pearson’s r = 0.165; p = 0.541; n = 16 Fmr1 KO MNTB Pearson’s r = –0.345; p = 0.190; n = 16 Fmr1 KO LSO Pearson’s r = –0.401; p = 0.124; n = 16 Iba1 vs. Synaptophysin P6 Wild type VCN Pearson’s r = 0.422; p = 0.346; n = 7 Wild type MNTB Pearson’s r = 0.006; p = 0.989; n = 7 Wild type LSO Pearson’s r = 0.605; p = 0.150; n = 7 Fmr1 KO VCN Pearson’s r = 0.281; p = 0.500; n = 8 Fmr1 KO MNTB Pearson’s r = 0.231; p = 0.582; n = 8 Fmr1 KO LSO Pearson’s r = 0.203; p = 0.629; n = 8 P14 Wild type VCN Pearson’s r = –0.115; p = 0.751; n = 10 Wild type MNTB Pearson’s r = 0.346; p = 0.328; n = 10 Wild type LSO Pearson’s r = 0.151; p = 0.676; n = 10 Fmr1 KO VCN Pearson’s r = 0.565; p = 0.113; n = 9 Fmr1 KO MNTB Pearson’s r = –0.057; p = 0.884; n = 9 Fmr1 KO LSO Pearson’s r = –0.729; p = 0.026; n = 9 Comparison, age, and genotype Nucleus Correlation coefficient and statistics ALDH1L1 vs. VGLUT P6 Wild type VCN Pearson’s r = 0.056; p = 0.906; n = 7 Wild type MNTB Pearson’s r = 0.476; p = 0.281; n = 7 Wild type LSO Pearson’s r = 0.141; p = 0.763; n = 7 Fmr1 KO VCN Pearson’s r = 0.248; p = 0.489; n = 10 Fmr1 KO MNTB Pearson’s r = 0.207; p = 0.566; n = 10 Fmr1 KO LSO Pearson’s r = 0.330; p = 0.351; n = 10 P14 Wild type VCN Pearson’s r = 0.450; p = 0.225; n = 9 Wild type MNTB Pearson’s r = 0.263; p = 0.462; n = 10 Wild type LSO Pearson’s r = –0.238; p = 0.508; n = 10 Fmr1 KO VCN Pearson’s r = –0.507; p = 0.135; n = 10 Fmr1 KO MNTB Pearson’s r = –0.675; p = 0.023; n = 11 Fmr1 KO LSO Pearson’s r = 0.912; p = 0.00009; n = 11 ALDH1L1 vs. VGAT P6 Wild type VCN Pearson’s r = –0.775; p = 0.041; n = 7 Wild type MNTB Pearson’s r = 0.274; p = 0.553; n = 7 Wild type LSO Pearson’s r = 0.057; p = 0.903; n = 7 Fmr1 KO VCN Pearson’s r = 0.028; p = 0.939; n = 10 Fmr1 KO MNTB Pearson’s r = 0.449; p = 0.193; n = 10 Fmr1 KO LSO Pearson’s r = –0.211; p = 0.559; n = 10 P14 Wild type VCN Pearson’s r = 0.407; p = 0.277; n = 9 Wild type MNTB Pearson’s r = 0.099; p = 0.785; n = 10 Wild type LSO Pearson’s r = –0.436; p = 0.208; n = 10 Fmr1 KO VCN Pearson’s r = –0.721; p = 0.019; n = 10 Fmr1 KO MNTB Pearson’s r = 0.747; p = 0.008; n = 11 Fmr1 KO LSO Pearson’s r = 0.895; p = 0.0002; n = 11 ALDH1L1 vs. Synaptophysin P6 Wild type VCN Pearson’s r = –0.434; p = 0.331; n = 7 Wild type MNTB Pearson’s r = 0.155; p = 0.740; n = 7 Wild type LSO Pearson’s r = 0.550; p = 0.201; n = 7 Fmr1 KO VCN Pearson’s r = 0.376; p = 0.359; n = 8 Fmr1 KO MNTB Pearson’s r = 0.370; p = 0.367; n = 8 Fmr1 KO LSO Pearson’s r = –0.398; p = 0.329; n = 8 P14 Wild type VCN Pearson’s r = –0.126; p = 0.747; n = 9 Wild type MNTB Pearson’s r = 0.807; p = 0.005; n = 10 Wild type LSO Pearson’s r = 0.136; p = 0.707; n = 10 Fmr1 KO VCN Pearson’s r = –0.077; p = 0.857; n = 8 Fmr1 KO MNTB Pearson’s r = –0.301; p = 0.431; n = 9 Fmr1 KO LSO Pearson’s r = –0.036; p = 0.926; n = 9 P14 VCN MNTB LSO Nucleus size Sex: F1,27 = 0.546, p = 0.466; genotype: F1,27 = 0.248, p = 0.623; interaction: F1,27 = 0.289, p = 0.595 Sex: F1,27 = 0.108, p = 0.745; genotype: F1,27 = 5.877, p = 0.022; interaction: F1,27 = 0.024, p = 0.878 Sex: F1,27 = 0.669, p = 0.421; genotype: F1,27 = 0.022, p = 0.884; interaction: F1,27 = 3.438, p = 0.075 Number of cells Sex: F1,27 = 0.459, p = 0.504; genotype: F1,27 = 0.174, p = 0.680; interaction: F1,27 = 0.998, p = 0.327 Sex: F1,27 = 0.032, p = 0.860; genotype: F1,27 = 0.298, p = 0.590; interaction: F1,27 = 0.740, p = 0.397 Sex: F1,27 = 0.004, p = 0.947; genotype: F1,27 = 1.698, p = 0.204; interaction: F1,27 = 3.140, p = 0.088 Cell size Sex: F1,26 = 1.106, p = 0.303; genotype: F1,26 = 2.796, p = 0.107; interaction: F1,26 = 0.086, p = 0.771 Sex: F1,16 = 0.225, p = 0.642; genotype: F1,16 = 21.198, p < 0.001; interaction: F1,16 = 3.111, p = 0.097 Sex: F1,26 = 0.009, p = 0.925; genotype: F1,26 = 14.746, p < 0.001; interaction: F1,26 = 0.392, p = 0.537 VGLUT Sex: F1,22 = 4.253, p = 0.051; genotype: F1,22 = 0.049, p = 0.828; interaction: F1,22 = 0.108, p = 0.746 Sex: F1,6 = 1.265, p = 0.304; genotype: F1,6 = 3.258, p = 0.121; interaction: F1,6 = 5.738, p = 0.054 Sex: F1,22 = 0.789, p = 0.384; genotype: F1,22 = 0.009, p = 0.927; interaction: F1,22 = 0.268, p = 0.610 VGAT Sex: F1,22 = 2.066, p = 0.165; genotype: F1,22 = 0.488, p = 0.492; interaction: F1,22 = 0.591, p = 0.450 Sex: F1,6 = 0.196, p = 0.674; genotype: F1,6 = 16.028, p = 0.007; interaction: F1,6 = 1.159, p = 0.323 Sex: F1,22 = 1.510, p = 0.232; genotype: F1,22 = 0.551, p = 0.466; interaction: F1,22 = 0.962, p = 0.337 ISP Sex: F1,22 = 1.187, p = 0.288; genotype: F1,22 = 0.404, p = 0.531; interaction: F1,22 = 2.715, p = 0.114 Sex: F1,6 = 0.099, p = 0.764; genotype: F1,6 = 6.793, p = 0.040; interaction: F1,6 = 4.950, p = 0.068 Sex: F1,22 = 0.646, p = 0.430; genotype: F1,22 = 4.515, p = 0.055; interaction: F1,22 = 0.668, p = 0.422 Synaptophysin Sex: F1,16 = 1.165, p = 0.296; genotype: F1,16 = 1.537, p = 0.233; interaction: F1,16 = 1.072, p = 0.316 Sex: F1,6 = 0.224, p = 0.653; genotype: F1,6 = 2.765, p = 0.147; interaction: F1,6 = 0.910, p = 0.377 Sex: F1,16 = 0.824, p = 0.377; genotype: F1,16 = 31.222, p < 0.001; interaction: F1,16 = 1.103, p = 0.309 IBA1 Sex: F1,27 = 1.589, p = 0.218; genotype: F1,27 = 1.192, p = 0.285; interaction: F1,27 = 2.381, p = 0.134 Sex: F1,27 = 0.268, p = 0.609; genotype: F1,27 = 0.569, p = 0.457; interaction: F1,27 = 0.125, p = 0.727 Sex: F1,27 = 0.094, p = 0.761; genotype: F1,27 = 0.075, p = 0.786; interaction: F1,27 = 1.556, p = 0.223 ALDH1L1 Sex: F1,18 = 0.109, p = 0.745; genotype: F1,18 = 4.855, p = 0.041; interaction: F1,18 = 3.020, p = 0.099 Sex: F1,20 = 0.215, p = 0.648; genotype: F1,20 = 1.025, p = 0.323; interaction: F1,20 = 0.149, p = 0.703 Sex: F1,20 = 0.495, p = 0.490; genotype: F1,20 = 4.130, p = 0.056; interaction: F1,20 = 2.392, p = 0.138
In this issue


