

Article Figures & Data
Figures
- Figure 1.
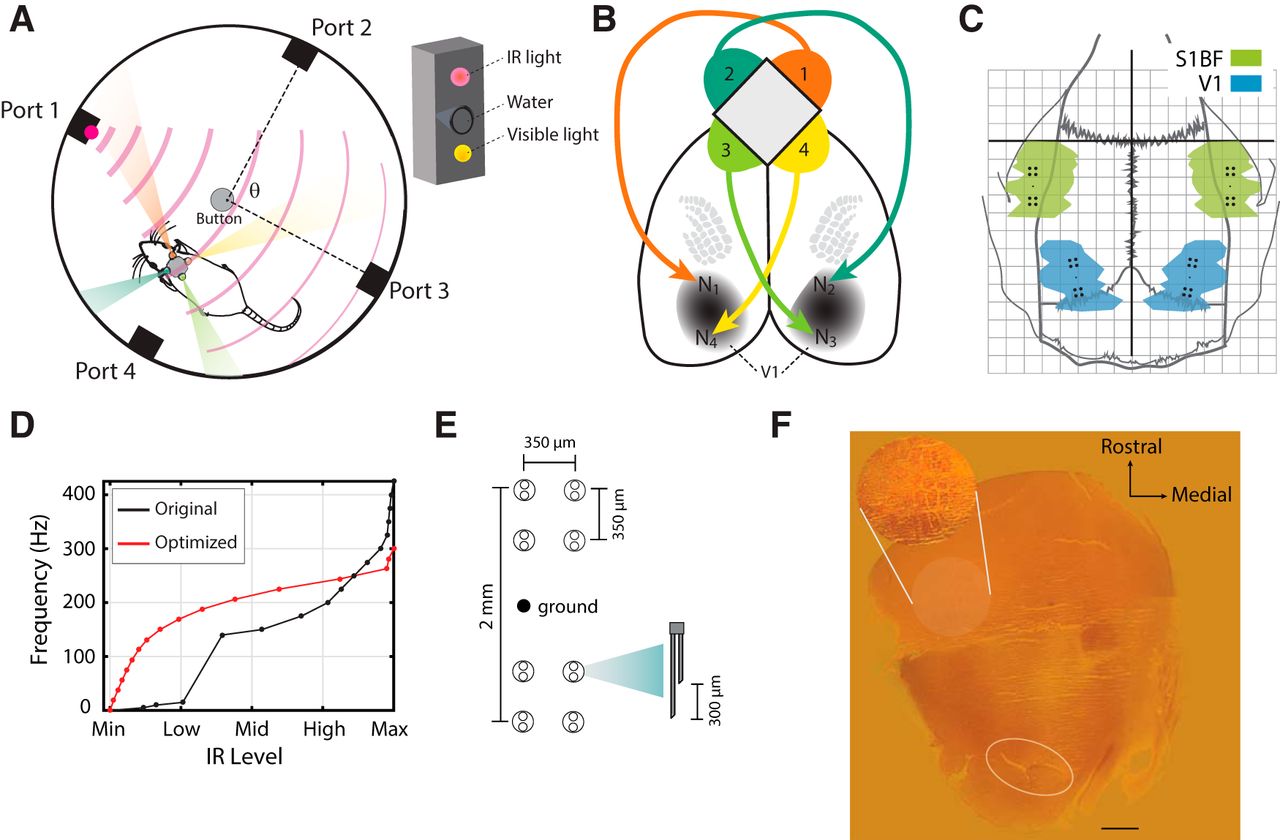
Methods. A, Setup of the IR behavior chamber. Four reward ports line the walls of the circular chamber. The angle θ indicates how far apart adjacent ports are. Inset shows design of each individual port. B, Illustration of the mapping from four IR detectors (1–4) to four microstimulating electrode locations (N1–N4) in V1. C, Dorsal view of rat skull showing the placement of the S1 and V1 stimulating electrode arrays. The green and blue zones correspond to the S1 barrel field (S1BF) and V1, respectively, and these areas were reconstructed from (Paxinos and Watson, 2007). The dark horizontal and vertical reference lines intersect at bregma, and each small square in the grid is 1 mm2. D, Transforms from IR levels detected in individual IR detectors to microstimulation frequency in individual stimulating channels. The black line is the original transform used in previous articles, and some animals in the present article. The red line shows the optimized transform (see Methods). E, Design of electrode arrays consisting of two bundles of eight stimulating electrodes placed 2 mm apart (see Methods for more details). F, Flattened cortical slice from animal implanted in V1, stained with cytochrome-oxidase. Inset shows detail of macrovibrissae barrels. Oval at bottom (caudal) shows the location of tissue damage from the V1 implant. Reference line: 1 mm.
- Figure 2.
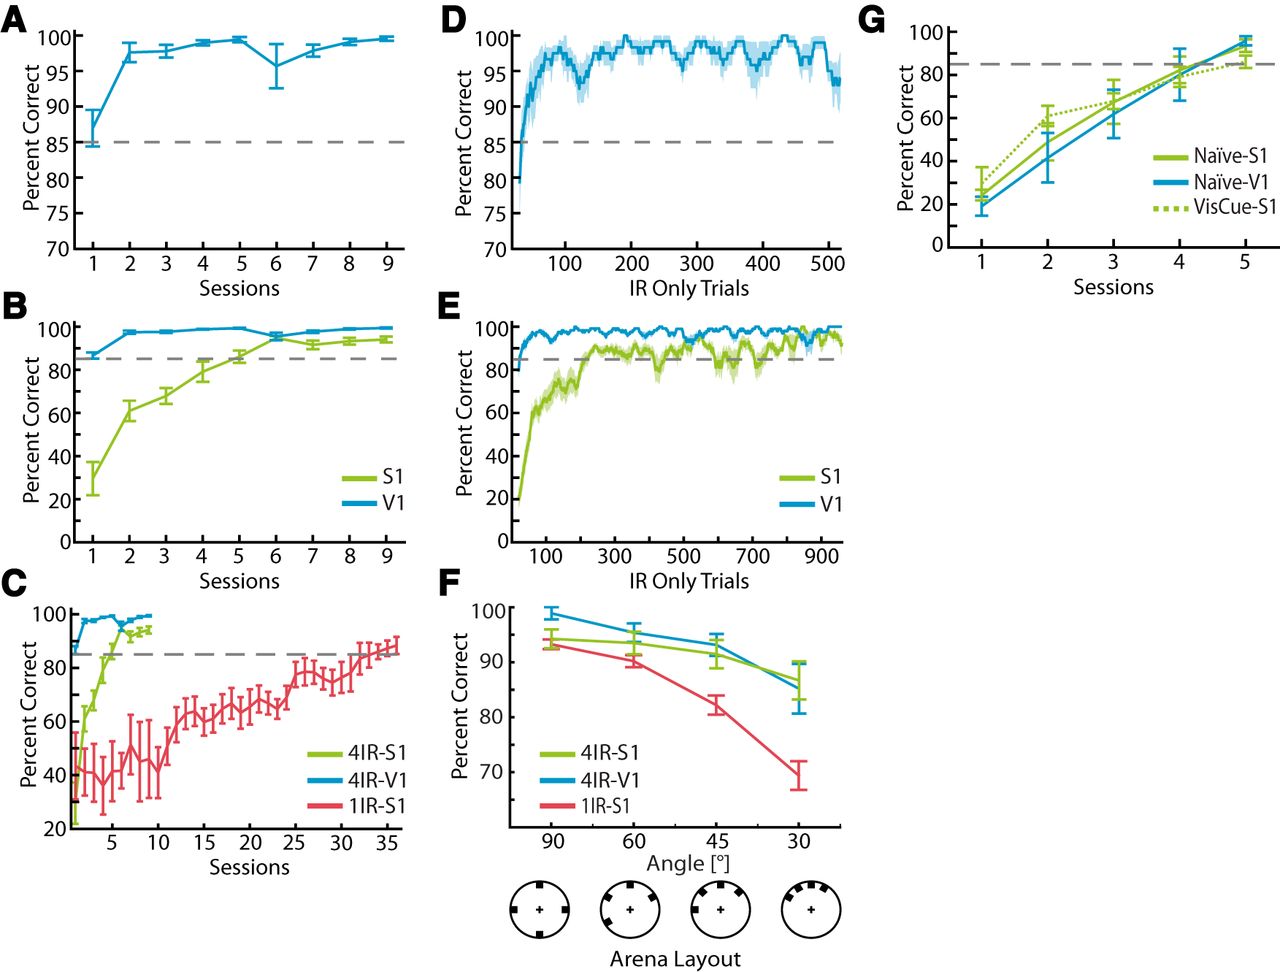
Discriminating IR light with visual cortex. A, Learning curve for IR-discrimination task using V1 (n = 6 animals). Note animals typically surpassed criterion (85% correct) within the first day. B, Direct comparison of learning curve for the same task with V1 implants (blue) and S1 implants (green; n = 15 for S1 implants). C, Same information as in B, but with learning curve superimposed when an animal has just a single IR sensor on its head (single-sensor learning data are from a previous study [Thomson et al. 2013]; n = 4 animals). D, Trial-based moving average analysis of performance in IR discrimination task. The curve shows percentage correct as a function of trial number (moving average of 20 trials) from same data shown in A. E, Same analysis as in C, but with S1-implanted animals shown in green for direct comparison. F, Performance in IR-discrimination task as a function of angle θ between the ports (see Fig. 1A). Includes data from V1 and S1 implanted animals with four IR sensors, as well as data from S1-implanted animals with a single IR sensor for comparison (blue, green, and red lines respectively with mean ± SEM percentage correct). G, Performance of naive V1- and S1-implanted animals (mean ± SEM percentage correct), that were not pretrained on a visual discrimination task (solid lines). Data from S1-implanted animals that were pretrained on a visual discrimination task are included for comparison. There is no significant difference, among any of the three groups, in the number of sessions it takes to reach 85% correct in the task (p > 0.05, two-tailed t test).
- Figure 3.
Neuronal responses to intracortical microstimulation in V1. A, Example of reduction of four-element full representation of electrical stimulation vector (four-element vector where each number represents frequency of microstimulation at a different location) down to two-dimensional population vector. There are five examples from five different time points T1–T5. B, Geometric representation of the population vectors from A. C, Stimulus population vectors from all trials in a session, with mean of first and last three substimuli overlaid in red. The black diamond outline is the convex hull of stimulus population vectors, showing the perimeter of the set of all possible vectors. Note that only a fraction of this set is actually presented in a given behavioral session. See text for more details. D, Neuronal data from four representative units. PSTHs show mean response to first three and last three microstimulation pulses, averaged over all trials in the session (note there are different axis limits for the different PSTHs). Associated with each PSTH is an IR-RF, a contour plot that shows the mean number of spikes in response to each stimulus population vector, with hot colors representing high firing rates. E, Distribution of all 240 IR-RF centers from all units recorded: note they tend to concentrate at the two medial corners of the stimulus space, although these are fairly rare events (C). F, Polar count histogram illustrates the medial, rather than anterior, concentration of IR-RF angular distribution. G, H, Same as E and F, but from data from S1 from a previous study (Hartmann et al. 2016). Note the anterior distribution of the IR-RF centers, much closer to the distribution of the stimuli.
- Figure 4.
Visual-IR integration task. A, Schematic of the task. In a cylindrical chamber with the same ports shown in Fig. 1A, four stimuli are randomly assigned to the ports. The target stimulus is the one with both visual and IR lights on. The IR distractor has only an IR light on, the visual distractor only a visual light, and there is one port with no light activated. B, Learning curve from three animals trained on the visual-IR integration task (implants in V1). The discontinuous right portion of the curve shows the last four sessions using an optimized frequency (see text). C, Comparison of learning curves between V1- and S1-implanted rats in the visual-IR integration task (n = 3 animals for each group). D, Same data as in C, but with trial-based moving average (moving window average taken with 20 trials).
- Figure 5.
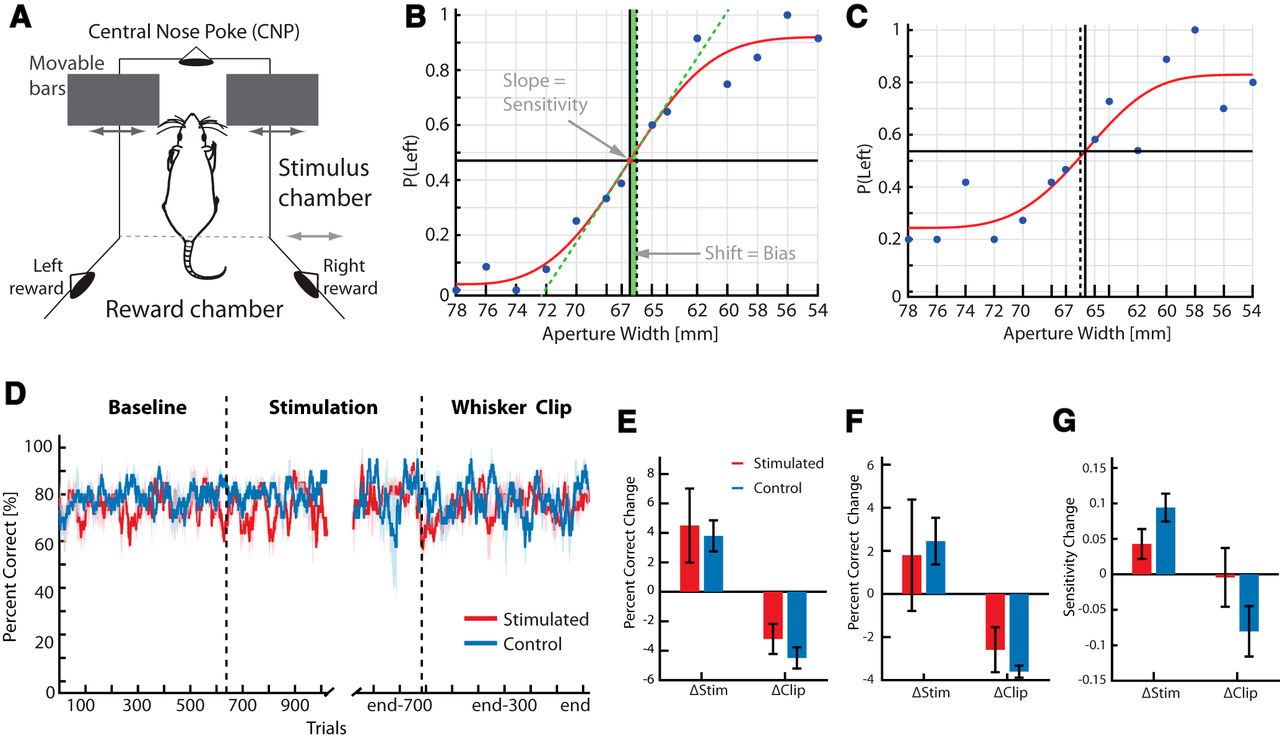
Effects of S1 prosthesis on whisker discrimination. A, Aperture-width discrimination task. After the movable bars making up aperture move to the desired position, the rat enters the stimulus chamber, sweeps its whiskers across the aperture (movable bars controlled by the computer), and activates the central nose poke (CNP). The animal then retreats into the stimulus chamber and pokes in the right or left reward port depending on the aperture width. B, Psychometric curve from a single session in the 14-width aperture-width discrimination task. The points are the mean proportion of left responses at each width; the red line is the best minimum least-squares fit to the points, fitted using a Weibull function. C, As in B, but in an animal with worse performance (lower maximum slope of the curve and lower peak performance at each end of the spectrum). D, Performance of stimulated and matched control animal in the whisker discrimination task during different stages of the experiment. Before stimulation (Baseline), while learning the IR discrimination task via ICMS (Stimulation), and after whiskers were clipped (Clipped). See text for details. E, Mean ± SEM change in performance after the two transitions illustrated in D. ΔStim, transition from baseline to stimulation; ΔClip, transition from normal stimulation to stimulation with whiskers clipped. This analysis is restricted only to 54/78-mm widths, and includes eight animals (four stimulated/four control for the Δstim transition) and seven animals (four stimulated/three control) for the Δclip transition (one control animal stopped performing the task after whisker clipping). F, Same as E, but for the full multiple-aperture with discrimination task (either 12 or 14 widths). This includes six animals for the first transition and five animals for the second (as before, one control animal stopped behaving after whisker clipping). Percentage correct is calculated as the integral under the best Weibull fit to the psychometric curve (see Methods). G, Change in behavioral sensitivity, or the measure of the maximum slope of the best fit curves to the psychometric data, with each transition in the task. Lower slope means less behavioral sensitivity.
- Figure 6.
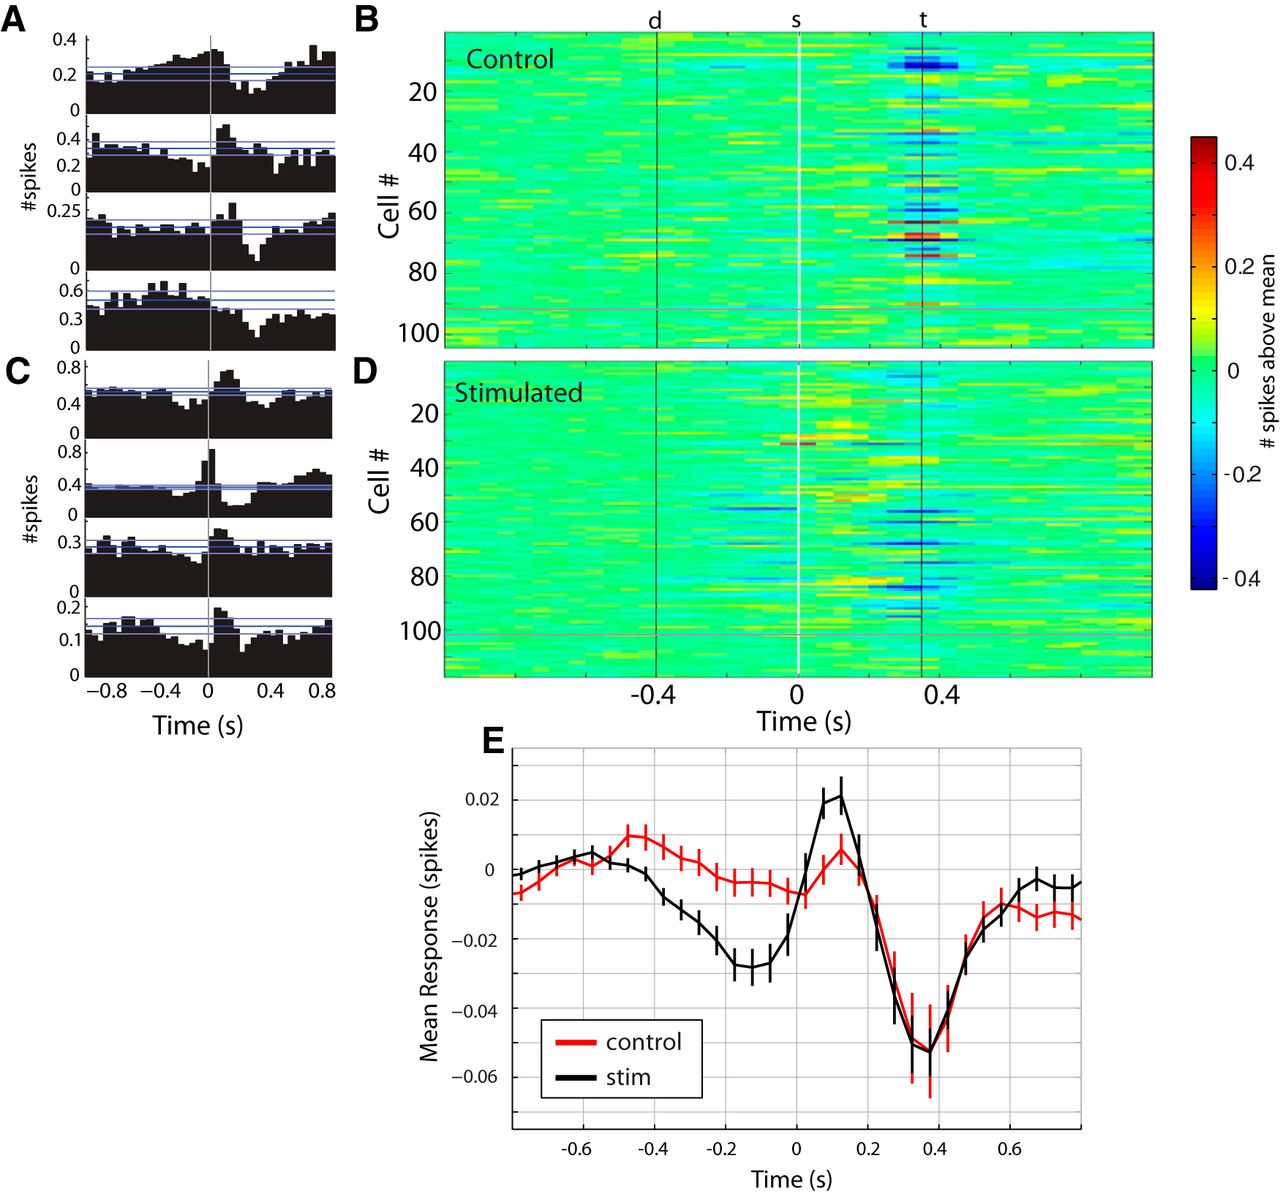
Neuronal responses during the aperture-discrimination task. A, Four example PSTHs during the aperture-width discrimination task described in Fig. 5A, from control animals that were not stimulated. Bin widths are 50 ms. Reference lines show mean ± SD during the baseline period (the period before –400 ms). Time 0 is the time of stimulus onset, when the whiskers contact the aperture. B, Set of all 104 PSTHs from two control animals. d, door opens to start trial; s, stimulus onset (whiskers contact aperture); t, tone sounds indicating rat has reached end of stimulus chamber. Spike counts in B are calculated by subtracting the mean spike count during the baseline period. PSTHs below the gray line are those for which there was no significant response. C, D, Same as A and B but for the stimulated animals (n = 117 neurons). E, Mean ± SEM PSTH for all neurons for control (red) and stimulated (black) groups.


Tables
Figure Test Quantities compared P-value Effect size 2B Two-tailed t test S1 vs. V1: num sessions to learn 0.0032 1.6259 2E Two-tailed t test S1 vs. V1: num trials to learn 0.0047 1.6048 2F ANOVA V1: percent correct (PC) vs. difficulty 0.0015 0.9904 2F Two-way ANOVA Factor 1 (angle): mean PC 0.0003 0.4261 2F Two-way ANOVA Factor 2 (implant location): mean PC 0.6186 0.043 2F Two-way ANOVA Interaction (angle × location): mean PC 0.5024 0.1336 2G Two-tailed t test Naive V1 vs. pretrained S1: num sessions to learn 0.8518 0.1201 2G Two-tailed t test Naive S1 vs. V1: num sessions to learn 0.6433 0.4082 3E F test Stimulus location vs. receptive field peak correlation 0.7 0.0259 4C Two-tailed t test S1 vs. V1: num sessions to learn integrated task 1 0 4D Two-tailed t test S1 vs. V1: num trials to learn integrated task 0.6258 0.4306 5E Two-way ANOVA Factor 1 (animal group): PC for two-width case (54/78) 0.5485 0.0833 5E Two-way ANOVA Factor 2 (treatment): PC for two-width case 0.0004 1.115 5E Two-way ANOVA Interaction (group × treatment): PC two widths 0.8597 0.4738 5E Two-tailed t test Two-width PC change versus zero: after stimulation 0.0136 1.1567 5E Two-tailed t test Two-width PC change versus zero: after clipping 0.0014 2.0877 5F Two-way ANOVA Factor 1 (animal group): PC multiwidth (12/14 widths) 0.9187 0.026 5F Two-way ANOVA Factor 2 (treatment): PC multiwidth 0.0179 1.1543 5F Two-way ANOVA Interaction (group × treatment): PC multiwidth 0.6384 0.1217 5F Two-tailed t test Multiwidth PC change versus zero: after stimulation 0.153 0.6874 5F Two-tailed t test Multiwidth PC change versus zero: after clipping 0.009 2.1161 5G Two-way ANOVA Factor 1 (animal group): sensitivity 0.7111 0.0833 5G Two-way ANOVA Factor 2 (treatment): sensitivity 0.0105 1.115 5G Two-way ANOVA Interaction (group × treatment): sensitivity 0.0868 0.4738 5G Two-tailed t test Sensitivity change versus zero: group after stim 0.0107 1.6174 5G Two-tailed t test Sensitivity change versus zero: group after clip 0.3449 0.4786 6E Chi-squared test Proportion w/anticipatory response in stim vs. control 0.009 0.18 6E Chi-squared test Proportion w/response to stim in stim vs. control 0.053 0.13
In this issue


