

Abstract
The supraoptic nucleus (SON) is a group of neurons in the hypothalamus responsible for the synthesis and secretion of the peptide hormones vasopressin and oxytocin. Following physiological cues, such as dehydration, salt-loading and lactation, the SON undergoes a function related plasticity that we have previously described in the rat at the transcriptome level. Using the unsupervised graphical lasso (Glasso) algorithm, we reconstructed a putative network from 500 plastic SON genes in which genes are the nodes and the edges are the inferred interactions. The most active nodal gene identified within the network was Caprin2. Caprin2 encodes an RNA-binding protein that we have previously shown to be vital for the functioning of osmoregulatory neuroendocrine neurons in the SON of the rat hypothalamus. To test the validity of the Glasso network, we either overexpressed or knocked down Caprin2 transcripts in differentiated rat pheochromocytoma PC12 cells and showed that these manipulations had significant opposite effects on the levels of putative target mRNAs. These studies suggest that the predicative power of the Glasso algorithm within an in vivo system is accurate, and identifies biological targets that may be important to the functional plasticity of the SON.
Significance Statement
The scale and complexity of transcriptome datasets makes the identification of suitable targets for physiologic studies a daunting problem. Using the unsupervised graphical lasso (Glasso) algorithm, we reconstructed a putative network from 500 plastic genes in the supraoptic nucleus (SON) of the hypothalamus. The most active nodal gene identified within the network encodes RNA-binding protein CAPRIN2. We tested the validity of the Glasso network by either overexpressing or knocking down Caprin2 transcripts in differentiated rat pheochromocytoma cells and showed that these manipulations had opposite effects on the levels of putative target mRNAs. Our studies suggest that the predicative power of the Glasso algorithm can identify biological targets that may be important in a Caprin2 gene network mediating functional plasticity in the SON.
Introduction
The supraoptic nucleus (SON) of the mammalian hypothalamus is a central neuroendocrine integrative structure consisting of large magnocellular neurons (MCNs) whose axons project to the posterior lobe of the pituitary (PP; Burbach et al., 2001), a neurovascular interface through which the brain regulates peripheral organs to maintain homeostasis (Murphy et al., 2016). The SON is responsible for the synthesis of the neuropeptide hormones arginine vasopressin (AVP), which cleaved from its precursor propeptide en route from the SON to the PP (Murphy et al., 2016). On release, AVP travels through the blood stream to specific receptor targets located in the kidney where it promotes water reabsorption in the collecting duct (Breyer and Ando, 1994).
Lactation and dehydration evoke a dramatic remodelling of the SON (Hatton, 1997; Theodosis et al., 1998). A plethora of changes in morphology, electrical properties and biosynthetic and secretory activity have all been described (Sharman et al., 2004). For example, as a consequence of the depletion of pituitary stores that accompanies chronic osmotic stimulation, there is a need to synthesize more AVP. This starts with an increase in transcription (Murphy and Carter, 1990), which results in an increase in the abundance of both precursor hnRNAs (Kondo et al., 2004) and mature AVP mRNAs (Sherman et al., 1986). In addition, It has been demonstrated that the AVP mRNAs is subject to post-transcriptional modification in the form of an increase in the length of the 3’ poly(A) tail following dehydration (Carrazana et al., 1988; Zingg et al., 1988; Carter and Murphy, 1989; Murphy and Carter, 1990). Recently, microarrays have been used to document transcriptome-wide changes in gene expression in the SON of male rats subject to salt-loading and dehydration (Hindmarch et al., 2006; Greenwood et al., 2015), and in female rats in response to both dehydration and 11 d of lactation (Qiu et al., 2011), and it has been suggested that these changes are part of an organized response to maintaining homeostasis in a changing environment (Hindmarch et al., 2013).
The analysis pipeline for these, and indeed most microarray experiments, is one of normalization and statistical testing before the filtering according to some arbitrary cutoff, such as fold-change. The resulting list of transcripts can then either be mined manually to select well-regulated targets, or subjected to one of the many approaches to bioinformatic analysis according to gene function or pathway. While these strategies are well used and often return important findings, they are at odds with the unbiased philosophy behind the transcriptome-wide experiment, as they require that the target gene has already been described, typically in a tissue discrete from that under interrogation. To investigate new strategies for target prioritization, we have here employed network reconstruction/inference strategies to our SON microarray data in either the control state or the “plastic” state to test whether this is an effective strategy for the robust identification of important plastic genes in this tissue.
Network inference is a strategy whereby a network structure is estimated from transcriptome data; genes are the nodes of this network and the edges are the inferred interactions. Two main strategies exist when attempting to reconstruct gene networks. The most tractable approach uses supervised inference where a set of “known” links and non-links between genes are used as a training set to construct a classifier or decision function. This classifier can be subsequently used to estimate links or non-links between further nodes in a network. In the second approach, unsupervised inference is used and the network structure is assumed only from the transcriptome data presented and thus the inference problem is harder. Here, we use the unsupervised graphical lasso (Glasso) algorithm (Friedman et al., 2008) to generate a putative gene network (see Materials and Methods for a full description). Gene features in Glasso are viewed as nodes in a network that predicts stable and reproducible dependencies between these nodes. To validate the results from the Glasso algorithm, we inferred a second network model based on the matrix of Pearson correlation coefficients between nodes.
From the derived Glasso network, we identified a hub nodal gene, Caprin2, that encodes an RNA-binding protein that we have previously identified as being important in the central osmotic defense response (Konopacka et al., 2015). To test this prediction from the Glasso algorithm, we perturbed the network in vitro by manipulating Caprin2 expression. We show that the predicative power of the Glasso algorithm is accurate and identifies genes that may be important in biological transitions.
Materials and Methods
Microarray data preparation
We re-mined raw data taken from analysis of 29 Affymetrix 230 2.0 microarrays that represented animals in either the naïve state (n = 4 female and n = 5 male) or the plastic state (n = 5 dehydration-male, n = 5 lactation-female, n = 5 dehydrated-female, n = 5 salt-loaded-male; Hindmarch et al., 2006; Qiu et al., 2011; Greenwood et al., 2015). NCBI Accession numbers (incorporating controls): male dehydration, GSE3110; male salt loading, GSE65663; female dehydration and lactation, GSE30733. We note that the biological importance of salt and water balance, especially after challenge, ensures small standard deviations (10%) in the data (Hindmarch et al., 2013). Validation using quantitative reverse transcription PCR (qRT-PCR; Hindmarch et al., 2006; Qiu et al., 2011; Greenwood et al., 2015; Fig. 3) has shown that the microarray data are very robust and reliable. We note that the genes encoding the two major neuropeptide products of the SON, AVP and oxytocin, are not represented in our differentially expressed gene list. The expression level of both these important peptides was so high within the control data that the signal was saturated, precluding any detection of upregulation following dehydration, lactation or salt loading (Hindmarch et al., 2006).
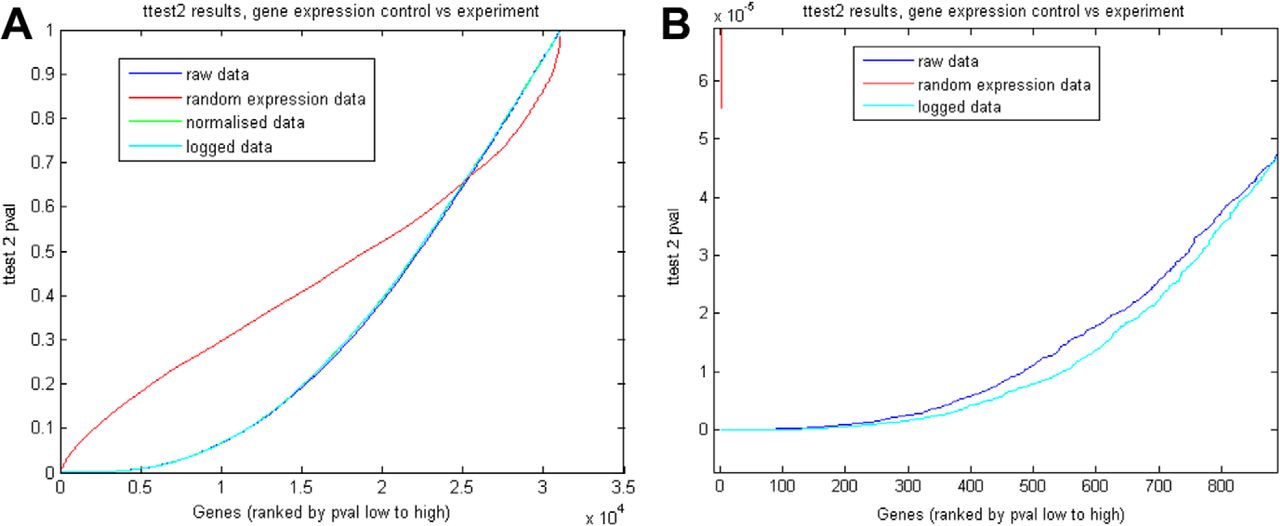
Initially trying to run Glasso on the entire SON microarray dataset of 31042 genes was prohibitive as a covariance matrix of 31042 × 31042 genes was too large to be stored in memory in R. Also, it is worth noting that many genes, even if well correlated with each other, were of lower interest as they are not necessarily strongly up or down regulated from control to experimental state. Therefore, it was necessary to reduce the size of the datasets to a manageable subset that only included potentially interesting genes, those that were significantly regulated between naïve and plastic states. To avoid the false discovery rate inherent in comparisons with sets of large numbers, we used a two-sample t test, comparing our experimental data against sets of 29 randomly generated matrices (using a Gaussian random deviate) of the same dimensionality (31042 × 31042; Fig. 1A). We performed a set of 10 such comparisons, against different sets of randomly generated matrices, and the most significant t test p values from this study were of order 10−5, the most significant p value from a comparison was 1.5 × 10⁻⁵ and the least significant was 6 × 10⁻⁵. When we applied this cutoff to the microarray data, the t test returned >500 gene pairs with higher significance (Fig. 1B) with p values up to 1 × 10⁻¹⁵. All data were run on raw, normalized and logged data for comparison. To establish the false discovery rate, and the level of significance that should be applied to relieve the effects of false discovery, we ran a t test on a randomly generated set of 29 (31042 × 31042) matrices (the same size as the experimental data matrices). We then applied these thresholds to our raw, normalized and logged data for comparison between these types.

A, Microarray data t test, control versus experiment, genes ranked by ttest2 p value low to high. Raw data, normalized data, and logged data all gave comparable results. Randomly generated data gave higher p values for over half the gene pairs. Above the point of curve intersection microarray data stopped providing information, as significance was equivalent to randomly generated data. B, Zoomed in version of A, showing that the microarray data generated far lower p values compared to the random data. The lowest p value from randomly generated data were 1.5 × 10⁻⁵. The figure shows that the top 500 genes are under 1 × 10⁻⁵.
Network inference using the Glasso algorithm
The Glasso algorithm is based on determining an estimated precision matrix. This precision matrix is the inverse of the estimated sample covariance matrix, derived from data. For two features, a zero component of the precision matrix would mean the corresponding variance is infinite, i.e., that the correlation is uniform and infinitely spread, and the features are therefore totally uncorrelated. In our case these features can be viewed as nodes, representing genes or expression sites generally, in a network and the method is determining dependencies of expression levels. With the Glasso algorithm a penalty term is used to force components of the estimated precision matrix toward zero. Those components of the precision matrix which remain non-zero correspond to the highest interdependencies between nodes (e.g., genes) in the network.
The Glasso algorithm has various advantages over other algorithms for network inference. It is one of the fastest network inference algorithms available, running 30-4000 times faster than its competitors (Friedman et al., 2008). It can manage large amounts of data, running on 1000 × 1000 matrices in around a minute and the use of an L1 (Lasso) penalty term to enforce sparsity enables few key functional links to be inferred from large amounts of data. This fitted our problem well as we wish to obtain a few high-probability links to test experimentally from a large amount of data.
Glasso estimates a sparse undirected graph by applying an L1 penalty to the estimation of an inverse covariance matrix. The model assumes that data (in this case, gene expression data) is continuous and that the observations comes from a multivariate Gaussian distribution, that has mean  and covariance matrix
  . This covariance matrix encodes the extent that gene expression values are correlated and therefore its components give a measure of strength of correlation. As such the matrix is symmetrical along its diagonal. An estimation of the inverse of the covariance matrix, called the estimated precision matrix, is used to infer potential links.
To determine those features which are most interdependent Glasso uses a penalty term in the algorithm to force components of the estimated precision matrix to zero. A parameter ρ, prefacing this penalty term, controls the extent of sparsity in the estimated network. Those remaining components of the precision matrix which remain non-zero correspond to the highest interdependencies among nodes (genes) in the network. Let S be the sample covariance matrix and S−1 be its inverse. Let Γ be the estimated precision matrix. The objective function of the Glasso algorithm has two terms, which are optimized via an algorithm. The first term is of the form KL[N(0, Γ), N(0, S−1)], where KL is the Kullback-Leibler divergence, a measure of similarity of distributions, and N(0, M) is a Gaussian distribution with a zero mean vector and precision matrix M. Minimization of this term would therefore enhance the similarity of the estimated precision matrix Γ to the inverse sample covariance matrix. The second term in the objective function is ρ|| Γ ||1 where || Γ ||1 is the sum of the absolute values in Γ. Minimization of this term will force the values of the components within Γ to zero. Effectively then, the algorithm tries to move Γ as closely as possible toward S−1 subject to the influence of the second term, which is trying to force component values within the matrix Γ toward zero, the relative influence of these two terms controlled by ρ. Those remaining components of the precision matrix which remain non-zero correspond to the highest interdependencies among nodes in the network.
The sample covariance matrix becomes singular when the dimension of the matrix is much larger than the sample size. For this reason, to model large covariance matrices, the usual approximation is via a sparse estimation matrix, with most entries zero (Bickel and Levina, 2008). This is the route taken by the Glasso algorithm, in which optimization of a norm-1 penalized maximum likelihood leads to a sparse estimation of the precision matrix (Friedman et al., 2008). To further understand this issue we used the F07AGF routine of the Numerical Algorithms Group (NAG) Library (Mark 24) to determine the condition number μ of the matrices used in our study. Approximately, if we determine that the condition number μ to be of order 1.0E+k then k digits of numerical accuracy would be lost due to accumulated arithmetical loss of precision (Cheney and Kincaid, 2007). For our dataset with 500 features (representing genes), the NAG routine gives a condition number of 0.69E+15 for the sample covariance matrix. Hence, the data-derived covariance matrix itself is close to being rank-deficient (though no covariance matrix inversion or other data manipulations are required by the method). For the least sparse approximation we used in our numerical experiments, the estimated condition number of the sparse precision matrix was 7.17E+5, suggesting numerical accuracy was satisfactory for the given machine precision. However, this issue of the condition number required us to use the subset of 500 genes, rather than the full set of genes.
Using a sample covariance matrix derived from the data, Glasso iteratively derives an estimated inverse covariance matrix (precision matrix). The algorithm uses an L1-norm penalty to drive elements in this precision matrix toward 0. This penalty therefore determines the sparsity of the estimated precision matrix and hence the sparsity of the network of assumed dependencies. This penalty term is prefaced by a parameter ρ and the higher the value of ρ, the greater the sparsity. To find an appropriate value for ρ we chose the known links and non-links of a well-studied pathway, to give an indication of the correct network sparsity, and best choice for ρ. The ERK pathway data evaluated (Sachs et al., 2002) consists of 11 proteins and 11943 observations of their expression levels from 12 perturbation experiments. The ERK pathway is very well studied and a full network of directional links is known for the network. We downloaded the Glasso software (from http://statweb.stanford.edu/∼tibs/glasso/) and applied it to this dataset. Setting the Glasso sparsity parameter to ρ = 4 gave those links and non-links which have been found in the ERK pathway (Sachs et al., 2002).
In addition to running Glasso on the top 500 differentially expressed genes, a Pearson correlation measure was also derived from the data. The genes pairings returned by Glasso were in the top most highly correlated pairings as determined by the Pearson correlation coefficient.
Animal experiment
All experiments were performed under a Home Office United Kingdom license held under, and in strict accordance with, the provisions of the United Kingdom Animals (Scientific Procedures) Act (1986); they were also approved by the local Animal Welfare and Ethical Review Board. Twelve-week-old male SD Rats (Harlan) were given access to standard laboratory rat chow and water ad libitum for one week to acclimatize to laboratory conditions, following which half the animals were completely deprived of drinking water for 72 h (dehydration), which elicits a reliable and consistent increase in plasma osmolality with limited weight loss (Greenwood et al., 2015). Animals were killed by stunning and then decapitated with a small animal guillotine (Harvard Apparatus). The brain was quickly extracted and placed on aluminum foil and frozen with dry ice. Brains were stored at -80°C.
Functional validation of the Glasso-derived gene network
The rat adrenal pheochromocytoma cell line (PC12) was grown complete DMEM (Sigma D6546) containing 10% (v/v) horse serum (HS; Gibco 16050), 5% (v/v) heat-inactivated fetal bovine serum (Gibco 10500), 1% (v/v) penicillin/streptomycin solution (Pen Strep; Gibco 15140), and 2 mM L-glutamine (Gibco 25030). Cells were cultured onto tissue culture flasks precoated with 40 µg/ml rat-tail Type I collagen (Type VII, C8897, Sigma Aldrich) and maintained at 37°C in a humidified incubator with 5% (v/v) CO2. On reaching confluence, cells were passaged and plated onto collagen-coated 12-well tissue culture plates with complete DMEM as described above. Differentiation of PC12 cells was initiated by replacing the medium with serum-free DMEM containing 0.25% (w/v) bovine serum albumin (Sigma A17906), 1% (v/v) HS, 1% (w/v) Pen Strep solution, and 50 ng/ml nerve growth factor (Life Technologies13257-019). Medium and NGF were replaced every 2 d. At day 4 of NGF treatment, Caprin2 shRNA lentivirus was added to the medium, with a scrambled shRNA lentivirus being used as a control. Lentiviral vectors containing shRNA of Caprin2 and scrambled shRNA control were produced as previously described (Konopacka et al., 2015). For overexpression studies of Caprin2 in PC12 cells, an adenovirus expressing full-length Caprin2 cDNA (Konopacka et al., 2015) was used, with an eGFP-expressing virus as a control. Production of adenoviral vectors has been described (Greenwood et al., 2015).
qRT-PCR
Tissue from SON was sampled using a cryostat, taking 60-μm coronal slices, and the SON was punched using a 0.5-mm tissue punch (Interfocus). Twelve punches were taken from the left and right SON (24 total per brain) and stored on dry ice in 1.5-ml tubes. Total RNA was extracted from punched samples by combining TRIzol reagent with Qiagens RNeasy kit protocols (Qiagen). The punched samples were removed from dry ice and rapidly resuspended, by vortexing, in 1-ml TRIzol reagent. Following TRIzol phase separation with chloroform, 350 μl of the upper aqueous phase was removed, mixed with 350-μl 70% (v/v) ethanol and applied to RNeasy columns. The remaining steps were performed as recommended by the manufacturer. For cell studies, cells were collected and lysed with 350-μl TRIzol reagent on day 7 after NGF treatment (3 d after virus transduction). RNA extraction was performed using Direct-Zol RNA Mini Prep Kit (Zymo Research) following the manufacturer’s instructions. RNA was converted to cDNA using QuantiTect Reverse Transcription kit (Qiagen). Primers for qPCR were designed using the NCBI PrimerBLAST tool (http://www.ncbi.nlm.nih.gov/tools/primer-blast/; Table 1). Note that the primer set for Hbb used for the analysis of Sprague Dawley (SD) SON RNA (derived from sequence BI287300) did not detect PC12 transcripts, presumably due to that cell line being derived from a different strain of rat. We therefore used primers designed to detect all rat Hbb alleles. PCRs were performed on ABI7500 or StepOnePlus Real-time PCR Systems (Applied Biosytem) using FastStart Universal SYBR Green Master Mix (Roche). The housekeeping gene Rpl19 was used to normalize expression from targets and to calculate  (Livak and Schmittgen, 2001) to analyze the relative change in gene expression.
List of primers used for qRT-PCR
Statistical tests
Statistical differences between two experimental groups were evaluated using independent-sample unpaired Student’s t tests; p < 0.05 was considered significant.
Results
Significance testing of microarray data
Transcriptome datasets were derived from Affymetrix oligonucleotide array analysis of that the SD rat SON subject to three physiologic transitions that elicit functional plasticity, namely dehydration in both males (Hindmarch et al., 2006) and females (Qiu et al., 2011), salt-loading in males (Greenwood et al., 2015), and lactation in females (Qiu et al., 2011). To avoid the false discovery inherent in large comparisons, we employed a two-sample t test with a 31042 × 29 matrix of randomly generated data (see Methods) and established an appropriate significance threshold of n × 10−5. We selected the top 500 genes that were regulated in the SON between naïve and plastic states that satisfied the significance threshold (all p values < 1 × 10⁻¹⁵) and used these to establish the 500 × 500 covariance matrix computed and solved by Glasso.
Network reconstruction using Glasso and Pearson
Running Glasso with a L1 penalty parameter of 30 and ignoring links below a threshold of 0.0001 yielded 28 unique genes (Table 2) engaged in 48 links (Table 3). Pearson correlation returned 47 unique genes (Table 4) engaged in 32 bidirectional links with a correlation measure over 0.95 between (Table 5). We filtered these results to find those genes which had a high fan-out in terms of connectivity to other genes. We established subsets of genes with either a fan-out of more than one link, or at least one link to another gene with a fan-out greater than one. This resulted in networks of 14 genes from the Glasso reconstruction (Fig. 2A) and seven genes from the Pearson correlation (Fig. 2B). Only one gene satisfied these requirements in both networks; Caprin2 was ranked 50th overall in the t test.
List of unique genes in the Glasso network
Glasso pairs
List of unique genes in the Pearson network
Pearson pairs
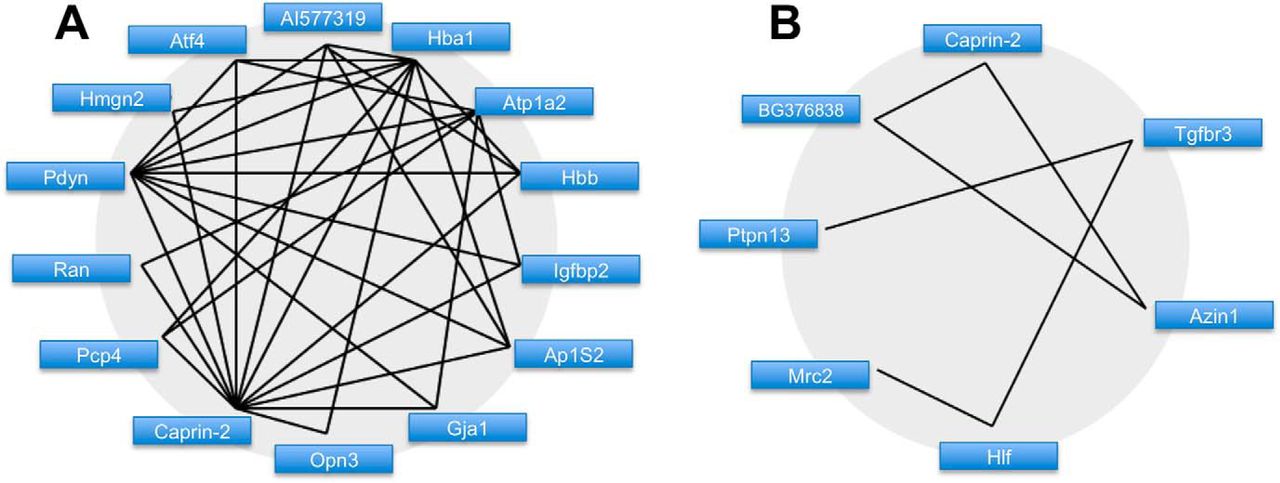
Putative gene networks derived from SON transcriptome data. A, The Glasso-derived network. Undirected links are solid black lines. Genes are represented by short names. B, The Pearson correlation-derived network. Undirected links are solid black lines.Genes are represented by short names.
qRT-PCR validation
We validated the expression profiles of the 14 genes identified by Glasso using qRT-PCR of RNA extracted from euhydrated and dehydrated 12-week-old male SD SON (n = 10 for euhydrated and n = 11 for dehydrated). Of the original 14 genes in the Glasso network (Fig. 2A), 10 had significantly different (p < 0.05) relative expression levels (Fig. 3), while three of the predicted genes were false positives and were therefore excluded (Hmgn2, BM391736; Gja1, AI411352; Hba1, AI179404). Primer sets for one of the expressed sequence tags (ESTs) AI577319 failed to deliver data. To establish whether correlations exist between the genes validated by qRT-PCR a Pearson correlation was performed which resulted in 8 out of 10 correlations (Fig. 4).

qRT-PCR validation of differential expression. The expression profiles of the 14 genes identified by Glasso were examined by qRT-PCR of RNA extracted from euhydrated (control) and dehydrated (DH) 12-week-old male SD SON. Of the original 14 genes in the Glasso network (Fig. 2A) 10 had significantly different relative expression levels. Error bar, SEM; *p < 0.05; **p < 0.01; ***p < 0.001; n = 10 for control and n = 11 for DH.

The validated Glasso-derived gene network. Link with significant Pearson correlation (p < 0.05) are represented by solid lines. Links not significantly correlated are represented by dotted lines.
Functional validation of the Glasso network in vitro
We developed an in vitro model to assess the functional validity of the Glasso predicted network. Rat adrenal pheochromocytoma PC12 cells can be made to differentiate into cells with a neurone-like phenotype by treatment with nerve growth factor (NGF). First, we used qRT-PCR to show that transcripts encoded by a sub-set of the genes of the Glasso network are expressed in PC12 cells, and that their expression level is changed following NGF treatment (Fig. 5). This analysis revealed that all the genes in the network, except Prodynorphin (Pdyn) and ATPase Na+/K+ transporting subunit-α2 (Atp1a2), are expressed in undifferentiated PC12 cells. Expression of Pdyn mRNAs are dramatically increased in NGF-treated cells (>100,000-fold increase), while the level of Atp1a2 remains undetectable. The expression of Caprin2, Opsin-3 (Opn3), and Purkinje cell protein 4 (Pcp4) transcripts is decreased in PC12 cells following NGF treatment (Caprin2 0.425, p = 0.006; Opn3 0.343, p = 0.017; Pcp4 0.052, p = 0.003), while Ras oncogene family member Ran, insulin-like growth factor-binding protein 2 (Igfbp2), activating transcription factor 4 (Atf4), hemoglobin subunit-β (Hbb) and adaptor-related protein complex 1 σ2-subunit (Ap1s2) mRNA abundance are not significantly changed.

Expression of Glasso network genes in PC12 cells. Relative mRNA expression of genes in the network was examined in both undifferentiated and NGF-treated PC12 cells by qRT-PCR. The relative mRNA level was calculated using 2^(−ΔΔct) method where the expression level of undifferentiated sample was calculated as 1. Since Pdyn is undetectable at 40 cycles on qRT-PCR in undifferentiated PC12 cells, the relative mRNA level was calculated by assumption of Ct value of undifferentiated sample as 40 cycles. Error bar, SEM; *p < 0.05; **p < 0.01; unpaired Student’s t test; n = 3.
We then manipulated the expression of nodal gene Caprin2 in differentiated PC12 cells using lentiviral vectors that express either an shRNA specific for all splice isoforms of Caprin2 (Konopacka et al., 2015) to knockdown endogenous expression (Fig. 6A), or an Adenoviral vector expressing full-length rat Caprin2 cDNA (Konopacka et al., 2015) to elicit overexpression (Fig. 6B). We then used qRT-PCR to ask about the effects of Caprin2 knockdown (Fig. 6C) or overexpression (Fig. 6D) on the levels of transcripts encoded by putative target genes within the Glasso network. With the exception of the Atf4 and Igfbp2 mRNAs, the expression of which was not altered by manipulation of Caprin2, knockdown or overexpression of Caprin2 in vitro had opposite effects on Pdyn, Opn3 and Hbb mRNA abundance. Thus, while Caprin2 knockdown increased Pdyn mRNA levels (3.833, p = 0.00004), Caprin2 overexpression decreased Pdyn transcript abundance (0.572, p = 0.035). In contrast, both Opn3 and Hbb levels were decreased by Caprin2 knockdown (Opn3 0.477, p = 0.00004; Hbb 0.323, p = 0.0013), but were increased following Caprin2 overexpression (Opn3 1.506, p = 0.0023; Hbb 2.771, p = 0.0008).
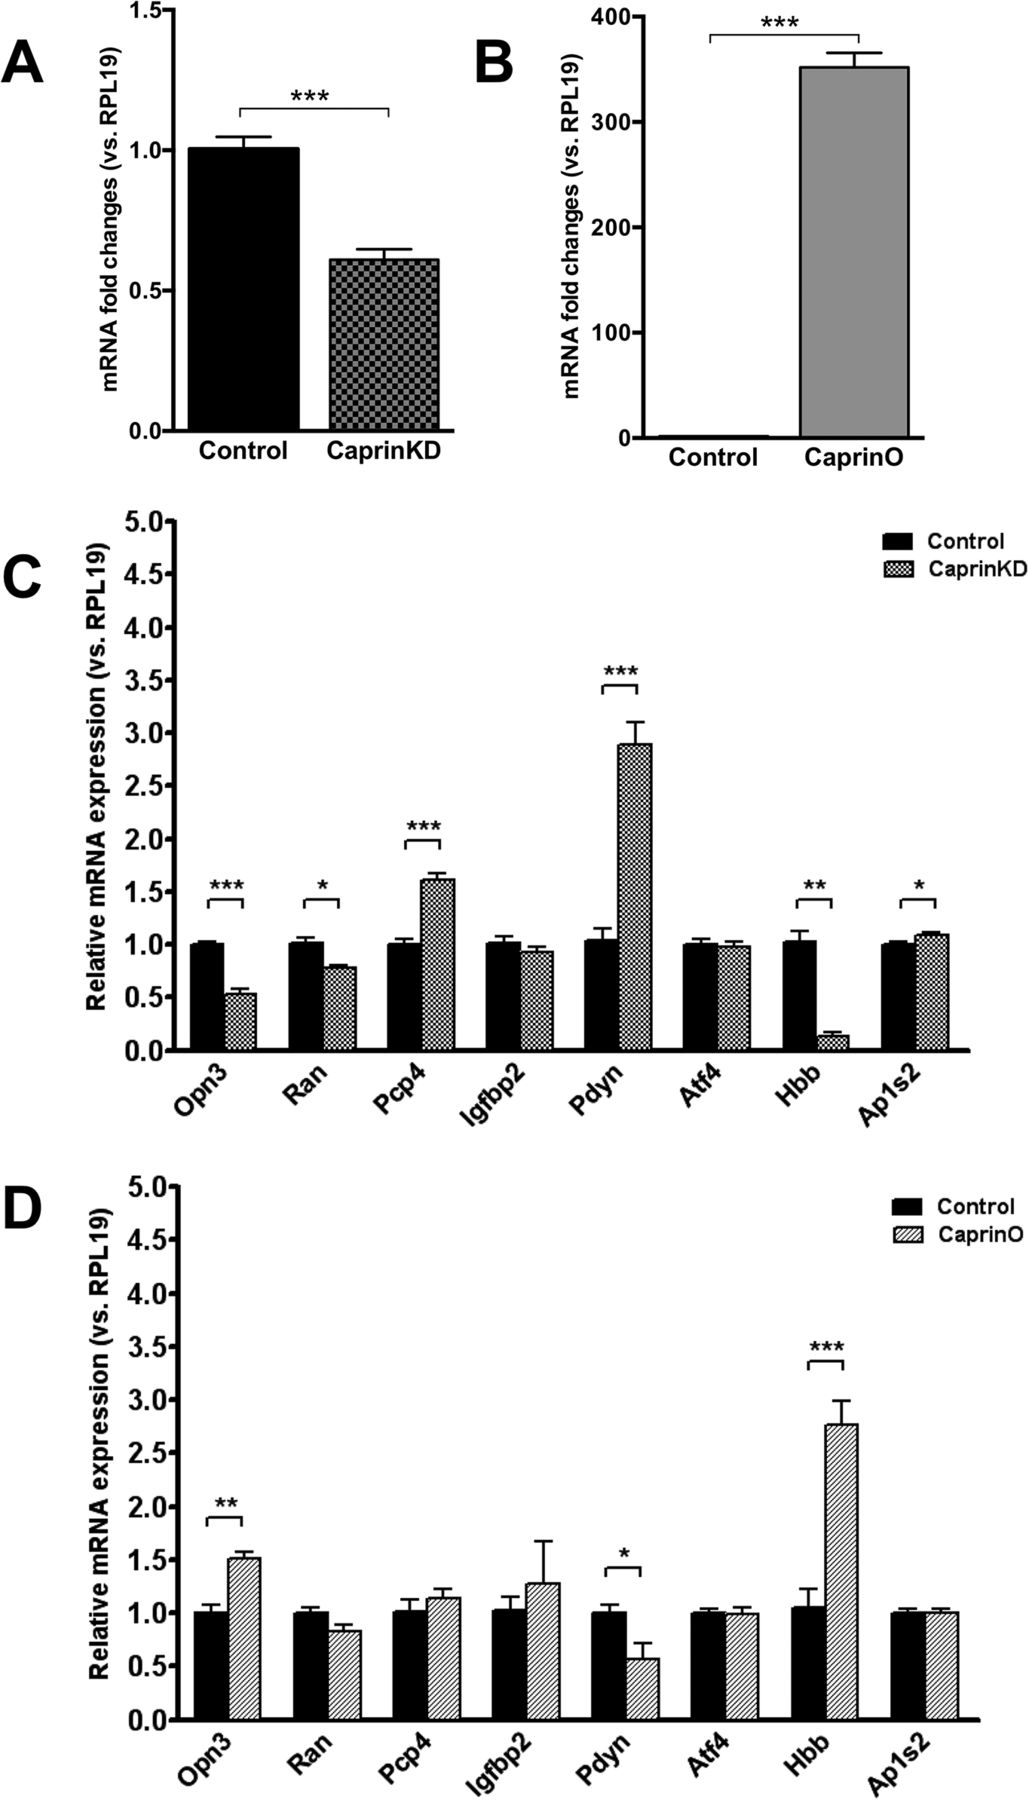
Change in mRNA expression of Glasso network genes in differentiated PC12 cells following Caprin2 knockdown or Caprin2 overexpression. A, For knockdowm, NGF-treated PC12 cells were transduced with lentiviral vectors expressing either a Caprin2 shRNA (CaprinKD) or a scrambled shRNA (control). Relative mRNA expression of endogenous Caprin2 was examined by qRT-PCR. The relative mRNA level was calculated using 2^(−ΔΔct) method, where the expression level of control sample was calculated as 1. Error bar, SEM; ***p < 0.001; unpaired Student’s t test; n = 6. B, For overexpression, NGF-treated PC12 cells were transduced with adenoviral vectors expressing either Caprin2 (CaprinO) or eGFP (control). Relative mRNA expression of endogenous Caprin2 was examined by qRT-PCR. The relative mRNA level was calculated using 2^(−ΔΔct) method where the expression level of control sample was calculated as 1. Error bar, SEM; ***p < 0.001; unpaired Student’s t test; n = 4. C, NGF-treated PC12 cells were transduced with lentiviral vectors expressing either a Caprin2 shRNA (CaprinKD) or a scrambled shRNA (control). Relative mRNA expression of genes in the network was examined by qRT-PCR. The relative mRNA level was calculated using 2^(−ΔΔct) method where the expression level of control sample was calculated as 1. Error bar, SEM; *p < 0.05; **p < 0.01; ***p < 0.001; unpaired t test; n = 6. D, NGF-treated PC12 cells were transduced with adenoviral vectors expressing either Caprin2 (CaprinO) or eGFP (control). Relative mRNA expression of genes in the network was examined by qRT-PCR. The relative mRNA level was calculated using 2^(−ΔΔct) method where the expression level of control sample was calculated as 1. Error bar, SEM; *p < 0.05; **p < 0.01; ***p < 0.001; unpaired Student’s t test; n = 4.
Discussion
Following stimulatory physiologic cues, such as dehydration, salt-loading and lactation, the SON of the hypothalamus undergoes a function related plasticity that has previously been described in the rat at the transcriptome level (Hindmarch et al., 2006; Qiu et al., 2011; Greenwood et al., 2015). Using the unsupervised Glasso algorithm (Friedman et al., 2008), we sought to reconstruct a putative network from 500 plastic SON genes in which genes are the nodes and the edges are the inferred interactions. The most active nodal gene identified within the network was RNA-binding protein Caprin2. To test the validity of the Glasso approach, we sought an in vitro cell culture model in which genes of the predicted network are expressed. We found that differentiated PC12 cells met these criteria. We then either overexpressed or knocked down Caprin2 transcripts in differentiated rat pheochromocytoma PC12 cells, and showed that these manipulations had significant opposite effects on the levels of putative target mRNAs.
A major bottleneck of the “omic” era is the sheer scale and complexity of the datasets, and the resulting daunting problem of identifying suitable targets for often expensive and time consuming physiologic studies. We sought to address this problem in a mammalian homeostatic system that demonstrates functionally important plasticity following the physiologic challenges of dehydration, salt-loading and lactation. Each of these physiologic challenges activates the SON in a similar manner resulting in a function related plasticity that facilitates an appropriate neuroendocrine response. We hypothesized that there is a common network of genes in this tissue that underpins the general plasticity of the SON. to test this hypothesis, we combined data from the activated plastic SON, e.g., male and female water deprived, male salt-loaded and female lactation, and compared this to the male and female “naïve” data. This comparison resulted in a list of significantly regulated genes on which we performed unsupervised network inference using Glasso to reconstruct a gene network from the SON of the rat hypothalamus in either naïve or physiologically stimulated states, thus allowing us to identify potentially important “hub” genes with high numbers of putative regulatory links (i.e., they have a large fan-out in circo graphs) that may have prominent functional roles. Network inference, while less accurate than supervised methods, is a useful first step in the absence of a training set of known links and non-links. Rather than performing large numbers of perturbation experiments to characterize the entire network, we can use existing microarray data to generate correlations between genes and by applying network inference predict a of number high confidence links, giving us target genes for perturbation experiments, hence maximizing our efforts.
The application of Glasso resulted is a network of 28 genes with 48 links, while Pearson placed 47 genes in a network of 32 links. Only one gene, Caprin2, appeared in both networks. To mitigate the false discovery rate further, the network was reduced by eliminating genes below a “richness” criterion. Only those genes that the network infers as having links to at least 2 genes, and that both those genes should be linked to at least two others, were included (Fig. 2). Candidate genes identified from the Glasso inference were then validated by qRT-PCR of SON RNA collected from either euhydrated or dehydrated male rats (Fig. 3). Following elimination of the three genes that did not validate, as well as one that did not deliver data, the remaining genes were subject to Pearson correlation to attempt reengineering of the network (Fig. 4). Examination of this network clearly reveals a central hub gene, Caprin2, an RNA-binding protein (Shiina and Tokunaga, 2010) that has been shown to bind the AVP mRNA (Konopacka et al., 2015) and to mediate changes in AVP mRNA abundance and poly(A) tail length (Konopacka et al., 2015). Lentiviral mediated shRNA knockdown of Caprin2 in the osmotically stimulated hypothalamus shortened the AVP mRNA poly(A) tail and reduced transcript abundance (Konopacka et al., 2015). In an in vitro system, Caprin2 overexpression enhanced the abundance and poly(A) tail length of the AVP mRNA (Konopacka et al., 2015).
To test the physiologic validity of the Glasso network centered on Caprin2, we developed an in vitro system that enabled us manipulate Caprin2 expression and ask about consequential effects on the steady-state levels of putative transcript targets. As the network is based on transctriptome data, the functional links must regulate mRNA abundance. First, we showed that NGF differentiated PC12 cells express all of the genes in the network, except for one (Atp1a2; Fig. 5). We then used viral-mediate gene transfer to either knockdown Caprin2 using a previously characterized specific shRNA (Konopacka et al., 2015), or to overexpress Caprin2 (Fig. 6). As a consequence, we saw opposite effects on the levels of putative target mRNAs [knockdown (Fig. 6C), overexpression (Fig. 6D)]. Thus, while Caprin2 knockdown decreased the abundance of Opn3, Ran and Hbb transcripts, overexpression increased the levels of Opn3 and Hbb RNAs. In contrast, Caprin2 knockdown increased Pcp4, Pdyn, and Ap1s2 RNAs, while overexpression decreased Pdyn transcript abundance. Igfbp2 and Atf4 RNA levels were unaffected by Caprin2 manipulation.
In the dehydrated SON, an increase in Caprin2 mRNA expression is accompanied by an increase in the abundance of Opn3, Ran, Pcp4, Igfbp2, Pdyn, Atf4, and Ap1s2 transcripts, but a decrease in Hbb mRNA abundance. Consistent with this, the decrease in Caprin2 expression following differentiation of PC12 cells reduces Opn3 and Pcp4 transcript levels. However, Pdyn levels dramatically increase as a consequence of NGF-mediated differentiation of PC12, probably as a consequence of a separate Caprin2-independent transcriptional mechanism. We then manipulated Caprin2 activity in differentiated PC12 cells by overexpression or shRNA-mediated knockdown to ask about effects on the expression on putative network interacting genes. In some cases, we saw dramatic opposite effects. Thus, Caprin2 knockdown reduced Opn3 and Hbb mRNA levels, but increased Pdyn transcript abundance, whereas Caprin2 overexpression increased Opn3 and Hbb mRNA levels, but reduced Pdyn transcript abundance. These data suggest that Caprin2 functions to increase Opn3 and Hbb expression, but to decrease Pdyn expression. These data are consistent with the increased Opn3 mRNA abundance seen in the dehydrated SON, perhaps through direct association and consequent stabilisation. However, this is contrary to expectation in terms of Pdyn, which has increased expression in the dehydrated SON, and Hbb, which has decreased expression in the dehydrated SON. We suggest that any role for Caprin2 in Pdyn and Hbb mRNA regulation may not be direct and need to be considered in the context of other, possibly transcriptional, mechanisms.
Our data raise questions regarding the molecular nature and physiologic consequences of the regulatory interactions in the Caprin2 gene network. Caprin2 knockdown in the in vivo hypothalamus leads to dysfunction of the normal physiologic response to salt loading, an osmotic challenge, which in healthy rats leads to a gradual increase of urine output and fluid intake. Caprin2 knockdown results in a significant decrease in urine output and fluid intake, and an increase in urine osmolality and plasma AVP levels (Konopacka et al., 2015). We hypothesize that these dramatic physiologic consequences are a sum-total of changes in the expression of the gene products encoded by Caprin2 target genes. That Pdyn is a putative target of Caprin2 is instructive in this regard. The expression of the endogenous opioid peptide Pdyn within the hypothalamus is well known, as is its upregulation following dehydration (Sherman et al., 1986). Dynorphin peptide colocalizes with AVP, and both can be released either from axons or somato-dendritically. At the level of the neural lobe, dynorphin is coreleased with AVP and acts on axon terminal κ−opiate receptors to inhibit electrically evoked secretion of oxytocin (Falke, 1988). Centrally, dendritic release of dynorphin appears to regulate MCN electrical activity (Brown and Bourque, 2004; Brown et al., 2004; Brown et al., 2006). It is thus possible that Caprin2 mediates some of its physiologic effects through the actions of dynorphin. Interestingly, the Hbb gene is expressed in the brain (Ohyagi et al., 1994), and encodes the hemorphins, a family of endogenous nonclassical opioid peptides (Nyberg et al., 1997; Zhao et al., 1997).
Using transcriptome data from the physiologically plastic SON as a model, we have shown that our unbiased network inference strategy, using Glasso, has predictive value, and can “enrich” for functional interactions that can be tested experimentally. The application of Glasso to extensive transcriptome datasets will accelerate the identification of physiologically relevant pathways.
Footnotes
The authors declare no competing financial interests.
This work was supported by the Medical Research Council (MRC) Grant MR/N022807/1 (to M.G. and D.M.); Biotechnology and Biological Sciences Research Council (BBSRC) Grants BB/G006156/1 (to A.K., M.P.G., and D.M.), BB/J005452/1 (to C.C.T.H. and D.M.), and BB/J015415/1 (to M.G. and D.M.); the Engineering and Physical Sciences Research Council (EPSRC) Grant EP/K008250/1 (to C.C. and D.M.); the British Heart Foundation (BHF) Grant RG/11/28714 (to M.P.G. and D.M.); the Wellcome Trust ISSF-Postdoctoral Research Staff Award 097822/Z/11/Z (to A.K.); the University of Cardiff (A.K.); and by High Impact Research Chancellory (UM.C/625/1/HIR/MOHE/MED/22 H-20001-E000086; to S.-Z.H., D.M., and C.C.T.H.) and Internationalisation Research (RP011-13HTM; to S.-Y.L., D.M., C.C.T.H.) grants from the University of Malaya.
↵† S.L. and T.J.P. are joint first authors.
↵# C.C., D.M., and C.C.T.H. are joint senior authors.
This is an open-access article distributed under the terms of the Creative Commons Attribution 4.0 International license, which permits unrestricted use, distribution and reproduction in any medium provided that the original work is properly attributed.
References
In this issue


