
Umbrella menu

  • SfN.org
  • eNeuro
  • The Journal of Neuroscience
  • Neuronline
  • BrainFacts.org

Main menu

  • HOME
  • CONTENT
    • Early Release
    • Featured
    • Latest Articles
    • Issue Archive
    • Editorials
    • Research Highlights
  • TOPICS
    • Cognition and Behavior
    • Development
    • Disorders of the Nervous System
    • History, Teaching and Public Awareness
    • Integrative Systems
    • Neuronal Excitability
    • Novel Tools and Methods
    • Sensory and Motor Systems
  • ALERTS
  • FOR AUTHORS
  • EDITORIAL BOARD
  • BLOG
  • ABOUT
    • Overview
    • For the Media
    • Privacy Policy
    • Contact Us
    • Feedback
  • SfN.org
  • eNeuro
  • The Journal of Neuroscience
  • Neuronline
  • BrainFacts.org

User menu

  • My alerts

Search

  • Advanced search
eNeuro
  • My alerts

eNeuro

Advanced Search

Submit a Manuscript
  • HOME
  • CONTENT
    • Early Release
    • Featured
    • Latest Articles
    • Issue Archive
    • Editorials
    • Research Highlights
  • TOPICS
    • Cognition and Behavior
    • Development
    • Disorders of the Nervous System
    • History, Teaching and Public Awareness
    • Integrative Systems
    • Neuronal Excitability
    • Novel Tools and Methods
    • Sensory and Motor Systems
  • ALERTS
  • FOR AUTHORS
  • EDITORIAL BOARD
  • BLOG
  • ABOUT
    • Overview
    • For the Media
    • Privacy Policy
    • Contact Us
    • Feedback
PreviousNext
Research ArticleMethods/New Tools, Novel Tools and Methods

Intellicount: High-Throughput Quantification of Fluorescent Synaptic Protein Puncta by Machine Learning

J. A. Fantuzzo, V. R. Mirabella, A. H. Hamod, R. P. Hart, J. D. Zahn and Z. P. Pang
eNeuro 29 November 2017, 4 (6) ENEURO.0219-17.2017; DOI: https://doi.org/10.1523/ENEURO.0219-17.2017
J. A. Fantuzzo
1Child Health Institute of New Jersey, New Brunswick, NJ 08901
5Department of Biomedical Engineering, Rutgers University, Piscataway, NJ 08854
  • Find this author on Google Scholar
  • Find this author on PubMed
  • Search for this author on this site
V. R. Mirabella
1Child Health Institute of New Jersey, New Brunswick, NJ 08901
3Department of Neuroscience and Cell Biology, Rutgers University, Piscataway, NJ 08854
  • Find this author on Google Scholar
  • Find this author on PubMed
  • Search for this author on this site
A. H. Hamod
1Child Health Institute of New Jersey, New Brunswick, NJ 08901
  • Find this author on Google Scholar
  • Find this author on PubMed
  • Search for this author on this site
  • ORCID record for A. H. Hamod
R. P. Hart
2Department of Cell Biology and Neuroscience, Rutgers University, Piscataway, NJ 08854
  • Find this author on Google Scholar
  • Find this author on PubMed
  • Search for this author on this site
  • ORCID record for R. P. Hart
J. D. Zahn
5Department of Biomedical Engineering, Rutgers University, Piscataway, NJ 08854
  • Find this author on Google Scholar
  • Find this author on PubMed
  • Search for this author on this site
Z. P. Pang
1Child Health Institute of New Jersey, New Brunswick, NJ 08901
3Department of Neuroscience and Cell Biology, Rutgers University, Piscataway, NJ 08854
4Department of Pediatrics, Robert Wood Johnson Medical School, Rutgers University, New Brunswick, NJ 08903
  • Find this author on Google Scholar
  • Find this author on PubMed
  • Search for this author on this site
  • Article
  • Figures & Data
  • Info & Metrics
  • eLetters
  • PDF
Loading

Article Figures & Data

Figures

  • Extended Data
  • Figure 1.
    • Download figure
    • Open in new tab
    • Download powerpoint
    Figure 1.

    ML facilitates high-throughput image puncta analysis. A, Example synaptic puncta (synapsin in red) juxtaposed to a dendrite (MAP2 in green) and B, a trace provided by thresholding. C, First and second gradient (green and purple, respectively) provide a template. D, Trace boundary is improved by structure-guided ML (an optimized trace in green) overlaid on the second gradient (purple). E, The improved puncta trace as a result of ML. F, Nested folder input for image pre-processing sorted by data round (i.e., condition). G, Structure-guided ML algorithm runs multiple dilation iterations to optimize traces (green and pink loops indicate processing against the first and second gradients, respectively). H, Puncta properties are extracted and stored in matrix form, allowing flexible post-processing representation and analysis by the user (refer to Fig. 6 for statistical output and data display). Note, this overall paradigm allows user to interact with the program at fixed beginning and end steps (highlighted in green shaded boxes).
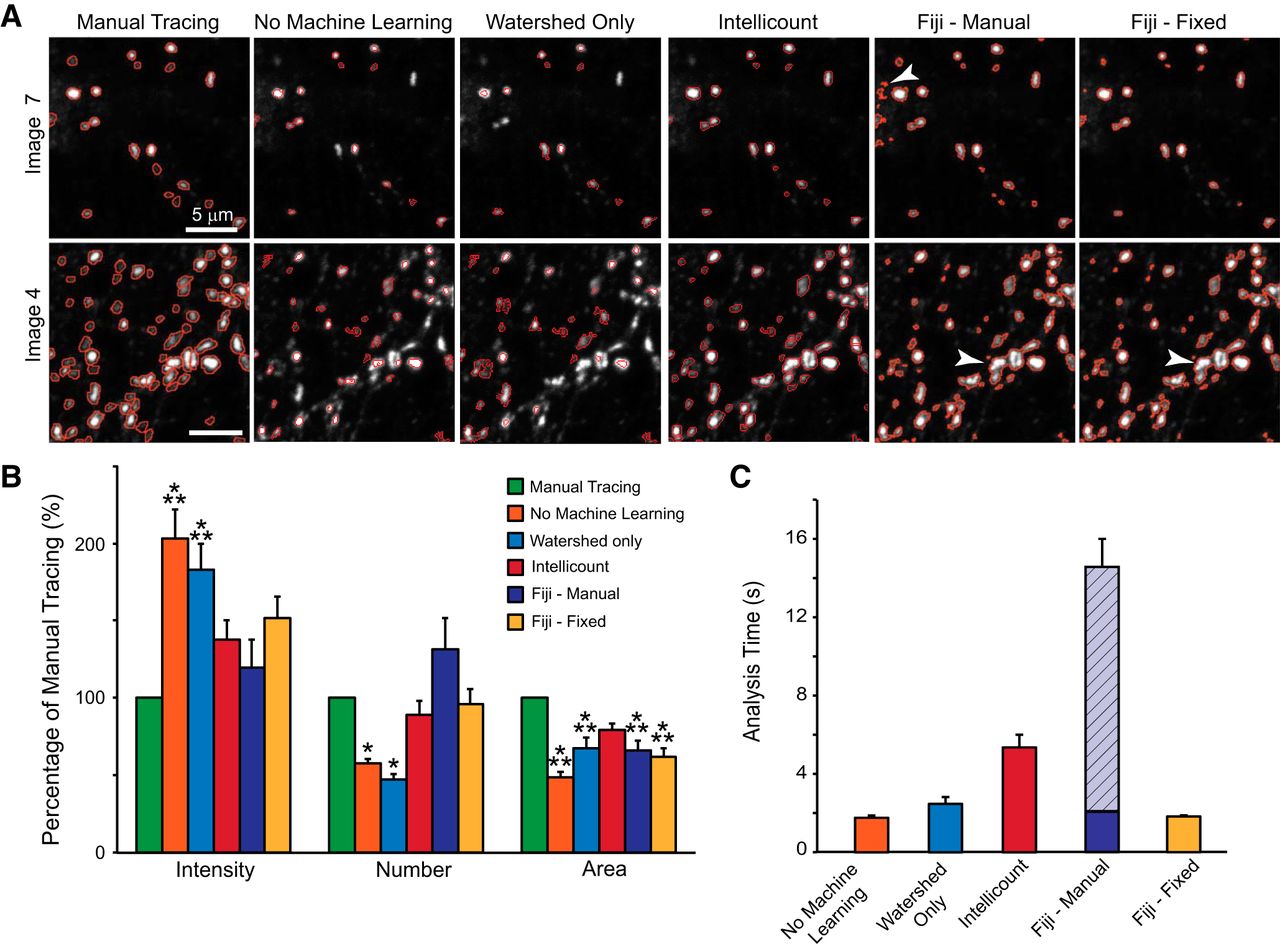
  • Figure 2.
    • Download figure
    • Open in new tab
    • Download powerpoint
    Figure 2.

    Comparison of Intellicount’s ML with manual traces and with Fiji. A, Representative traces (red) provided by manual tracing by a human observer, three processing conditions of Intellicount, and user adjusted variable- or fixed-threshold analysis in Fiji. Representative low (image 7) and high (image 4) puncta density fields are shown. White arrows indicate background included as ROI (top row) and merged puncta (bottom row). Note, “no machine learning” and “watershed only” provide traces obtained in Intellicount using default thresholds (without and with selection of a watershed algorithm, respectively) and without application of the ML. B, Comparison of these processing techniques normalized to values obtained by manual tracing. Results are displayed as mean ± SEM from analysis of 10 random fields; *p < 0.05, ***p < 0.001 using ANOVA with post hoc Tukey-Kramer, as compared to manual trace. C, Total analysis time per cropped image performed on 10 fields. Computational analysis time is shown in solid bars and was recorded either from MATLAB (for No Machine Learning, Watershed Only, and Intellicount) or Fiji macro. Diagonally-lined section of bar in Fiji-manual condition highlights the fraction of analysis time used for manual threshold selection.
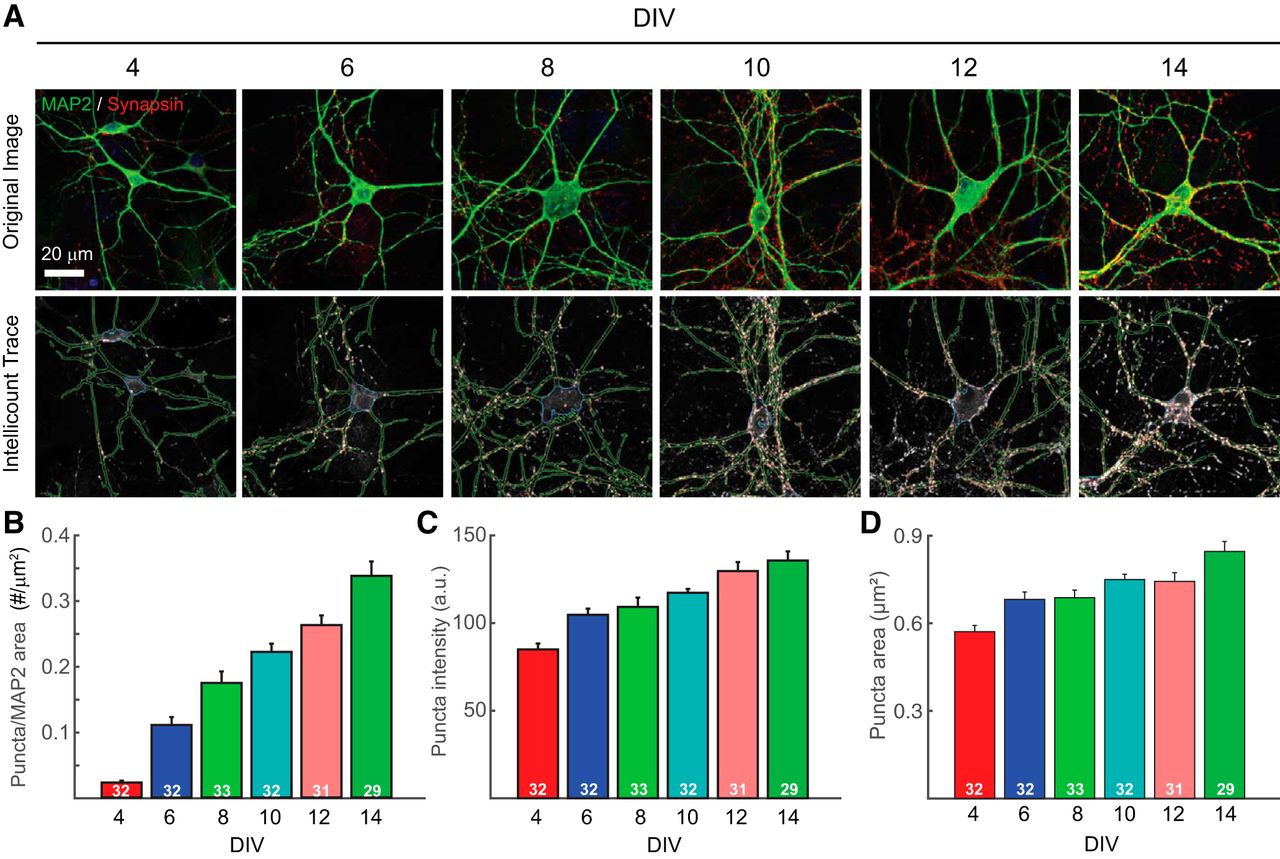
  • Figure 3.
    • Download figure
    • Open in new tab
    • Download powerpoint
    Figure 3.

    Intellicount recapitulates analysis of synaptogenesis over time in cultured hippocampal neurons. A, Upper panels: representative images taken at increasing numbers of days in culture. Lower panels, corresponding traces provided by Intellicount (red, correlated puncta synapsin traces; green, segmented dendrite traces in MAP2 channel; blue, trace of soma segmented from MAP2 channel). Display of the MAP2 channel was deselected in the lower panels facilitate visualization of puncta. A total of 29–33 images were obtained from randomly sampled fields distributed evenly over two coverslips each obtained from two independent cultures. B–D, Quantification and graphical representation of (B) synapse number, (C) mean fluorescence intensity, and (D) area provided by Intellicount with minor adjustments in Adobe Illustrator (renaming of “rounds” to appropriate conditions and thickening of stroke width for representation of graph and bar lines). Colors displayed are default in the program. Data are displayed as mean ± SEM. Numbers within bars indicate the number of images processed from that time point.
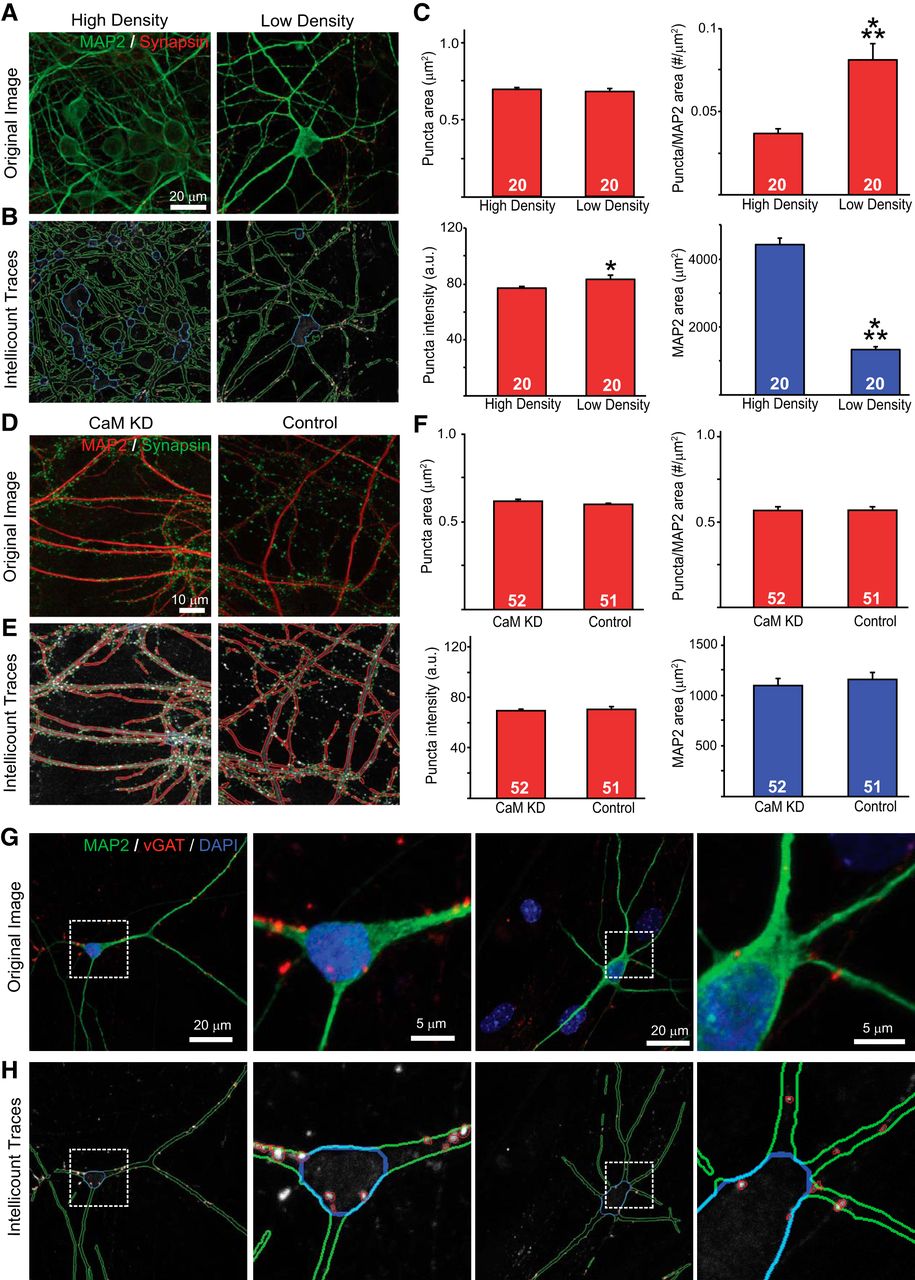
  • Figure 4.
    • Download figure
    • Open in new tab
    • Download powerpoint
    Figure 4.

    Validation of Intellicount under different culture and staining conditions. A, Representative input images of high (left panel) and low (right panel) neuronal densities. B, Corresponding traces provided by Intellicount demonstrating differences in segmented MAP2-positive areas. C, Quantification of puncta number and properties (red graphs) provided by Intellicount under high and low neuronal densities. Total segmented MAP2-positive area shown in blue graph; n = 20. D, Representative fields for lentiviral-infected CaM knock-down (CaM KD) and control (empty viral vector) expressing hippocampal neurons and (E) traces provided by Intellicount. Here, MAP2 “show correlation” is selected, which highlights MAP2 signal at 50% intensity level. F, Quantification as in C displaying no differences in synapse formation as described previously (Pang et al., 2010); n = 52 and 51 for CaM KD and control, respectively. G, vGAT staining (red) and MAP2 staining (green) in inhibitory human iNs. H, Intellicount’s trace of vGAT puncta and MAP2. A total of 60 images were analyzed. White boxes show cropped areas for visualization. Numbers in bars indicate the number of images processed from that condition. Data are displayed as mean ± SEM. Statistical tests were performed using two-tailed Student’s t test, where *p < 0.05 and ***p < 0.001.

  • Figure 5.
    • Download figure
    • Open in new tab
    • Download powerpoint
    Figure 5.

    Intellicount’s GUI. Screenshot of the Intellicount analysis platform displaying results for synapse size from the synapse formation time course (data panel, upper left panels) depicted as dot and cumulative plots and an example analyzed field (figure panel, upper middle pane). For details on operation, please refer to the user guide accompanying the software.

  • Figure 6.
    • Download figure
    • Open in new tab
    • Download powerpoint
    Figure 6.

    Intellicount provides a multifunctional analysis platform with commonly used graphical data representation and statistical methods. A-C, In addition to bar graphs, data distribution can be directly visualized and exported as (A) dot, (B) cumulative fraction (for puncta area and intensity), or (C) box-and-whisker plots. Note, rounds here are reported according to folder nesting order and correspond to increasing time points in the synapse formation analysis presented in bar graph form previously (Fig. 3). D, Histograms for areas of identified puncta are collected for each image for three increasing time points. Here, one image taken from three different rounds are overlaid to demonstrate the shift toward larger puncta during maturation. E, Statistical comparisons can be directly performed in Intellicount’s analysis platform allowing visualization of significantly different groups. Rounds highlighted in red are significantly different from the round selected by the user in blue. F, Computation of statistical test data including p values for one-way ANOVA and post hoc analysis (Tukey-Kramer). Note, box notches (C) and line lengths (E) define the boundary of 95% confidence intervals for the data and the mean for each round, respectively. Thus, in E, rounds colored with red (rounds 1–3) are statistically different (at p < 0.05) from the round selected in blue (round 6), while rounds colored in black (rounds 4–5) are not.

Extended Data

  • Figures
  • Extended Data 1

    File contains two MATLAB files and user guide. Download Extended Data 1, ZIP file.

Back to top

In this issue

eneuro: 4 (6)
eNeuro
Vol. 4, Issue 6
November/December 2017
  • Table of Contents
  • Index by author
Email

Thank you for sharing this eNeuro article.

NOTE: We request your email address only to inform the recipient that it was you who recommended this article, and that it is not junk mail. We do not retain these email addresses.

Enter multiple addresses on separate lines or separate them with commas.
Intellicount: High-Throughput Quantification of Fluorescent Synaptic Protein Puncta by Machine Learning
(Your Name) has forwarded a page to you from eNeuro
(Your Name) thought you would be interested in this article in eNeuro.
CAPTCHA
This question is for testing whether or not you are a human visitor and to prevent automated spam submissions.
Print
View Full Page PDF
Article Alerts
Sign In to Email Alerts with your Email Address
Citation Tools
Intellicount: High-Throughput Quantification of Fluorescent Synaptic Protein Puncta by Machine Learning
J. A. Fantuzzo, V. R. Mirabella, A. H. Hamod, R. P. Hart, J. D. Zahn, Z. P. Pang
eNeuro 29 November 2017, 4 (6) ENEURO.0219-17.2017; DOI: 10.1523/ENEURO.0219-17.2017

Citation Manager Formats

  • BibTeX
  • Bookends
  • EasyBib
  • EndNote (tagged)
  • EndNote 8 (xml)
  • Medlars
  • Mendeley
  • Papers
  • RefWorks Tagged
  • Ref Manager
  • RIS
  • Zotero
Respond to this article
Share
Intellicount: High-Throughput Quantification of Fluorescent Synaptic Protein Puncta by Machine Learning
J. A. Fantuzzo, V. R. Mirabella, A. H. Hamod, R. P. Hart, J. D. Zahn, Z. P. Pang
eNeuro 29 November 2017, 4 (6) ENEURO.0219-17.2017; DOI: 10.1523/ENEURO.0219-17.2017
del.icio.us logo Digg logo Reddit logo Twitter logo CiteULike logo Facebook logo Google logo Mendeley logo
  • Tweet Widget
  • Facebook Like
  • Google Plus One

Jump to section

  • Article
    • Abstract
    • Significance Statement
    • Introduction
    • Materials and Methods
    • Results
    • Discussion
    • Conclusions
    • Acknowledgments
    • Footnotes
    • References
    • Synthesis
  • Figures & Data
  • Info & Metrics
  • eLetters
  • PDF

Keywords

  • Automated Image Analysis
  • high-throughput
  • Immunofluorescence
  • machine learning
  • synapse formation
  • Synapse Quantification

Responses to this article

Respond to this article

Jump to comment:

No eLetters have been published for this article.

Related Articles

Cited By...

More in this TOC Section

Methods/New Tools

  • P2X-GCaMPs as versatile tools for imaging extracellular ATP signaling
  • Up-regulation of Supplementary Motor Area activation with fMRI Neurofeedback during Motor Imagery
  • Molecular diversity of glutamatergic and GABAergic synapses from multiplexed fluorescence imaging
Show more Methods/New Tools

Novel Tools and Methods

  • P2X-GCaMPs as versatile tools for imaging extracellular ATP signaling
  • Up-regulation of Supplementary Motor Area activation with fMRI Neurofeedback during Motor Imagery
  • Molecular diversity of glutamatergic and GABAergic synapses from multiplexed fluorescence imaging
Show more Novel Tools and Methods

Subjects

  • Novel Tools and Methods
  • Home
  • Alerts
  • Visit Society for Neuroscience on Facebook
  • Follow Society for Neuroscience on Twitter
  • Follow Society for Neuroscience on LinkedIn
  • Visit Society for Neuroscience on Youtube
  • Follow our RSS feeds

Content

  • Early Release
  • Current Issue
  • Latest Articles
  • Issue Archive
  • Blog
  • Browse by Topic

Information

  • For Authors
  • For the Media

About

  • About the Journal
  • Editorial Board
  • Privacy Policy
  • Contact
  • Feedback
(eNeuro logo)
(SfN logo)

Copyright © 2021 by the Society for Neuroscience.
eNeuro eISSN: 2373-2822

The ideas and opinions expressed in eNeuro do not necessarily reflect those of SfN or the eNeuro Editorial Board. Publication of an advertisement or other product mention in eNeuro should not be construed as an endorsement of the manufacturer’s claims. SfN does not assume any responsibility for any injury and/or damage to persons or property arising from or related to any use of any material contained in eNeuro.