

Article Figures & Data
Figures
- Figure 1.
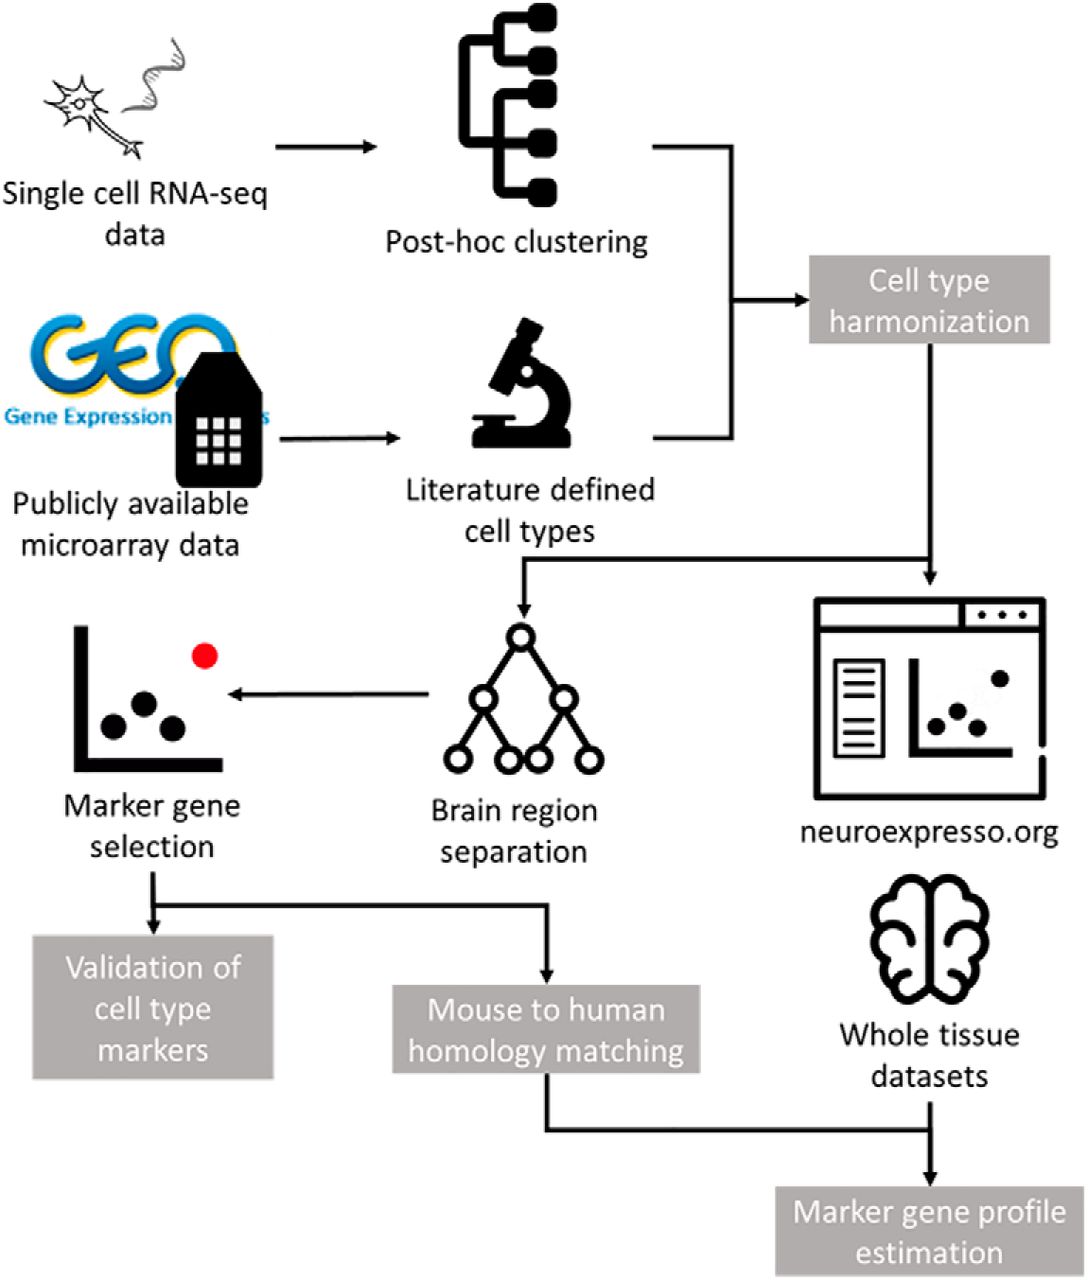
Mouse brain cell type-specific expression database compiled from publicly available datasets. A, Workflow of the study. Cell type-specific expression profiles are collected from publicly available datasets and personal communications. Acquired samples are grouped based on cell type and brain region. Marker genes are selected per brain region for all cell types. Marker genes are biologically and computationally validated and used in estimation of cell type proportions. B, Brain region hierarchy used in the study. Samples included in a brain region based on the region they were extracted from. For instance, dopaminergic cells isolated from the midbrain were included when selecting marker genes in the context of brainstem and whole brain, and microglia extracted from whole brain isolates were added to all brain regions.
- Figure 2.
The NeuroExpresso.org web application. The application allows easy visualization of gene expression across cell types in brain regions. Depicted is the expression of cell types from neocortex region. Alternatively, cell types can be grouped based on their primary neurotransmitter or the purification type. The application can be reached at www.neuroexpresso.org.
- Figure 3.
Marker genes are selected for mouse brain cell types and used to estimate cell type profiles. A, Expression of top marker genes selected for cell cortical cell types in cell types represented by RNA-seq (left) and microarray (right) data in NeuroExpresso. Expression levels were normalized per gene to be between 0 and 1 for each dataset. B, Expression of Fam114a1 in neocortex in microarray (top) and RNA-seq (bottom) datasets. Fam114a1 is a proposed fast spiking basket cell marker. It was not selected as a marker in this study due to its high expression in oligodendrocytes and S100a10 expressing pyramidal cells that were both absent from the original study.
- Figure 4.
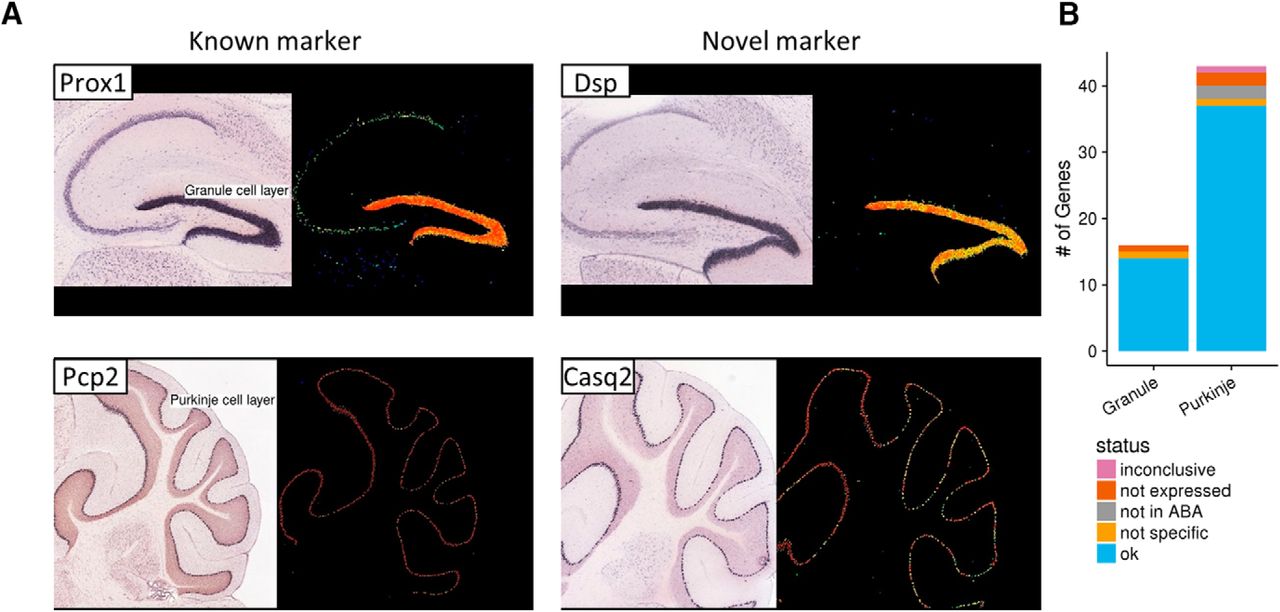
Validation of candidate markers using the ABA. A, ISH images from the ABA. Rightmost panels show the location of the image in the brain according to the Allen Brain mouse reference atlas. Panels on the left show the ISH image and normalized expression level of known and novel dentate gyrus granule cell (upper panels) and Purkinje cell (lower panels) markers. B, Validation status of marker genes detected for Purkinje and dentate gyrus granule cells. Figures used for validation and validation statuses of individual marker genes can be found in Extended Data (Extended Data Fig. 4-1,2,3,4).
- Figure 5.
Single-plane image of mouse sensorimotor cortex labeled for Pvalb, Slc32a1, and Cox6a2 mRNAs and counterstained with NeuroTrace. Arrows indicate Cox6a2+ neurons. Scale bar: 10 µm.
- Figure 6.
NeuroExpresso reveals novel gene expression patterns. A, Expression of cholinergic, GABAergic, and glutamatergic markers in cholinergic cells from forebrain and thalamus. Forebrain cholinergic neurons express GABAergic markers while thalamus (hubenular) cholinergic neurons express glutamatergic markers. B, left, Expression of Ddc in oligodendrocyte samples from Cahoy et al. (2008), Doyle et al. (2008), and Fomchenko et al. (2011) datasets and in comparison to dopaminergic cells and other (nonoligodendrocyte) cell types from the neocortex in the microarray dataset. In all three datasets, expression of Ddc in oligodendrocytes is comparable to expression in dopaminergic cells and is higher than in any of the other cortical cells. Oligodendrocyte samples show higher than background levels of expression across datasets. Right, Ddc expression in oligodendrocytes, OPCs, and other cell types from Tasic et al. (2016) single-cell dataset. C, Bimodal gene expression in two dopaminergic cell isolates by different labs. Genes shown are labeled as marker genes in the context of midbrain if the two cell isolates are labeled as different cell types.
- Figure 7.
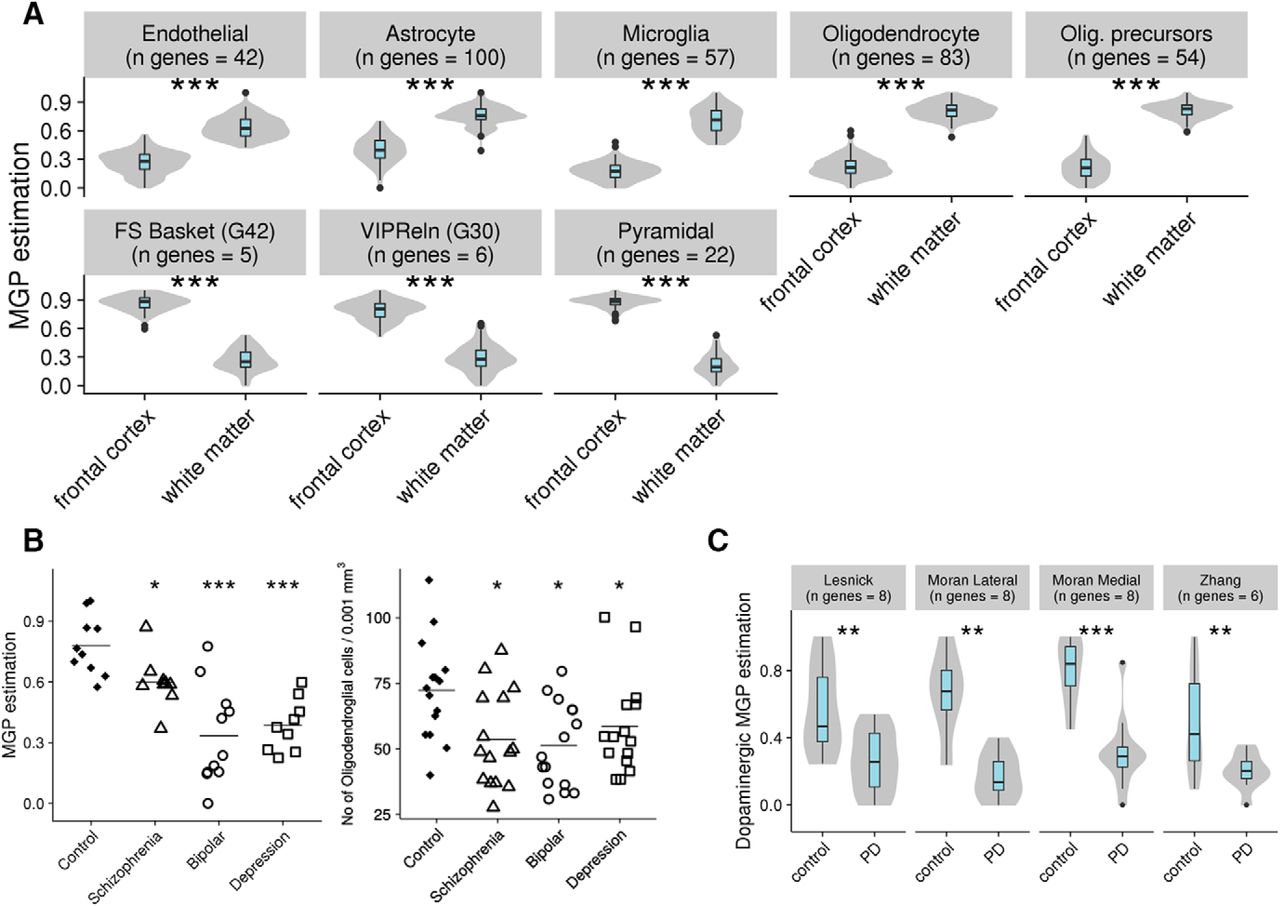
MGPs reveal cell type-specific changes in whole tissue data. A, Estimation of cell type profiles for cortical cells in frontal cortex and white matter. Values are normalized to be between 0 and 1. (***p < 0.001). B, left, Oligodendrocyte MGPs in Stanley C cohort. Right, Morphology-based oligodendrocyte counts of Stanley C cohort. Figure adapted from Uranova et al. (2004). C, Estimations of dopaminergic cell MGPs in substantia nigra of controls and PD patients. Values are relative and are normalized to be between 0 and 1 and are not reflective of absolute proportions (**p < 0.01, ***p < 0.001).


Tables
Cell type Sample count Marker gene count GEO accession and reference Whole brain Astrocyte 9/1* 94** GSE9566 (Cahoy et al., 2008), GSE35338 (Zamanian et al., 2012), GSE71585 (Tasic et al., 2016) Oligodendrocyte 25/1* 22** GSE48369, (Bellesi et al., 2013), GSE9566 (Cahoy et al., 2008), GSE13379 (Doyle et al., 2008), GSE30016 (Fomchenko et al., 2011), GSE71585 (Tasic et al., 2016) Microglia 3/1* 131** GSE29949 (Anandasabapathy et al., 2011), GSE71585 (Tasic et al., 2016) Cortex FS Basket (G42) 13/5* 18 GSE17806 (Okaty et al., 2009), GSE8720 (Sugino et al., 2014), GSE2882 (Sugino et al., 2006), GSE71585 (Tasic et al., 2016) Martinotti (GIN) 3/1* 15 GSE2882 (Sugino et al., 2006), GSE71585 (Tasic et al., 2016) VIPReln (G30) 6/1* 33 GSE2882 (Sugino et al., 2006), GSE71585 (Tasic et al., 2016) Pan-pyramidal*** 9/17 * 35 See below Pyramidal cortico-thalamic 3/2* 2 GSE2882 (Schmidt et al., 2012), GSE71585 (Tasic et al., 2016) Pyramidal Glt25d2 3/2* 3 GSE35758 (Schmidt et al., 2012), GSE71585 (Tasic et al., 2016) Pyramidal S100a10 3/4* 2 GSE35751 (Schmidt et al., 2012), GSE71585 (Tasic et al., 2016) Layer 2 3 Pyra 2* 3 GSE71585 (Tasic et al., 2016) Layer 4 Pyra 3* 5 GSE71585 (Tasic et al., 2016) Layer 6a Pyra 2* 6 GSE71585 (Tasic et al., 2016) Layer 6b Pyra 2* 9 GSE71585 (Tasic et al., 2016) OPs 1* 184 GSE71585 (Tasic et al., 2016) Endothelial 2* 178 GSE71585 (Tasic et al., 2016) Basal forebrain Forebrain cholinergic 3 90 GSE13379 (Doyle et al., 2008) Striatum Forebrain cholinergic 3 45 GSE13379 (Doyle et al., 2008) Medium spiny neurons 39 74 GSE13379 (Doyle et al., 2008), GSE55096 (Heiman et al., 2014), GSE54656 (Maze et al., 2014), GSE48813 (Tan et al., 2013a) Amygdala Glutamatergic 3 10 GSE2882 (Sugino et al., 2006) Pyramidal Thy1 Amyg 12 21 GSE2882 (Sugino et al., 2006) Hippocampus DentateGranule 3 17 GSE11147 (Perrone-Bizzozero et al., 2011) GabaSSTReln 3 54 GSE2882 (Sugino et al., 2006) Pyramidal Thy1 Hipp 12 17 GSE2882 (Sugino et al., 2006) Subependymal Ependymal 2 50 GSE18765 (Beckervordersandforth et al., 2010) Thalamus GabaReln 3 53 GSE2882 (Sugino et al., 2006) Hypocretinergic 4 35 GSE38668 (Dalal et al., 2013) Thalamus cholinergic 3 40 GSE43164 (Görlich et al., 2013) Midbrain Midbrain cholinergic 3 34 GSE13379 (Doyle et al., 2008) Serotonergic 3 18 GSE36068 (Dougherty et al., 2013) Substantia nigra Dopaminergic 30 58** No accession **** (Chung et al., 2005), GSE17542 (Phani et al., 2010) Locus coeruleus Noradrenergic 9 133 GSE8720 (Sugino et al., 2014), No accession**** (Sugino et al., unpublished observations) Cerebellum Basket 16 6 GSE13379 (Doyle et al., 2008), GSE37055 (Paul et al., 2012) Bergmann 3 52 GSE13379 (Doyle et al., 2008) Cerebellar granule cells 3 11 GSE13379 (Doyle et al., 2008) Golgi 3 26 GSE13379 (Doyle et al., 2008) Purkinje 44 43 GSE13379 (Doyle et al., 2008), GSE57034 (Galloway et al., 2014), GSE37055 (Paul et al., 2012), no accession**** (Rossner et al., 2006), GSE8720 (Sugino et al., 2014), no accession**** Sugino et al. (unpublished observations) Spinal cord Spinal cord cholinergic 3 124 GSE13379 (Doyle et al., 2008) Sample count, number of samples that representing the cell type; gene count, number of marker genes detected for cell type; *, the number of clusters from RNA-seq data; **, marker genes for these cell types are identified in multiple regions displayed yet only the number of the genes that are found in the region specified on the table is shown for the sake of conservation of space. Astrocytes, microglia, and oligodendrocyte markers are identified in the context of all other brain regions (except cerebellum for astrocytes) and dopaminergic markers are also identified for midbrain; ***, pan-pyramidal is a merged cell type composed of all pyramidal samples; ****, data obtained directly from authors.
Microarray cell type Tasic et al. (2016) cell cluster Matching method NeuroExpresso cell type name Astrocyte Astro Gja1 Direct match Astrocyte Microglia Micro Ctss Direct match Microglia Oligodendrocyte Oligo Opalin Direct match Oligodendrocyte FS Basket (G42) Pvalb Gpx3, Pvalb Rspo2, Pvalb Wt1, Pvalb Obox3, Pvalb Cpne5 Definition: fast spiking pval positive interneurons FS Basket (G42) Martinotti (GIN) Sst Cbln4 Direct match Martinotti (GIN) VIPReln (G30) Vip Sncg Unique Vip and Sncg expression, high Sncg expression in microarray cell type VIPReln (G30) Pyramidal Glt25d2 L5b Tph2, L5b Cdh13 Definition: Glt25d2 positive Fam84b positive Pyramidal Glt25d2 Pyramidal S100a10 L5a Hsd11b1, L5a Batf3, L5a Tcerg1l, L5a Pde1c Definition: S100a10 expressing cells from layer 5a Pyramidal S100a10 Pyramidal CrtThalamic L6a Car12, L6a Syt17 Direct match Pyramidal CrtThalamic — Endo Myl9, Endo Tbc1d4 New cell type Endothelial — OPC Pdgfra New cell type OPCs — L4 Ctxn3, L4 Scnn1a, L4 Arf5 New cell type Layer 4 Pyra — L2 Ngb, L2/3 Ptgs2 New cell type Layer 2 3 Pyra — L6a Mgp, L6a Sla New cell type Layer 6a Pyra — L6b Serpinb11, L6b Rgs12 New cell type Layer 6b Pyra List of molecular cell types identified by Tasic et al. (2016) and their corresponding cell types in NeuroExpresso. Matching method column defines how the matching was performed. Direct matches are one to one matching between the definition provided by Tasic et al. (2016) for the molecular cell types and definition provided by microarray samples. For “definition” matches, description of the cell type in the original source is used to find molecular cell types that fit the definition. VIPReln, Vip Sncg matching was done based on unique Sncg expression in VIPReln cells in the microarray data. New cell types are well defined cell types that have no counterpart in microarray data.
Zeisel et al. (2015; mouse) Darmanis et al. (2015; human) Cell types p value Gene count p value Gene count Endothelial p < 0.001 180 p < 0.001 157 Astrocyte p < 0.001 282 p < 0.001 239 Microglia p < 0.001 248 p < 0.001 201 Oligodendrocyte p < 0.001 156 p < 0.001 201 OPCs 0.831 193 0.999 203 FS Basket (G42) p < 0.001 26 p < 0.001 26 Martinotti (GIN) p < 0.001 21 p < 0.001 20 VIPReln (G30) p < 0.001 43 p < 0.001 36 Pyramidal p < 0.001 34 p < 0.001 27 Statistics were calculated by Wilcoxon rank-sum test.
Figure 7A Frontal cortex (n = 91) White matter (n = 88) Group comparison Mean SD Mean SD W p value Endothelial 0.265 0.117 0.64 0.112 42 p < 0.001 Astrocyte 0.401 0.135 0.757 0.101 136 p < 0.001 Microglia 0.179 0.092 0.708 0.135 4 p < 0.001 Oligodendrocyte 0.226 0.107 0.815 0.087 2 p < 0.001 Olig. precursors 0.215 0.123 0.817 0.078 0 p < 0.001 FS Basket (G42) 0.865 0.081 0.27 0.115 7744 p < 0.001 VIPReln (G30) 0.792 0.102 0.288 0.142 7718 p < 0.001 Pyramidal 0.877 0.062 0.212 0.112 7744 p < 0.001 Figure 7B, left Mean SD W (vs control) p value (vs control) Schizophrenia (n = 10) 0.598 0.129 75 0.013 Bipolar (n = 11) 0.334 0.242 102 p < 0.001 Depression (n = 9) 0.386 0.13 89 p < 0.001 Control (n = 11) 0.78 0.146 NA NA Figure 7B, right Uranova et al. (2004) Figure 7C PD Control Group comparison Mean SD N Mean SD n W p value Lesnick 0.26 0.179 16 0.578 0.263 9 119 0.007 Moran lateral 0.174 0.135 9 0.665 0.246 7 60 0.001 Moran medial 0.305 0.191 15 0.799 0.191 8 115 p < 0.001 Zhang 0.201 0.101 10 0.489 0.287 18 148 0.004 All statistics were calculated by Wilcoxon rank-sum test.
Extended Data 1
R package to perform MGP estimations on whole tissue expression data and to select marker genes from cell type-specific expression data. Download Extended Data 1, ZIP file.
Extended Data 2
R package to find gene homologues across species. Download Extended Data 2, ZIP file.
Extended Data 3
Code for data acquisition, analysis, and generation of all figures. Download Extended Data 3, ZIP file.
Figure 4-1,2,3,4
Figure 4-1. Expression of DG cell markers discovered in the study in ABA mouse brain ISH database. The first gene is Prox1, a known marker of DG cells. The intensity is color coded to range from blue (low expression intensity), through green (medium intensity) to red (high intensity). All images except Ogn is taken from the sagittal view. Ogn is taken from the coronal view.
Figure 4-2. Expression of Purkinje markers discovered in the study in ABA mouse brain ISH database. The first gene is Pcp2, a known marker of Purkinje cells. The intensity is color coded to range from blue (low expression intensity), through green (medium intensity) to red (high intensity). All images are taken from the sagittal view.
Figure 4-3. Validation status of DG cell markers.
Figure 4-4. Validation status of Purkinje cell markers. Download Figure 4-1,2,3,4, PDF file.
In this issue


Jump to section
- Article
- Visual Abstract
- Abstract
- Significance Statement
- Introduction
- Materials and Methods
- Allen Brain Atlas (ABA) ISH data
- Validation of marker genes using external single-cell data
- Preprocessing of microarray data
- Estimation of MGPs
- Code accessibility
- Results
- Discussion
- Acknowledgments
- Footnotes
- References
- Synthesis
- Author Response
- Figures & Data
- Info & Metrics
- eLetters