

Article Figures & Data
Figures
- Fig 1.
The pong game and the representation models for hand-paddle delay. a, An illustration of the experimental setup and the pong game: participants sat and held the handle of a robotic arm. A screen that was placed horizontally above their hand covered the hand and displayed the scene of the experiment. During the pong game, participants controlled the movement of the paddle (red bar) and were required to hit a moving ball (green dot) toward the upper wall of the pong arena, which is delineated by the black rectangle. b, The paddle movement was either concurrent (left – No Delay) or delayed (right – Delay) with respect to the hand movement (the red arrow indicates the paddle movement direction). c, Participants could represent the hand location based on the delayed paddle using a Time Representation (left) or a State Representation (right). In a Time Representation, participants were assumed to estimate the actual time lag, τ, and represented the hand location at time t as the location of the paddle at t + τ (blurred paddle). In a State Representation, participants would represent a Spatial Shift (Δx) between the hand and the paddle, an altered visuomotor Gain (g) relationship between hand and paddle movements, or a Mechanical System that connects the two and includes a spring (K), a mass (M), and a damper (B).
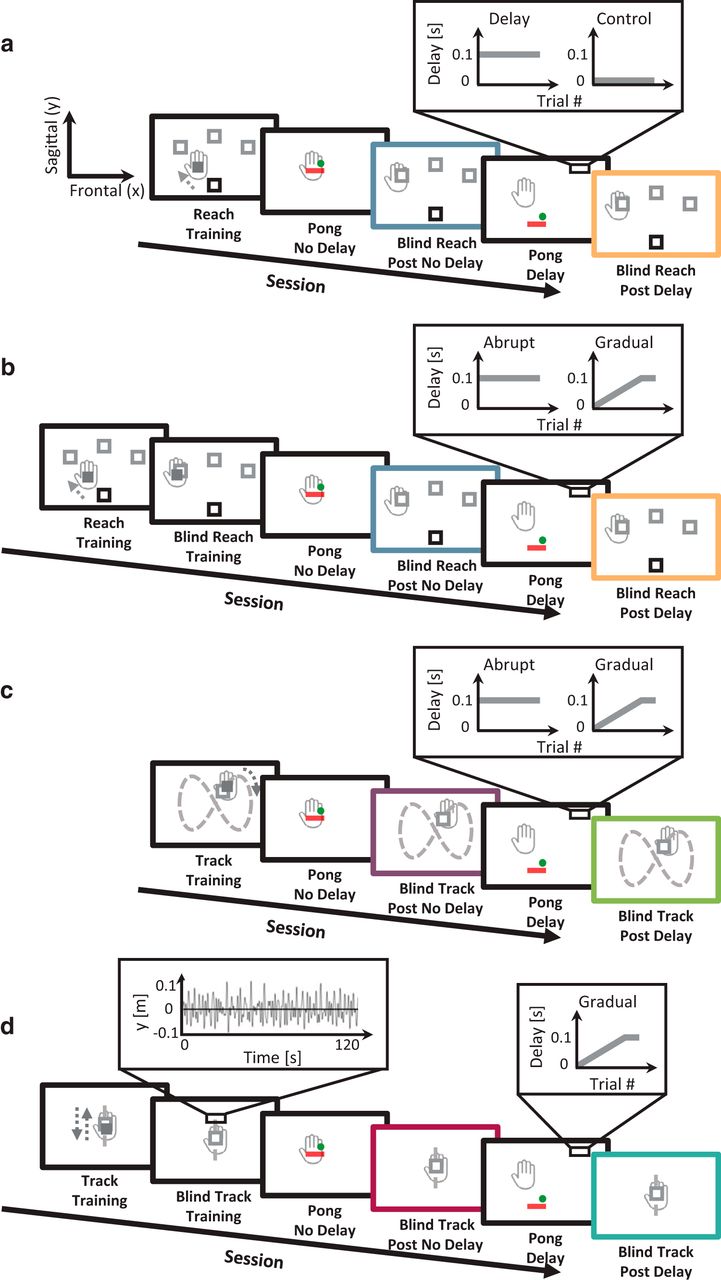
- Fig 2.
Experimental protocols. In all experiments, the participants’ hand (gray) was hidden from sight the entire time. a, Experiment 1: Delay versus Control, transfer to reaching. Sessions alternated between a pong game and a reaching task. During a reach trial, a target (gray square) appeared in one of three locations in space beyond a start location (black square), and participants were asked to reach and stop at the target. An experiment started with a Reach – Training session in which participants received full visual feedback of the hand location using a cursor on the screen (dark gray filled square). After training, participants were presented with a Pong game session (No Delay), in which the paddle moved instantaneously with their hand movement, followed by a Blind Reach session where no visual feedback was provided at any point during the trial (Post No Delay, blue frame). The second Pong game session (Delay) was introduced with a delay (Delay group) or without a delay (Control group) between hand and paddle movements, and was followed by another Blind Reach session (Post Delay, orange frame). b, Experiment 2: Abrupt versus Gradual delay, transfer to reaching. The experimental protocol was similar to experiment 1, but with the addition of a Blind Reach – Training session: the cursor was omitted during movement, but was displayed at the movement stop location. In the second Pong game session, we introduced either an abruptly (Abrupt group) or gradually (Gradual group) increasing delay. c, Experiment 3: Abrupt versus Gradual delay, transfer to tracking (figure-eight). Sessions alternated between a pong game and a tracking task. During a track trial, participants were asked to track a target that moved along a figure-eight path (dashed gray). The path was not presented to the participants in a direction illustrated by the dotted dark gray arrow. The experiment started with a Track – Training session in which participants received full visual feedback on their hand location (dark gray filled square). After training, participants were presented with a Pong game session with no delay (No Delay), followed by a Blind Track session (Post No Delay, purple frame). Next, a Pong game session was introduced with either an abruptly (Abrupt group) or gradually (Gradual group) increasing delay (Delay), and was followed by another Blind Track session (Post Delay, green frame). d, Experiment 4: Gradual delay, transfer to tracking (mixture of sinusoids). Sessions alternated between a pong game and a tracking task. During a track trial, participants were asked to track a target that moved along a sagittal path (dashed gray). The path was not presented to the participants. The target trajectory (left zooming window) was designed as a mixture of five sinusoids of different frequencies and phases. The experiment started with a Track – Training session in which participants received full visual feedback on their hand location (dark gray filled square), followed by a Blind Track – Training session. After training, participants were presented with a Pong game session with no delay (No Delay), followed by a Blind Track session (Post No Delay, magenta frame). Next, a Pong game session was introduced with a gradually increasing delay (Delay), and was followed by another Blind Track session (Post Delay, cyan frame).
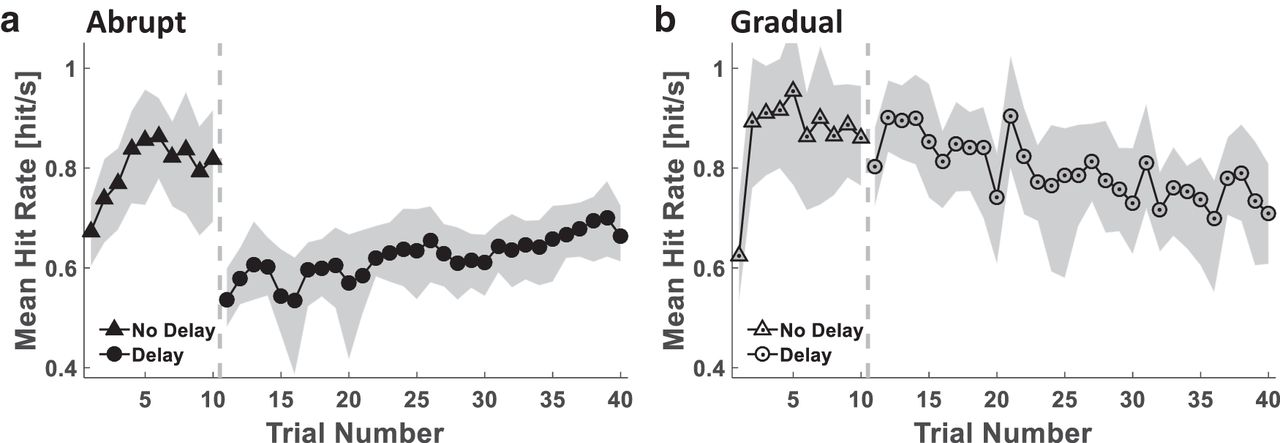
- Fig 3.
Experiment 1: paddle-ball hit rate in the presence of delayed and nondelayed feedback. Time courses of the mean hit rate of all participants in each of the Delay (a, filled markers, n = 9) and Control (b, hollow markers, n = 8) groups. The gray dashed vertical line separates the Pong No Delay (triangles) and the Pong Delay (circles) sessions. Shading represents the 95% confidence interval.
- Fig 4.
Experiment 1: reaching experimental results and representation model simulation results suggest a State-based rather than a Time-based Representation of delay. a, Single participant’s experimental results from each of the Delay (left, filled markers) and Control (right, hollow markers) groups. Movements start location is indicated by the black square and target locations are marked by the gray squares. Markers represent the end point locations of the hand at movement terminations during the Post No Delay (blue triangles) and Post Delay (orange circles) Blind Reach sessions. b, Experimental results group analysis. Colored bars represent the mean reaching movement amplitudes toward all targets of each participant, and for each of the Blind Reach sessions, averaged over all the participants in each group (Delay: left, n = 9, Control: right, n = 8) and after subtraction of each group’s average baseline amplitude (during the Blind Reach – Post No Delay session). Black bars (insets) represent the difference in mean amplitude between the Post Delay and the Post No Delay blind reaching sessions for each participant, averaged over all targets and over all the participants in each group. Dots represent differences of individual participants. Error bars represent the 95% confidence interval. c, Simulation results of reaching end points in the Delay group (Post No Delay – black outlined blue triangles, Post Delay – black outlined orange circles) for Time Representation (left) and State Representation (right) of the delay. **p < 0.01.
- Fig 5.
Experiment 2: paddle-ball hit rate in the presence of abruptly and gradually introduced delayed feedback. Time courses of the mean hit rate for all participants in each group of the Abrupt (a, filled markers, n = 10) and Gradual (b, hollow-dotted markers, n = 10) groups. The gray dashed vertical line separates the Pong No Delay (triangles) and the Pong Delay (circles) sessions. Shading represents the 95% confidence interval.
- Fig 6.
Experiment 2: a comparison between the reaching results in the Abrupt and Gradual groups suggests that the schedule of delay presentation does not influence the representation of delay. a, Single participant’s experimental results from each of the Abrupt (left, filled markers) and Gradual (right, hollow-dotted markers) groups. Movement start location is indicated by the black square and target locations are marked by the gray squares. Markers represent the end point locations of the hand at movement terminations during the Post No Delay (blue triangles) and Post Delay (orange circles) Blind Reach sessions. b, Experimental results group analysis. Colored bars represent the mean reaching movement amplitudes toward all targets of each participant, and for each of the Blind Reach sessions, averaged over all the participants in each group (Abrupt: filled, n = 10, Gradual: diagonal lines, n = 10) and following subtraction of each group’s average baseline amplitude. The black bar (inset) represents the difference in mean amplitude between the Post Delay and the Post No Delay blind reaching sessions for each participant, averaged over all targets and all the participants in both groups. Dots represent differences of individual participants. Error bars represent the 95% confidence interval. ***p < 0.001.
- Fig 7.
Experiment 3: blind tracking predictions. Predicted tracking performance for each representation model: Time Representation (left), State Representation (right) – Spatial Shift, Gain, and Mechanical System. The upper panel depicts schematic illustrations of a sinusoidal target trajectory (bold black) and hand trajectories during a tracking task following a nondelayed (Post No Delay, dashed gray) and a delayed (Post Delay, dotted gray) Pong game. The lower panel depicts the target-hand position space plots for the post nondelayed (Post No Delay, purple) and post delayed (Post Delay, green) conditions; each corresponds to the target and hand trajectories presented above it. For the Time Representation of the delay, the hand trajectory is predicted to precede the target trajectory, resulting in a wider ellipse in the target-hand position space. For the State Representation – Spatial Shift model, the hand trajectory is predicted to be shifted away with respect to the target trajectory, resulting in an upward shift in the major axis (dashed-dotted dark lines) of the target-hand position space ellipse. For the State Representation – Gain model, the hand trajectory is predicted to increase in its amplitude with respect to the target trajectory, resulting in an ellipse that has a major axis tilted such that its slope is greater than the slope of the major axis of the Post No Delay target-hand position space ellipse. For the State Representation – Mechanical System model, the hand trajectory is predicted to precede the target trajectory while increasing in its amplitude, bringing about an ellipse that has a major axis tilted such that its slope is greater than the slope of the major axis of the Post No Delay target-hand position space ellipse.
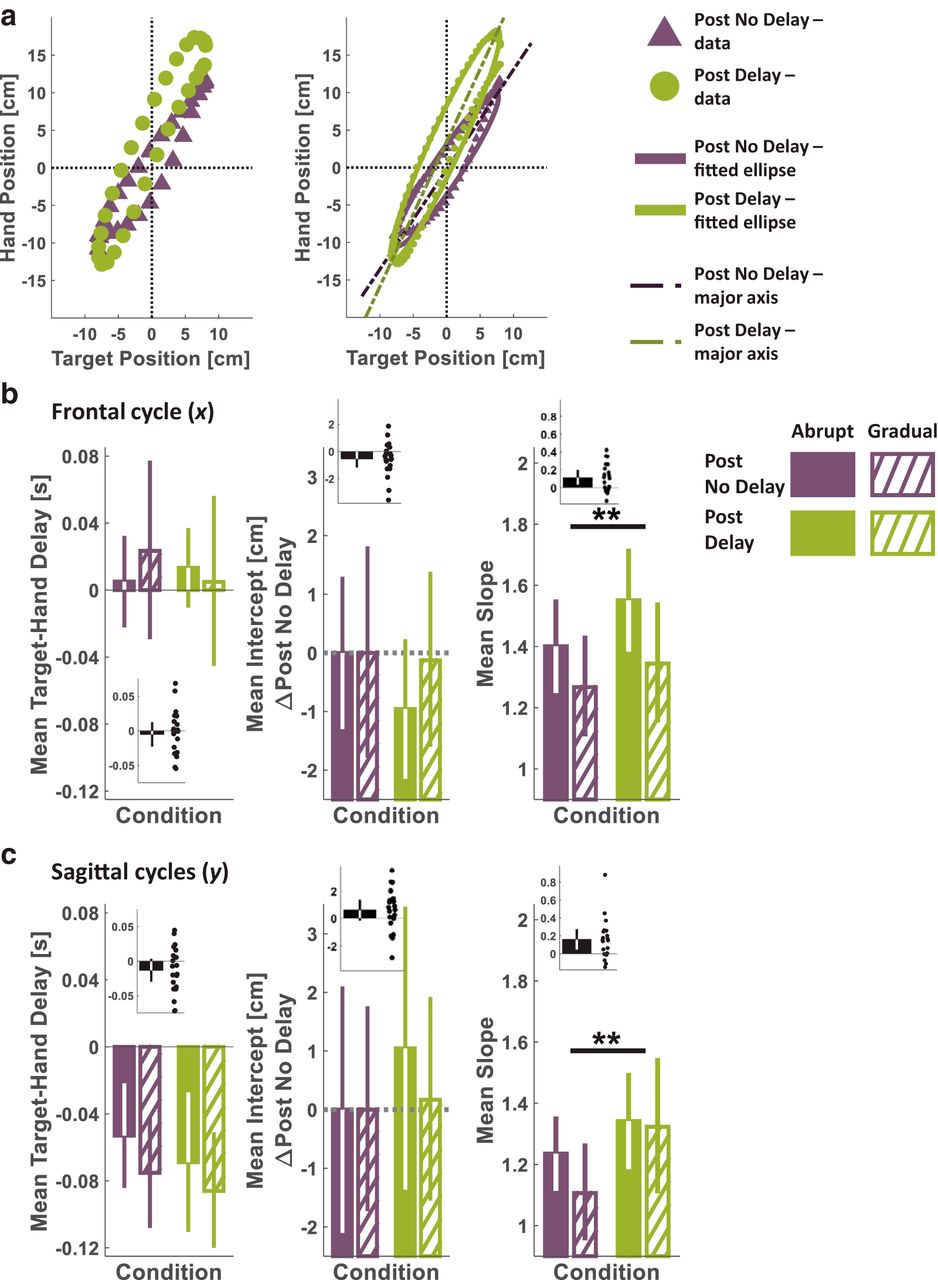
- Fig 8.
Experiment 3: tracking experimental results suggest a State Representation of delay as either a Gain or a Mechanical System equivalent rather than a Spatial Shift. a, Single participant’s results. Target-hand position space of a single sagittal cycle from each of the Post No Delay (purple triangle) and Post Delay (green circles) Blind Track sessions. The left panel presents data points sampled at 11.8 Hz. The right panel presents data points sampled at 28.6 Hz and fitted ellipses for the entire data distribution (sampled at 200 Hz) from each of the Post No Delay (purple) and Post Delay (green) tracking sessions, together with the corresponding major axis lines (dashed-dotted dark purple and dashed-dotted dark green, respectively). b, c, Group analyses for the frontal cycle (b) and the sagittal cycles (c) of the delay between the hand and the target (left), and the major axis intercepts (after subtraction of each group’s average Post No Delay intercept, middle) and slopes (right), extracted from participants’ tracking performances. Colored bars represent each participant’s mean, from each of the Post No Delay (purple) and Post Delay (green) tracking sessions, averaged over all the participants in each group (Abrupt: filled, n = 10, Gradual: diagonal lines, n = 10). The black bars (insets) represent the mean difference for each measure between the Post Delay and the Post No Delay blind tracking sessions. Dots represent differences of individual participants. **p < 0.01.
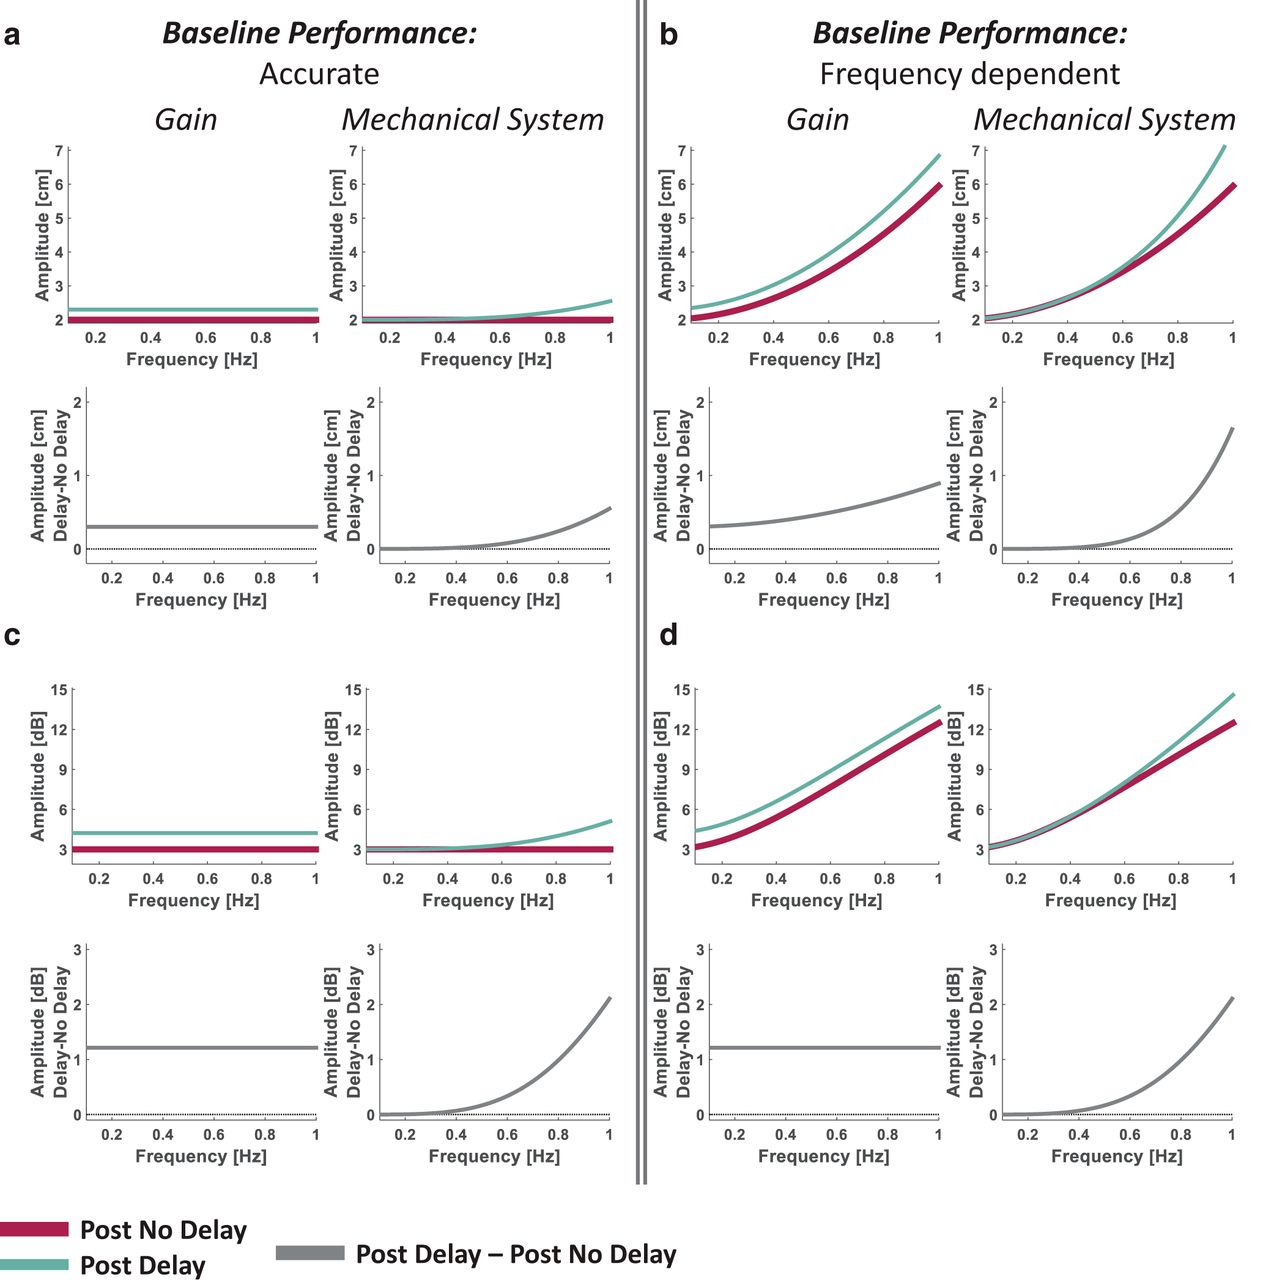
- Fig 9.
Experiment 4: predicted frequency effects on delay-induced hypermetria. Predicted effects of tracking movement frequency on the increase in movement amplitude following the delayed pong game. In each of the a–d subfigures, the predictions are presented for the State Representation - Gain (left) and State Representation – Mechanical System (right) models. Upper panels display the Post No Delay (magenta) and the Post Delay (cyan) amplitudes in cm (a, b) or in dB (c, d), and lower panels present the difference between them. a, c, When assuming accurate tracking of a target movement that has an amplitude of 2 cm during the Post No Delay session, the Gain representation should predict the same increase in movement amplitude for all frequencies during the Post Delay session, whereas the Mechanical System representation predicts a higher hypermetria with increasing frequency. b, d, A simulation of an increase in the baseline (Post No Delay) movement amplitude with an increase in the movement frequency illustrates that the predictions of both models are equivalent to the predictions for accurate baseline performance when examined in a logarithmic amplitude scale.
- Fig 10.
Experiment 4: experimental results for tracking with different frequencies suggest a State Representation of delay as a Gain rather than a Mechanical System equivalent. a, b, Single participant’s results. Hand tracking trajectories of a representative participant during the Post No Delay (magenta) and Post Delay (cyan) sessions (a), and the frequency responses (b). The filled circles represent the amplitude of each of the five main frequencies in the hand trajectories. c, d, Group analysis. Mean decibel amplitude of all participants (n = 20) for each of the five main frequencies (c). The black bar (inset) represents the mean difference in decibel amplitude between the Post Delay and the Post No Delay blind tracking sessions. Dots represent differences of individual participants. d represents the mean difference separately for each frequency. **p < 0.01.
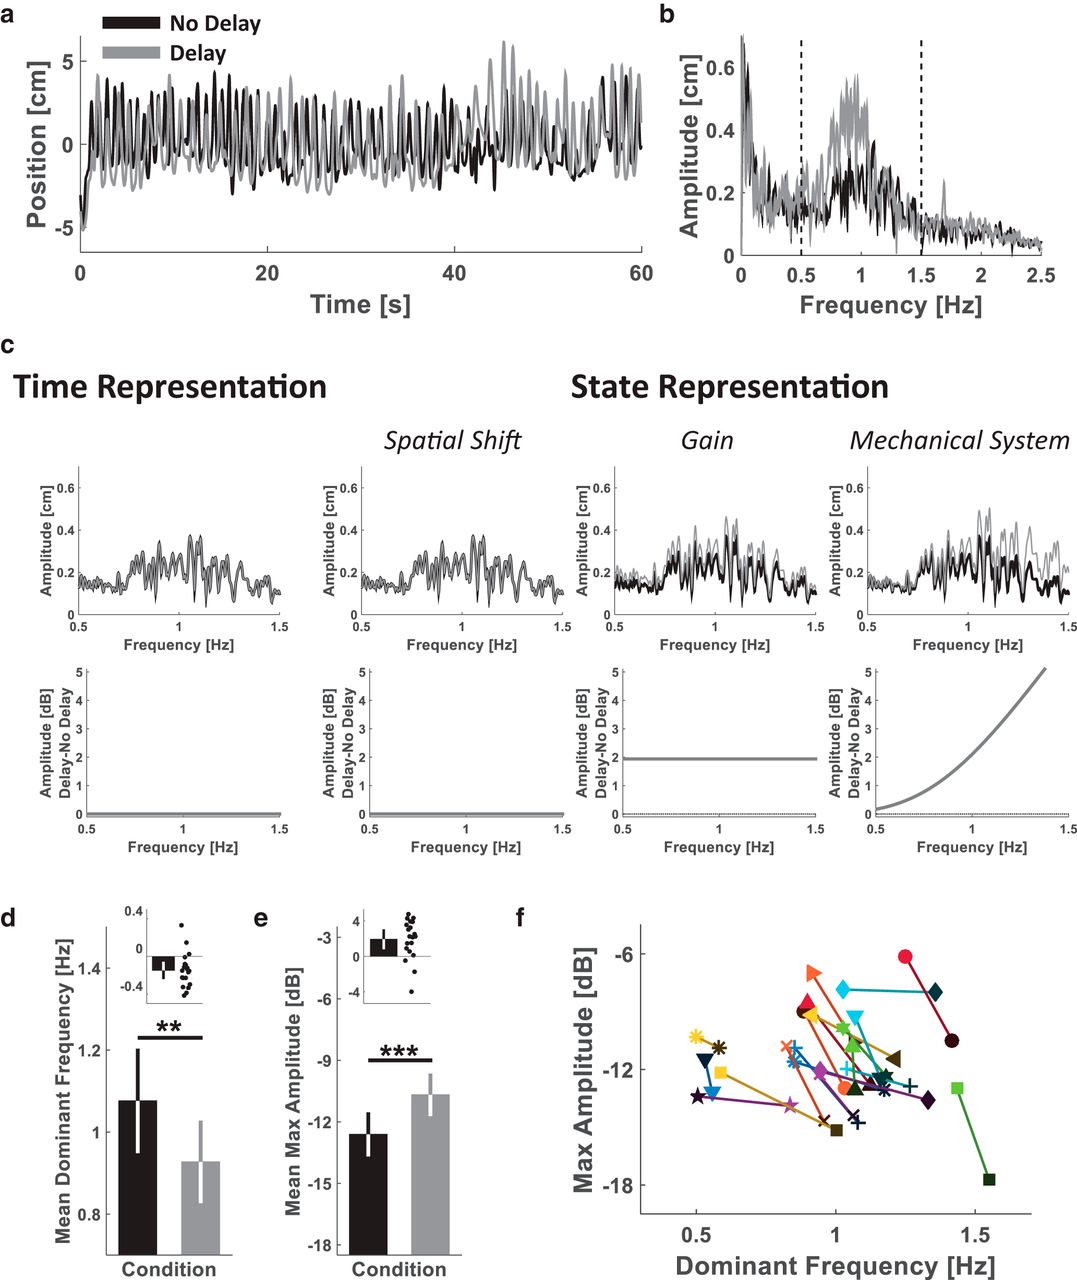
- Fig 11.
Experiment 4: frequency response analysis of pong movements and representation model simulation results are most consistent with the Gain representation model. a, b, Single participant’s results. Sagittal hand trajectories of a representative participant during the last pong trial of each of the No Delay (black) and Delay (gray) sessions (a), and the mean frequency responses of the sagittal hand trajectories from the last four trials of each session (b). The vertical dashed lines define the frequency range of interest within which the participants were mainly moving ([0.5 1.5] Hz). c, Simulation results of the predicted effect of delay according to each of the representation models, illustrated using the baseline (no delay) frequency response of the participant in b. Upper panels display the No Delay (black) and the Delay (gray) amplitudes in cm, and lower panels present the difference between the amplitudes in dB. d, e, Group analysis. Mean dominant frequency (d) and mean maximum amplitude (e) of all participants (n = 20). The black bars (inset) represent the mean difference in each measure between the Delay and the No Delay pong sessions. Error bars represent the 95% confidence interval. Dots represent differences of individual participants. f, The maximum amplitude and its respective frequency (dominant frequency) for each participant is presented in a frequency–amplitude space to illustrate the overall changes dynamic of both measures from the No Delay (dark markers) to the Delay (light markers) pong session. **p < 0.01; ***p = 0.001.


Tables
Location Data structure Type of test Power/confidence interval a Normal distribution Two-way mixed-effect ANOVA 1.000 b Normal distribution Paired-sample t test [–0.136 0.062] c Normal distribution Paired-sample t test [–0.103 0.096] d Normal distribution Paired-sample t test [–0.026 0.093] e Normal distribution Paired-sample t test [0.153 0.340] f Normal distribution Paired-sample t test [–0.120 –0.08] g Normal distribution Paired-sample t test [0.088 0.276] h Normal distribution Unpaired-sample t test [–0.384 –0.089] i Normal distribution Three-way mixed-effect ANOVA 0.529 j Normal distribution Paired-sample t test [0.470 2.925] k Normal distribution Paired-sample t test [–1.427 1.176] l Normal distribution Three-way mixed-effect ANOVA 1.000 m Normal distribution Paired-sample t test [1.940 3.936] n Normal distribution Paired-sample t test [2.048 3.400] o Normal distribution Three-way mixed-effect ANOVA 0.977 p Normal distribution Paired-sample t test [–2.917 –0.549] q Normal distribution Paired-sample t test [–1.163 0.921] r Normal distribution Paired-sample t test [–1.243 0.236] s Normal distribution Three-way mixed-effect ANOVA 0.093 t Normal distribution Two-way mixed-effect ANOVA 1.000 u Normal distribution Paired-sample t test [–0.185 –0.029] v Normal distribution Unpaired-sample t test [0.200 0.395] w Normal distribution Paired-sample t test [0.060 0.206] x Normal distribution Three-way mixed-effect ANOVA 0.988 y Normal distribution Three-way mixed-effect ANOVA 0.214 z Normal distribution Three-way mixed-effect ANOVA 0.463 aa Normal distribution Three-way mixed-effect ANOVA 0.216 ab Normal distribution Three-way mixed-effect ANOVA 0.080 ac Normal distribution Two-way mixed effect ANOVA 0.096 ad Normal distribution Two-way mixed-effect ANOVA 0.366 ae Normal distribution Two-way mixed-effect ANOVA 0.467 af Normal distribution Two-way mixed-effect ANOVA 0.395 ag Normal distribution Two-way mixed-effect ANOVA 0.872 ah Normal distribution Two-way mixed-effect ANOVA 0.846 ai Normal distribution Two-way mixed-effect ANOVA 0.829 aj Normal distribution Two-way mixed-effect ANOVA 1.000 ak Normal distribution Two-way mixed-effect ANOVA 0.071 al Normal distribution Paired-sample t test [0.006 0.027] am Normal distribution Paired-sample t test [0.045 0.227] an Normal distribution Paired-sample t test [–3.078 –0.971] Measure Effect Dimension Target-hand delay Intercept Slope F(1,18) p F(1,18) p F(1,18) p Session main Frontal 0.437 0.517 3.937 0.063 10.729 0.004 Sagittal 2.919 0.105 3.195 0.091 9.924 0.006 Group main Frontal 0.032 0.860 0.054 0.819 2.233 0.152 Sagittal 0.693 0.416 1.152 0.297 0.487 0.494 Session–group interaction Frontal 2.949 0.103 2.322 0.145 1.110 0.306 Sagittal 0.104 0.751 1.668 0.213 1.156 0.296 For each of the target-hand delay, the intercept, and the slope measures, and for each of the frontal and sagittal dimensions of the tracking path, we fitted a two-way mixed-effect ANOVA model, with the measure as the dependent variable, one between-participants independent factor (Group: two levels, Abrupt and Gradual), and one within-participants independent factor (Session: two levels, Post No Delay and Post Delay). The reported values for each measure are the F ratio, with the corresponding factor and residuals degrees of freedom in parentheses (left column), and the corresponding p-value (right column). Bold text indicate significant effects.
- Extended Data– Simulation Codes
Simulations of movements according to different delay representation models. Download Extended Data 1, ZIP file.
In this issue


