

Article Figures & Data
Figures
- Figure 1.
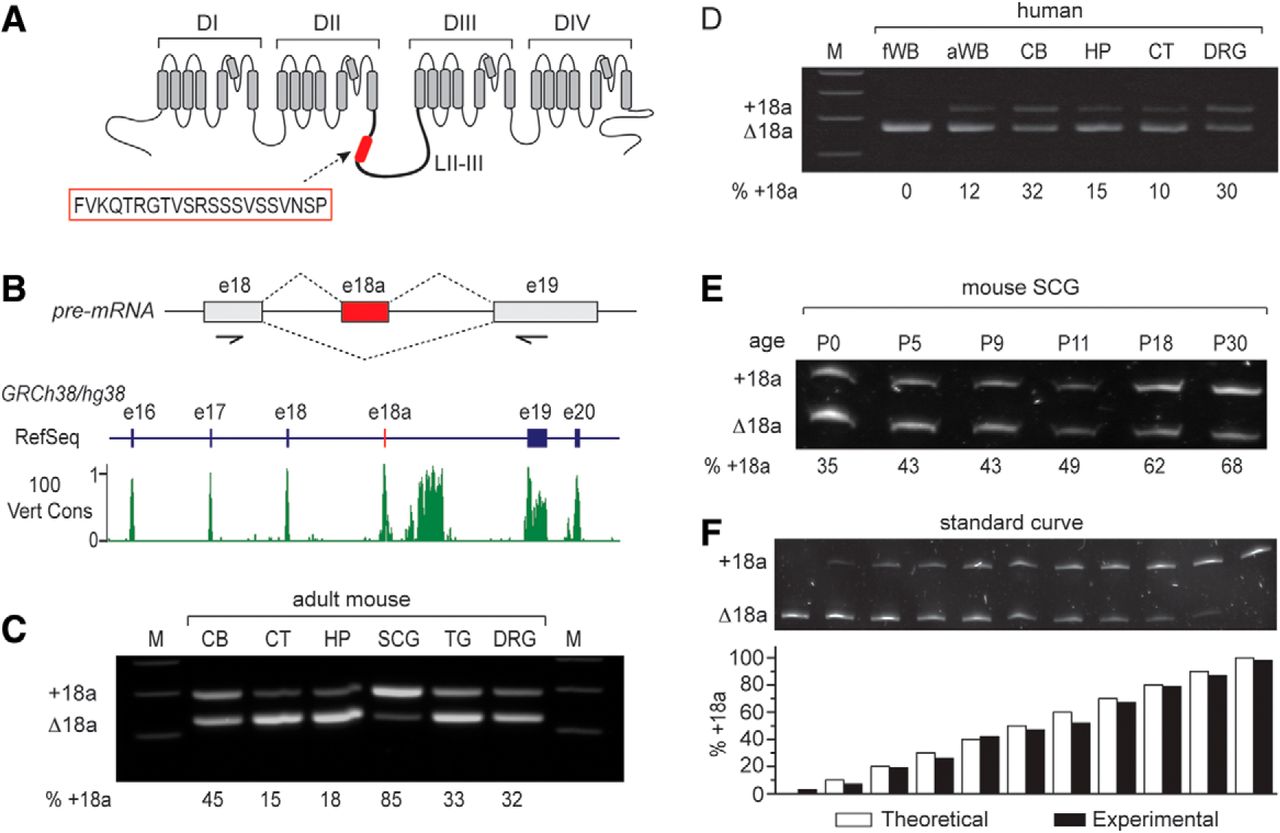
E18a expression in mouse and human tissue. A, Transmembrane spanning and pore regions of a voltage-gated calcium (CaV) channel α1 subunit. Highlighted are the four major domains (DI-DIV) and approximate location of the 21-amino acid peptide (red box) in the intracellular loop II-III (LII-III) encoded by e18a of Cacna1b. B, upper panel, Schematic of CaV2.2 pre-mRNA showing the e18a region and the two splice options (+18a or Δ18a). Arrows indicate the approximate location of PCR primers used to amplify human and mouse cDNAs. Lower panel, Visualization of RefSeq Genes and 100 vertebrates Basewise Conservation by PhastCons tracks using UCSC Genome Browser for human CACNA1B chr9:138 005,835-138 026,803 of Human December 2013 (GRCh38/hg38) assembly (https://genome.ucsc.edu/index.html; Kent et al., 2002). The region shown contains exons e16, e17, e18, e18a, e19, and e20 of human CACNA1B. In the RefSeq track, exons are denoted by vertical bars and introns by horizontal lines. E18a is not yet annotated in human genome assemblies, but we show its location by a red vertical bar. The conservation track displays the PhastCon scores from 0-1 after applying two-pixel smoothing. Regions of high conservation across vertebrates correspond to exons, including e18a. There is also a region of high conservation in the intron downstream of e18a. C, D, RT-PCR-amplified cDNA products separated in 3% agarose gels show e18a inclusion and exclusion in mRNAs of different tissue (upper band e18a, lower band Δ18a). Primers were located in constitutive e18 and e19, flanking e18a; product sizes were 291 bp (e18a) and 228 bp (Δ18a). C, Adult mouse cortex (CT) and hippocampus (HP) show the lowest levels of e18a inclusion, adult SCG the highest, and adult CB, trigeminal ganglia (TG), and DRG have intermediate levels of e18a inclusion. D, Human fetal whole brain (fWB) lacked detectable e18a, adult human whole brain (aWB), CT, and HP had low levels of e18a; and ∼30% of product amplified from adult human cerebellum (CB) and DRG contained e18a. E, RT-PCR amplified cDNA products from mouse SCG RNA, separated in 8% denaturing polyacrylamide gel. E18a inclusion increases with development from P0 (35%) to P30 (68%). F, Calibration curve validates quantification of relative amounts of e18a and Δ18a by RT-PCR. PCR products were separated in denaturing 8% polyacrylamide. Bar graph shows % e18a-CaV2.2 cDNA clone in the mix (white), and % e18a measured from densitometry analysis (black). Theoretical and experimental values are similar.
- Figure 2.
The splicing factor Rbfox2 represses e18a inclusion in a cell line. A, Genome alignments: Rbfox binding motif (U)GCAUG located upstream of e18a (Minovitsky et al., 2005). Putative Rbfox consensus sequence is conserved across all 12 species shown. B, Western blotting shows Rbfox protein in F11 cells transfected with siRNA against Rbfox2 (lanes 1-3) compared to control (lanes 4-6). Anti-Rbfox recognizes RNA binding motif (RRM) of all Rbfox protein isoforms (Gehman et al., 2011). The anti-GAPDH signal from the same membrane stripped and reprobed is shown. The experiment was run in triplicate, lanes 1-3 (siRNA) and lanes 4-6 (control). C, RT-PCR analysis of +18a and Δ18a CaV2.2 mRNAs from F11 cells transfected with Rbfox2-specific siRNA. Three independent transfections were analyzed per condition. E18a RT-PCR signal, as a percentage of total, was: 22.5 ± 2.3% (nontransfected F11) compared to 58.4 ± 2.5% in cells transfected with 100 nM siRNA to Rbfox2 (Student’s unpaired t test, p = 0.000129a). D, RT-PCR analysis of CaV2.2 mRNA extracted from nontransfected F11 cells (con), F11 cells transfected with siRNA to cyclophilin B (cycB siRNA), or transfected with nontargeting siRNA. Representative gel is shown with average % e18a signal in PCR amplification of F11 RNA from three experiments. Average +18a signals were similar: 22.5 ± 2.3% (con); 20.3 ± 2.3% (cycB); and 26.0 ± 1.7% (nontargeting siRNA; one-way ANOVA, F = 1.789, p = 0.246b).
- Figure 3.
Rbfox2 binding to CaV2.2 pre-mRNA is reduced in adult compared to P8-P11 sympathetic ganglia. A, CLIP steps to quantify Rbfox2 binding to its motif in the intron 5’ to e18a in CaV2.2 pre-mRNA in vivo. Cell lysis, protein cross-linking, nucleic acid fragmentation, DNase treatment to remove gDNA, Rbfox2 immunoprecipitation with polyclonal RBM9 antibody, RNA isolation from the immunocomplex, and first strand RT followed by qPCR. B, CLIP-RNA samples from SCG of postnatal (P8-P11) and adult mice were used for endpoint RT-PCR. Endpoint PCR products were amplified from first strand cDNA using two sets of primers, one set flanks sequence 5’ to e18a containing the Rbfox2 binding motif (5’ pr-e18a; upper gel) and another other one flanking a sequence 3’ to e18a (3’ pr; lower gel) was used as control. Upper gel, 5’-e18a primers amplify 99-bp products from postnatal and adult samples after DNase treatment both before (input; lane 2) and after Rbfox2-IP (Rbfox2; lane 3). Lower gel, 3’-e18a primers amplify 108-bp products from postnatal (P8-P11) and adult samples after DNase treatment before (input; lane 5) but not after Rbfox2-IP (Rbfox2; lane 6). 5’-e18a and 3’-e18a primers did not amplify products from IgG or H2O control samples (lanes 4, 7, and 8). Products were separated in 2% agarose gel (one biological triplicate, three mice each condition). Size markers are shown (bp; lanes 1 and 9). C, Melting and standard curves for 5’-e18a and 3’-e18a qPCRs establish the quality and efficiency of the two primer sets used for qPCR data in panel D, Melting curves for 5’-e18a and 3’-e18a PCR products were generated after the qPCR using a temperature gradient from 60°C to 95°C (+0.3°C/step). The single sharp peak corresponds to a single product. Standard curves show Ct values for each qPCR primer set and establish they have the same efficiency (slopes = -3.48 ± 0.07 and -3.51 ± 0.05 for 5’-e18a and 3’-e18a qPCRs, respectively). D, Percentage input method (Haring et al., 2007) used to quantify Rbfox2-IP RNA template by 5’-e18a qPCR and referenced to input before Rbfox2-IP. Each point represents a sample containing six SCG from three mice. The complete experiment (from SCG harvesting to qPCR) was performed in triplicate for each age group (P8-P11 and adult). Mean ± SE in % Rbfox2 relative to input for adult: 0.1872 ± 0.05; P8-P11: 0.5471 ± 0.07, p = 0.02c. Mean and SE values are indicated by horizontal bars.
- Figure 5.
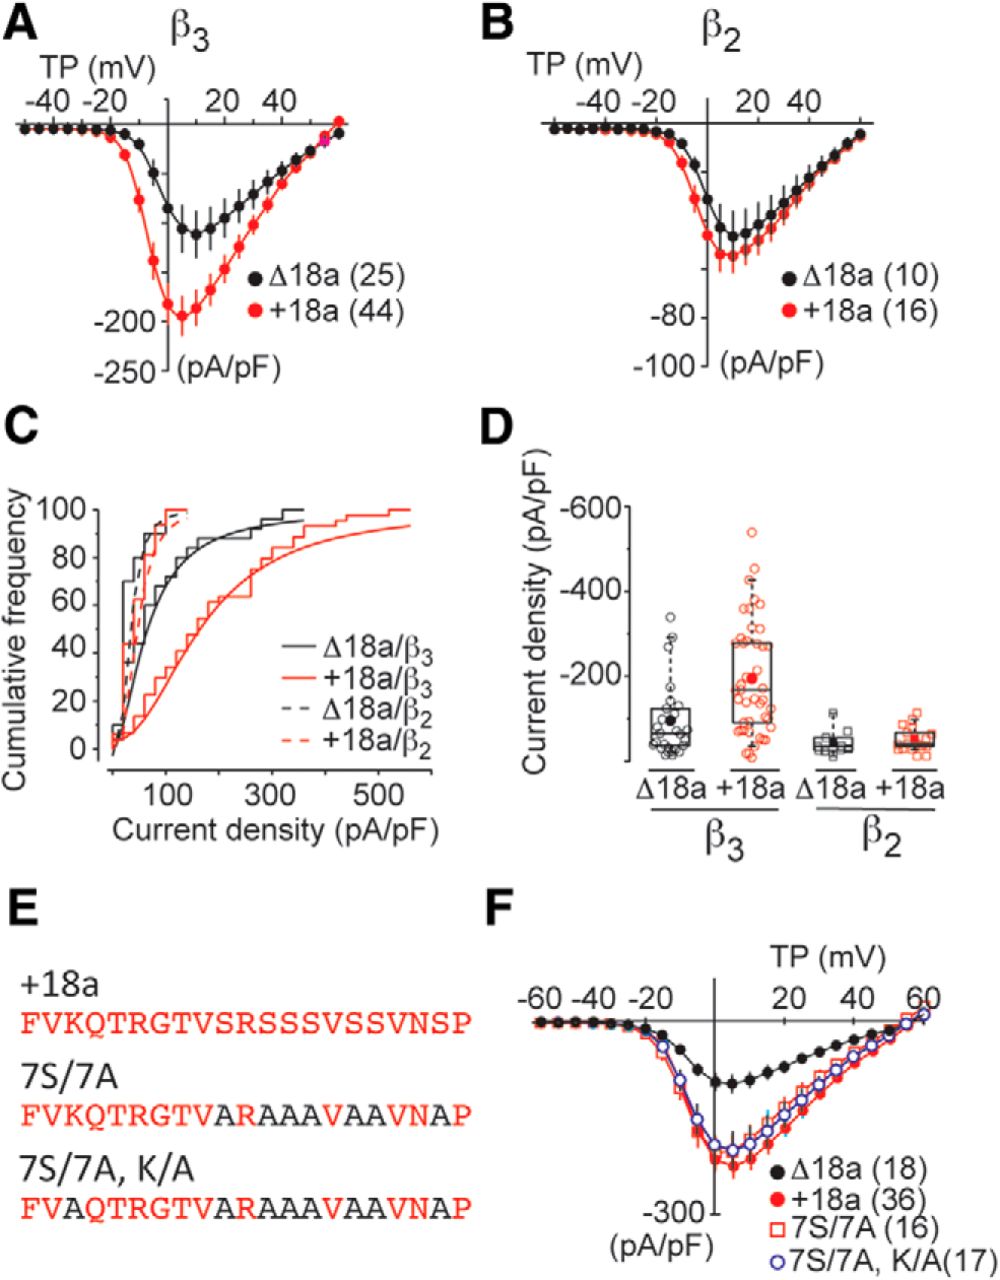
Larger current density in cells expressing e18a-CaV2.2 compared to Δ18a-CaV2.2. A, Peak CaV2.2 current−voltage relationships in tsA201 cells expressing Δ18a-CaV2.2 or e18a-CaV2.2 with CaVβ3 and CaVα2δ-1 subunits. Values are mean ± SE and N values are shown in parentheses. Data were compiled from multiple different transfections and gathered by three different experimenters. Individual current−voltage relationships were fit by Boltzmann-linear functions and Boltzmann activation midpoint (V1/2) and slope (k) estimated. V1/2 ± SE (mV); Δ18a-CaV2.2: -1.3 ± 0.9; e18a-CaV2.2: -4.8 ± 0.6 (Student’s unpaired t test, p = 0.0001e). k ± SE (mV); Δ18a-CaV2.2: 5.2 ± 0.5; e18a-CaV2.2 = 4.4 ± 0.25. B, CaV2.2 current−voltage relationships in cells expressing Δ18a-CaV2.2 or e18a-CaV2.2 with CaVβ2 and CaVα2δ-1. Values are average ± SE. C, Cumulative frequency plots of peak CaV2.2 current densities measured at 5 mV in cells expressing Δ18a-CaV2.2 or e18a-CaV2.2 with either CaVβ2 or CaVβ3. Bin size was 25 pA/pF for all plots. D, Peak CaV2.2 current density values are shown for individual cells (open symbols), mean (filled symbol), median (horizontal line), 25th-75th interquartile range (box), and whiskers (range) in tsA201 cells expressing Δ18a-CaV2.2 or e18a-CaV2.2 with CaVβ3 and CaVβ2. Mean (median) ± SE in pA/pF at 5 mV were for Δ18a-CaV2.2/CaVβ3: 95.9 (66.1) ± 17.1; e18a-CaV2.2/CaVβ3: 194.5 (167.7) ± 19.4; Δ18a-CaV2.2/CaVβ2: 42.9 (32.3) ± 9.4; e18a-CaV2.2/CaVβ2 53.9 (41.6) ± 7.1 (one-way ANOVA on ranks, Bonferroni corrected p = 0.0001f). E, Amino acid sequence of wild-type e18a exon (+18a), and two mutants. Seven serines were substituted with alanines (7S/7A) in both mutants; one mutant contains an additional lysine to alanine substitution (7S/7A, K/A). F, Peak CaV2.2 I-V relationships in cells expressing Δ18a-CaV2.2, e18a-CaV2.2 WT, e18a-CaV2.2 7S/7A, and e18a-CaV2.2 7S/7A, K/A. Mean and SE for each condition and N values in parentheses. Mean (median) ± SE in pA/pF at 5 mV for WTe18a-CaV2.2: -248.64 (232.1) ± 24.6; 7S/7A: -203.8 (250.3) ± 25.9; 7S/7A,K/A: -190.2 (170.2) ± 29.9 (one-way ANOVA on ranks, Bonferroni corrected, pWT:7S/7A = 0.262g and one-way ANOVA on ranks, Bonferroni corrected, pWT: 7S/7A,K/A = 0.213g).
- Figure 6.
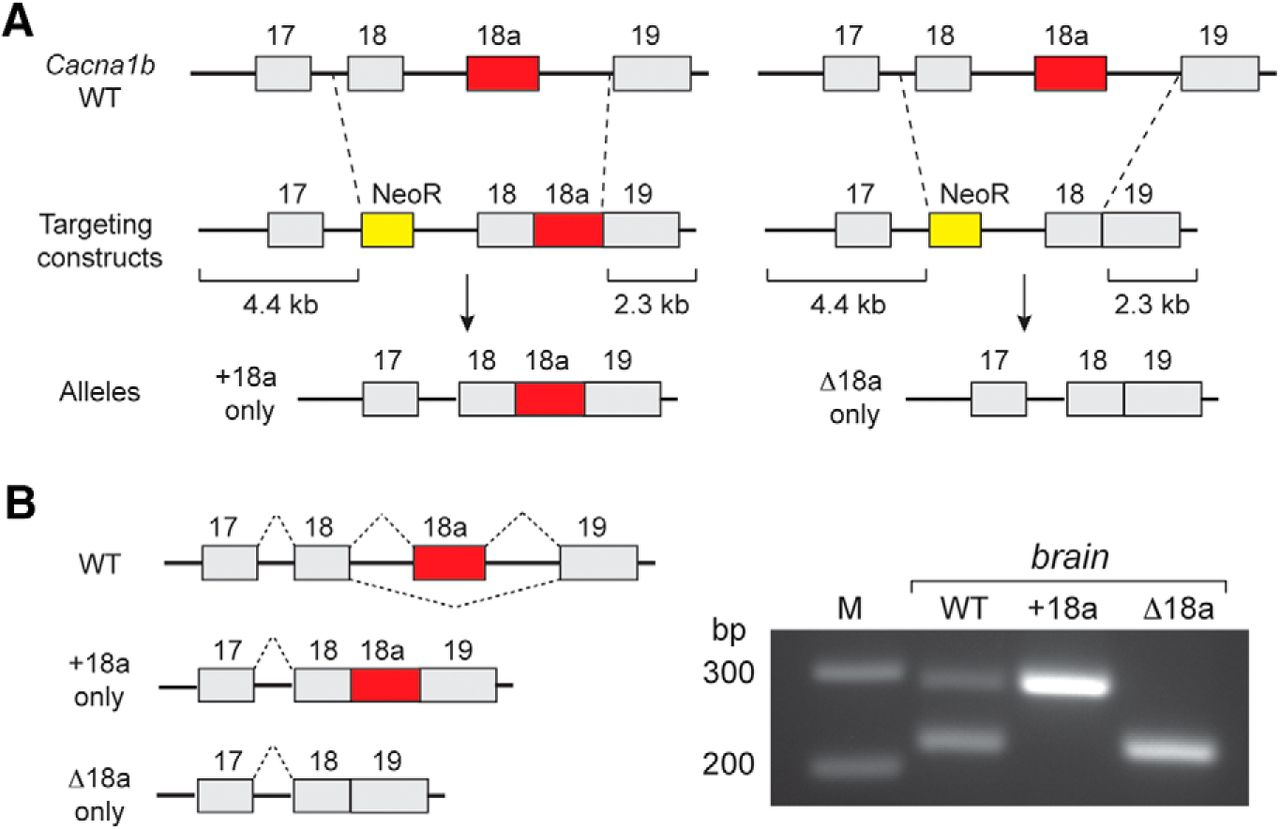
Mutation strategy to restrict exon choice at e18a locus of mouse Cacna1b gene. A, Schematic illustrates homologous recombination strategy used to generate two mouse strains that express either +18a-only (Cacna1btm3.1Dili) or Δ18a-only (Cacna1btm4.1Dili) CaV2.2 transcripts. Targeting constructs contained 4.4 kb (left) and 2.3 Kb (right) recombination arms, and a NeoR cassette was used to select for successful recombination events in embryonic stem cells. B, left, Splicing patterns in Cacna1b pre-mRNA of WT, +18a-only, and Δ18a-only mice. Right, RT-PCR products from WT, +18a-only CaV2.2, and Δ18a-only CaV2.2 mouse brain. Primers were located in e18 and e19 as described in Figure 1. Expected bands were observed: two different size PCR products corresponding to +18a and Δ18a from WT, one band corresponding to +18a from +18a-only samples, and one band corresponding to Δ18a from Δ18a-only samples.
- Figure 7.
CaV2.2 currents in +18a neurons are larger compared to Δ18a-only neurons. A, left, Cumulative frequency plots of peak CaV current density recorded at 20 mV in SCG neurons from Δ18a-only and +18a-only mice. Right, peak CaV current density at 20 mV (pA/pF). Mean (median) values ± SE were for Δ18a-only: 61.54 (60.1) ± 3.24; +18a-only: 73.3 (78.5) ± 6.94 (Mann-Whitney rank sum test p = 0.035ih). B, left, CaV currents evoked by voltage steps to +20 mV from -80 mV in the absence (Con) and presence of 2 μM ω-conotoxin GVIA (Ctx) in acutely dissociated SCG neurons. C, CaV2.2 (Ctx-sensitive; left) and non-CaV2.2 (Ctx-resistant; right) currents in SCG neurons from Δ18a-only (black) and +18a-only (red) mice. Values for CaV2.2 current density mean (median) ± SE for Δ18a-only: -39.43 (-37.8) ± 4.8 pA/pF; +18a-only: 63.1 (-64.0) ± 5.2 (Student’s t test, unpaired p = 0.009i). Right, Values for non-CaV2.2 current density mean (median) ± SE for Δ18a-only: -31.1 (-31.0) ± 2.3 pA/pF; e18a-only: -27.5 (-26.2) ± 2.2 (Student’s t test, unpaired p = 0.353i). Experimenter was blind to genotype until after all recordings and analyses were complete. All box plots: values shown are for individual cells (open symbols), mean (filled symbol), median (horizontal line), 25th-75th interquartile range (box), and whiskers (range).
- Figure 8.
Inactivation of CaV2.2 currents in sympathetic neurons is indistinguishable in Δ18a-only and +18a-only mice. A, Averaged, normalized, steady-state inactivation curves generated from sympathetic neurons from Δ18a-only and +18a-only mice. Recordings were performed in the presence of ω-agatoxin IVA (50 nM), and isradipine (10 μM) to block CaV2.1 and CaV1 currents, respectively. CaV2.2 currents were inactivated by 3-s prepulses to different membrane voltages (between -90 and + 20 mV in 10-mV increments) and then currents evoked by 25-ms test pulses to 20 mV to measure CaV2.2 channel availability. Curves were fit by Boltzmann functions and V1/2 values estimated. B, V1/2 values from individual cells (open symbols), mean (filled symbol), median (horizontal line), 25th-75th interquartile range (box), and whiskers (range). Mean (median) values ± SE in mV were for Δ18a-only: -22.5 (-26.1) ± 4.3, and e18a-only mice: -20.1 (-22.7) ± 4.5.


Tables
Cross (het X het) Cacna1btm3(e18a)DiLi Cacna1btm4(Δe18a)DiLi Litters 32 42 Progeny 259 322 Progeny/litter 8.1 7.7 Homozygous 60 82 Heterozygous 137 152 Wild type 61 88 Homozygous dead at weaning 1 1 Ratio of progeny observed (mut/mut:wt/mut:wt/wt) 0.9:2.2:1 0.9:1.7:1 Ratio of progeny expected (mut/mut:wt/mut:wt/wt) 1:2:1 1:2:1 Data structure Type of test CI95% (bootstrapping with replacement) a Normal Student’s unpaired t test Nontransfected:18.0 – 27.0%100 nM siRNA to Rbfox2: 53.5 – 63.3% b Normal One-way ANOVA/Bonferroni corrected Nontransfected:18.0-27.0%CycB:15.8-24.8%Nontargeting siRNA:22.7-29.3% c Normal Student’s t test unpaired % Rbfox2 relative to inputAdult:-0.05 to 0.42 (n = 3)P8-P11:0.23 to 0.86 (n = 3) d Not normal Mann-Whitney rank sum Control:40.28-47.7 pA/pFSCG siRNA injected:43.4-69.84 pA/pF e Normal Student’s t test unpaired V1/2 Δ18a/CaVβ3:-3.1 to -0.5 mV18a/CaVβ3:-5.6 to -3.6 mVk Δ18a/CaVβ3:4.2 to 6.2 mV18a/CaVβ3:3.9 to 4.9 mV f Not normal One way ANOVA on ranks, Bonferroni corrected Δ18a/CaVβ3:62.4-129.4 pA/pFε18a/CaVβ3:156.5-323.2 pA/pFΔ18a/CaVβ2:25.0-60.8 pA/pFε18a/CaVβ2:41.0-66.8 pA/pF g Not normal One-way ANOVA on ranks, Bonferroni corrected WTe18a:200.4-296.8 pA/pF7S/7A:153.0-254.6 pA/pF7S/7A, K/A:133.0-248.7 pA/pFΔ18a: 54.7-145.4 pA/pF h Not normal Mann-Whitney rank sum Δ18a-only:55.2-67 pA/pFe18a-only:59.7-86.9 pA/pF i Normal Student’s t test unpaired N-type current:Δ18a-only:-30.0 to -48.8 pA/pFe18a-only:-52.8 to -73.4 pA/pFNon-N-type current:Δ18a-only:-26.6 to -35.4 pA/pFe18a-only:-23.3 to -31.7 pA/pF j Normal Student’s t test unpaired V1/2 Δ18a-only: -31.05 to -14.05 (mV)e18a-only: -29.4 to -11.6 (mV)k Δ18a-only: -21.6 to -18.3 (mV)e18a-only: -19.97 to -13.57 (mV)
In this issue


