

Article Figures & Data
Figures
Figure 1. The developmental timeline and song circuit of zebra finches. A, Standard timeline for song development by juvenile male zebra finches. The sensorimotor stage begins around 35 dph. By ∼90 dph, a male’s song is largely crystalized, remaining stable for the duration of adult life. B, Example song spectrograms from experimental subjects. All birds were tutored to the same song pattern. C, An abridged sagittal schematic of the song network in the male zebra finch. Note that HVC contains two major populations of projection neurons (HVCX neurons and HVCRA neurons) and interneurons (HVCINT). LMAN, lateral portion of the magnocellular nucleus of the anterior nidopallium; RA, robust nucleus of the arcopallium; DLM, medial dorsolateral nucleus of the thalamus; NCM, caudal medial nidopallium; NIF, forebrain nucleus interface of the nidopallium; CMM, caudal medial mesopallium; Av, nucleus avalanche; field L; Ov, ovoidalis; Uva, nucleus uvaeformis; MLd, dorsal lateral nucleus of the mesencephalon; nXIIIts, nucleus XII, tracheosyringeal part.
- Figure 2.
Electrophysiolgical trace analysis. A, Example from an adult HVCX neuron. B, Example from an adult HVCRA neuron. All traces were analyzed using an automated script that measured a variety of features for each voltage trace. See Materials and Methods for a full list of the features analyzed, along with a detailed explanation of measurment procedures. Many of the depolarizing features (e.g., spike ampltide, adaptation rate) were analyzed at a current injection of 200 pA (blue traces). Many hyperpolarizing features (e.g., SR, rebound depolarization) were analyzed at −200 pA (black traces).
- Figure 3.
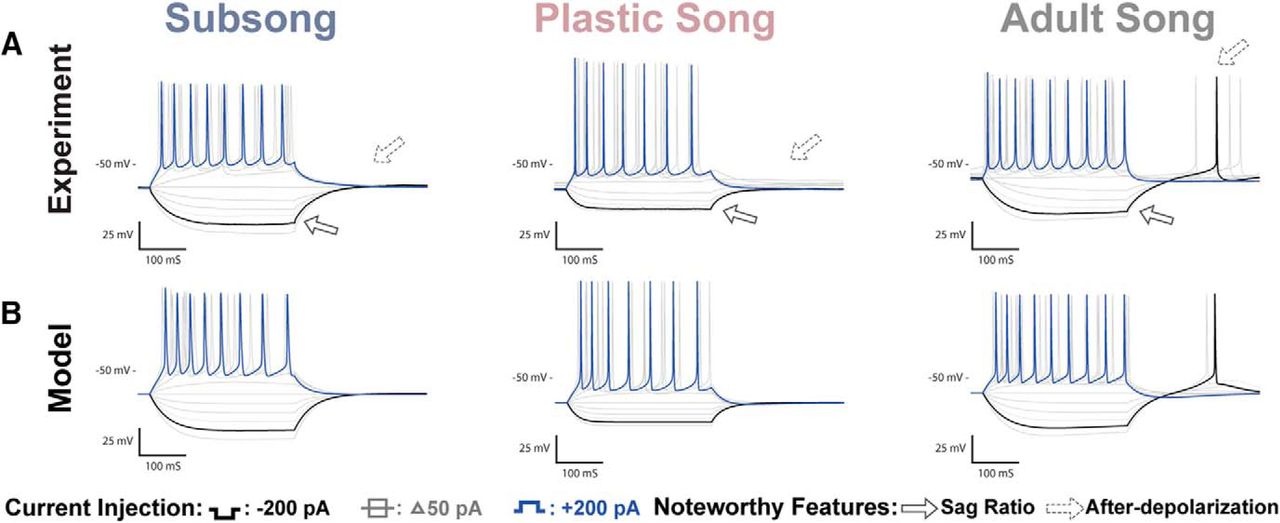
HVCX recordings and coresponding model traces. A, Voltage traces of HVCX neurons recorded at subsong, plastic song, or adult stages of development. Features that showed developmental changes included an increase in the Sag ratio (solid arrow) and an increase in rebound depolarization that resulted in rebound spiking (dotted arrow). B, Model traces of the three neurons depicted in A. The models attribute the sag to the h-current and rebound firing to the T-type Ca2+ current.
- Figure 4.
Developmental changes in HVCx neurons. Each scatterplot depicts a physiologic feature of interest where each point represents measurement from a single neuron. Outlined circles represent features measured from the experimentaly recorded traces presented in Figure 3. Outlined squares indicate the measurments from the modeled traces presented in Figure 3. The means and SEMs are ploted over each data set. Legends for developmental changes that were statistically significant are indicated in green font while features that were developmentally stable are indicated in red.
- Figure 5.
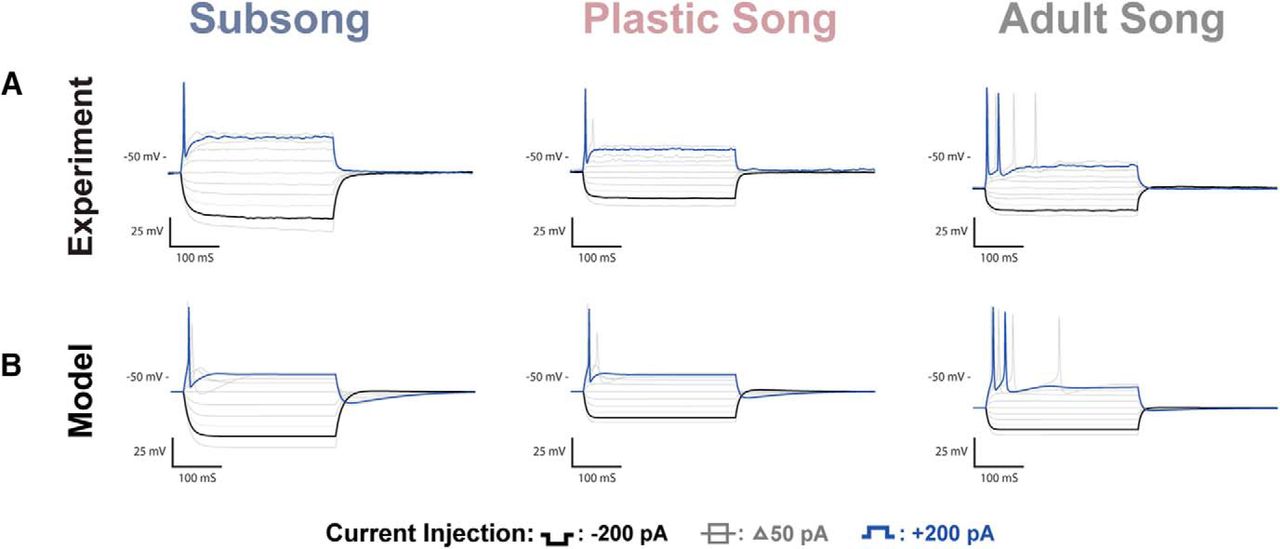
HVCRA recordings and coresponding model traces. A, Voltage traces of HVCRA neurons recorded at subsong, plastic song, or adult stages of development. One of the more prominent changes observed across development was a systematic decrease in the resting potential of HVCRA neurons. B, Modeled traces of the three neurons depicted in A. The models attributed the shift in resting potential to the leak current.
- Figure 6.
Developmental changes in HVCRA neurons. Each scatterplot depicts a physiologic feature of interest where each point represents the measurement from a single neuron. Outlined circles represent features measured from the experimentaly recorded traces presented in Figure 5. Outlined squares indicate the measurments from the modeled traces presented in Figure 5. The means and SEMs are plotted over each data set. Legends for developmental changes that were statistically significant are indicated in green font while features that were developmentally stable are indicated in red.
- Figure 7.
Developmental variation in ion channel parameters relative to adult. Model parameters that differed from the adult cell model are listed along the x-axis. Parameters that did not change are not displayed but can be found in Table 2. All parameter values were manually fit to representative data from Figures 3, 5. In this plot, conductance (g) values were first normalized to the capacitance of the model neuron. All values are displayed as a ratio comparing the juvenile model parameters to the adult (on a logarithmic scale). A value of zero indicates no difference relative to the adult. A value >0 indicates an increase in the magnitude of the parameter, and a value <0 indicates a decrease in the magnitude of the parameter relative to the adult. The models predict that HVCX and HVCRA neurons undergo different changes in ionic conductances as a function of development.
- Figure 8.
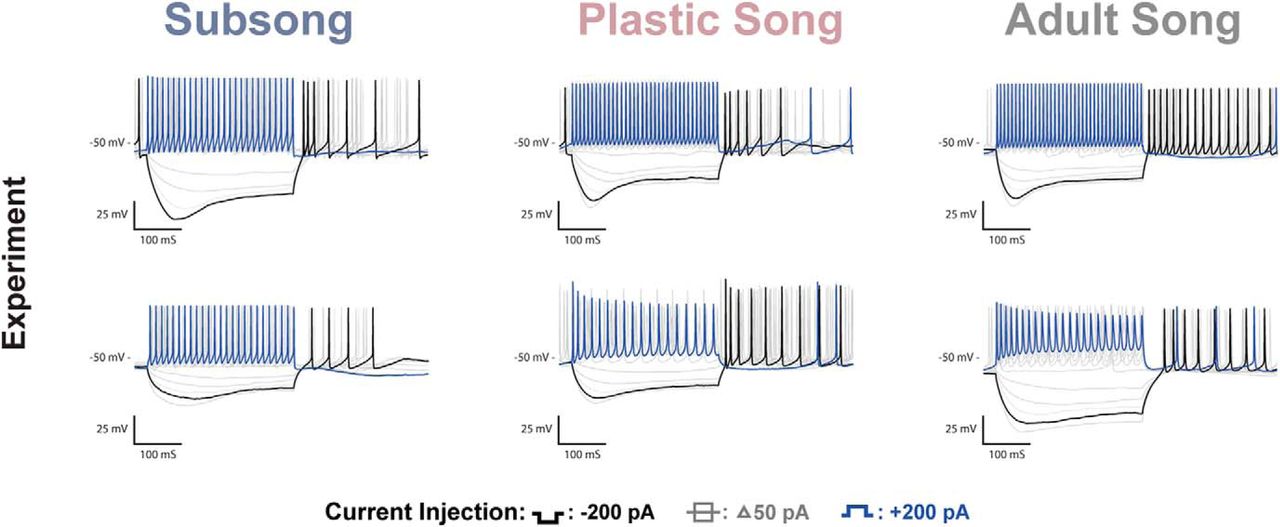
HVCINT neurons are comparatively stable across development. Voltage traces of HVCINT neurons recorded at subsong, plastic song, or adult stages of development. As a population, HVCINT neurons show variability in many of the measured features; however, the distributions of these measured features were relatively stable across developmental timepoints (Table 1). Cells from all three age groups show high firing frequencies, a large sag and rebound firing. The cells shown here provide examples of the variability observed in HCVINT neurons, however, there was no consistent classifiable difference across groups for any of the features analyzed.
- Figure 9.
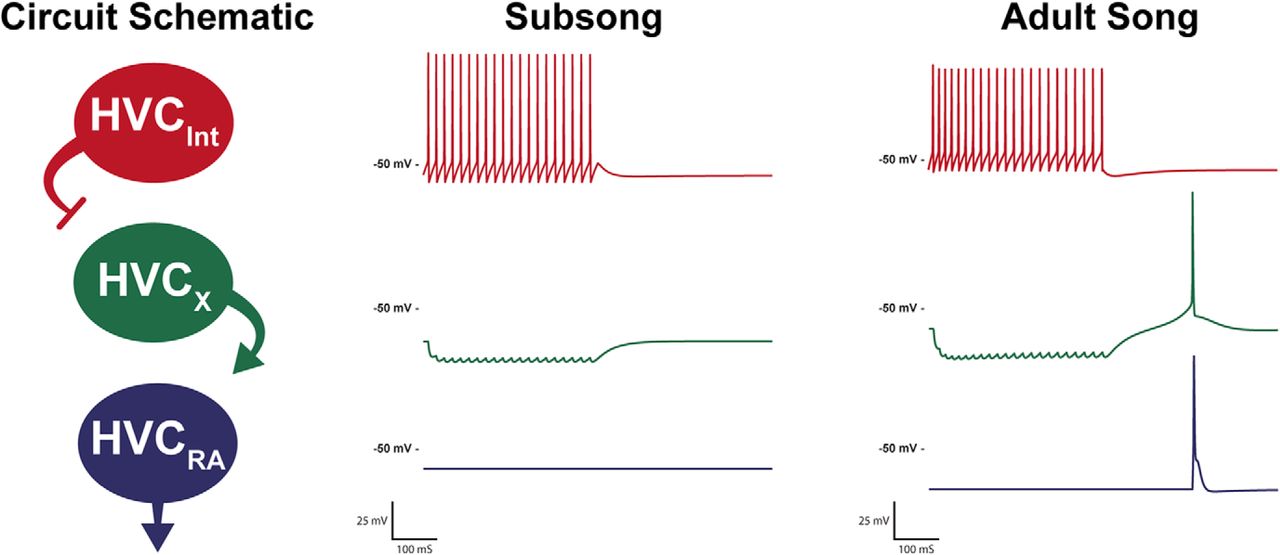
Developmental changes in channel properties can affect output of a simple circuit. The schematic depicts a simple circuit model in which the HVCINT neurons are stimulated, inhibiting HVCX neurons that in turn excite HVCRA neurons. The subsong and adult song model circuits vary only in their intrinsic physiology, maintaining the same synaptic weighting between neurons. The subsong circuit reflects the physiology of the neurons recorded during subsong, and the adult song circuit reflects the physiology of the neurons recorded during adult song. The circuit is not necessarily indicative of all microcircuitry within HVC, but rather, to show that the developmental changes in HVC intrinsic physiology observed in the present experiments are of sufficient magnitude to have a significant influence on the output of even a very simple, but plausible, HVC local circuit.


Tables
HVCX Subsong Plastic song Adult Subsong vs plastic Subsong vs adult Plastic vs adult Resting potential (mV) −67 ± 1.51 −68 ± 1.54 −67 ± 1.50 p = 1.00 p = 1.00 p = 1.00 MembraneTime Constant (ms) 33 ± 4.28 39 ± 7.10 43 ± 7.13 p = 1.00 p = 0.84 p = 1.00 MembraneInput Resistance (MΩ) 282 ± 52.65 115 ± 22.72 296 ± 39.11 p = 0.04 p = 1.00 p = 0.01 MembraneCapacitance (pF) 156 ± 38.95 308 ± 38.54 167 ± 28.68 p = 0.03 p = 1.00 p = 0.03 Vdrop (mV) 30 ± 2.72 26 ± 2.31 46 ± 5.37 p = 1.00 p = 0.02 p = 0.00 SR 0.01 ± 0.0013 0.02 ± 0.0046 0.04 ± 0.0065 p = 0.17 p = 0.00 p = 0.03 Rebound depolarization (mV) 1.7 ± 0.39 3.3 ± 0.52 40.5 ± 11.10 p = 1.00 p = 0.00 p = 0.00 Spike frequency (Hz) 27 ± 4.61 19 ± 2.31 28 ± 2.65 p = 0.26 p = 1.00 p = 0.25 Adaptation rate 1.55 ± 0.11 1.79 ± 0.21 1.75 ± 0.13 p = 0.82 p = 1.00 p = 1.00 Spike amplitude (mV) 65 ± 4.98 82 ± 5.61 84 ± 4.17 p = 0.06 p = 0.03 p = 1.00 Spike width (ms) 2.19 ± 0.14 1.56 ± 0.15 1.87 ± 0.16 p = 0.02 p = 0.45 p = 0.46 Spike latency (ms) 56 ± 23.69 36 ± 9.46 19 ± 3.90 p = 1.00 p = 0.33 p = 1.00 HVCRA Resting potential (mV) −61 ± 2.05 −66 ± 0.94 −77 ± 0.57 p = 0.01 p = 0.00 p = 0.00 MembraneTime Constant (ms) 28 ± 4.09 17 ± 2.48 18 ± 2.53 p = 0.10 p = 0.11 p = 1.00 MembraneInput Resistance (MΩ) 364 ± 36.04 339 ± 55.66 327 ± 51.93 p = 1.00 p = 1.00 p = 1.00 MembraneCapacitance (pF) 83 ± 21.28 66 ± 22.17 68 ± 12.24 p = 1.00 p = 1.00 p = 1.00 Vdrop (mV) 30 ± 6.55 29 ± 6.01 28 ± 3.80 p = 1.00 p = 1.00 p = 1.00 SR 0.01 ± 0.0041 0.02 ± 0.0036 0.01 ± 0.0009 p = 0.18 p = 1.00 p = 0.01 Rebound depolarization (mV) 1.2 ± 0.60 1.8 ± 0.55 1.1 ± 0.20 p = 1.00 p = 1.00 p = 0.76 Spike frequency (Hz) 10 ± 5.12 10 ± 3.84 7 ± 2.12 p = 1.00 p = 1.00 p = 1.00 Adaptation rate 2.05 ± 0.40 1.01 ± 0.28 1.34 ± 0.18 p = 0.09 p = 0.27 p = 1.00 Spike amplitude (mV) 50 ± 6.39 64 ± 3.29 77 ± 3.59 p = 0.16 p = 0.00 p = 0.05 Spike width (ms) 1.94 ± 0.18 1.75 ± 0.29 1.82 ± 0.17 p = 1.00 p = 1.00 p = 1.00 Spike latency (ms) 15 ± 8.07 92 ± 40.53 17 ± 5.72 p = 0.05 p = 1.00 p = 0.02 HVCINT Resting potential (mV) −60 ± 5.87 −58 ± 1.68 −57 ± 1.44 p = 1.00 p = 1.00 p = 1.00 Vdrop (mV) 40 ± 6.46 37 ± 3.21 47 ± 6.34 p = 1.00 p = 1.00 p = 0.51 SR 0.13 ± 0.0267 0.11 ± 0.0190 0.13 ± 0.0204 p = 1.00 p = 1.00 p = 1.00 Rebound depolarization (mV) 68.3 ± 5.52 61.6 ± 9.25 56.0 ± 2.87 p = 1.00 p = 0.85 p = 1.00 Spike frequency (Hz) 79 ± 18.06 77 ± 14.18 105 ± 13.55 p = 1.00 p = 0.84 p = 0.51 Adaptation rate 1.20 ± 0.08 1.44 ± 0.18 1.18 ± 0.07 p = 0.83 p = 1.00 p = 0.49 Spike amplitude (mV) 67 ± 6.00 64 ± 3.02 58 ± 2.17 p = 1.00 p = 0.25 p = 0.53 Spike width (ms) 0.85 ± 0.13 1.16 ± 0.15 0.98 ± 0.09 p = 0.38 p = 1.00 p = 0.91 Spike latency (ms) 6 ± 2.86 5 ± 1.22 4 ± 0.00 p = 1.00 p = 1.00 p = 1.00 The means, SEMs, and significance values (Bonferroni-corrected pairwise comparisons) for all features mesured of each cell type across each age group.
Model parameter Subsong HVCRA Plastic song HVCRA Adult song HVCRA Subsong HVCX Plastic song HVCX Adult song HVCX VL (mV) −62 −62 −77 −72 −75 −63 VH (mV) −43 −43 −43 −43 −43 −43 gL (nS) 4 7 7 5.6 5 5 gCaL (nS) 1 1 1 1 1 1 gNa (nS) 560 440 300 1500 3100 2300 gK (nS) 80 80 500 160 180 120 gA (nS) 5 5 5 5 5 5 gM (nS) 160 100 32 11.8 53 15.4 gCaT (nS) 0.1 1 1 2 2 3.8 gSK (nS) 1 5 32 0.4 2.8 2.1 gh (nS) 0.8 2.2 1.6 0.4 4.1 2.25 wh 0.95 0.95 0.95 0.3 0.99 0.17 C (pF) 60 55 58 220 245 260 τh (ms) 1.2/(αh + βh) 1.2/(αh + βh) 1.2/(αh + βh) 1.2/(αh + βh) 1.2/(αh + βh) 1.2/(αh + βh) σm (mV) -5 -5 -10 -5 -8 -4 θm (mV) -30 -32 -35 -36 -35 -38  (ms)
(ms)15 8 15 10 10 10 τz (ms) 75 75 75 26.25 45 75 θz (mV) −29 −30 −45 −35 −39 −39 θn (mV) −32 −30 −30 −30 −30 −30 σn (mV) −5 −5 −7 −10 −7 −6 σs (mV) −8.6 −8.6 −8.6 −8.6 −8.6 −8.6 θs (mV) −13 −13 −13 −13 −13 −13 f 0.01 0.01 0.01 0.01 0.01 0.01 ks (μM) 0.4 0.4 0.4 0.4 0.4 0.4 bCa (μM) 0.05 0.05 0.05 0.05 0.05 0.05 θaT (mV) −59 −59 −59 −59 −59 −59 σaT (mV) −6 −6 −6 −6 −6 −6 The parameter values for the model traces presented in Figures 3, 5.

In this issue


