

Article Figures & Data
Figures
- Figure 1.
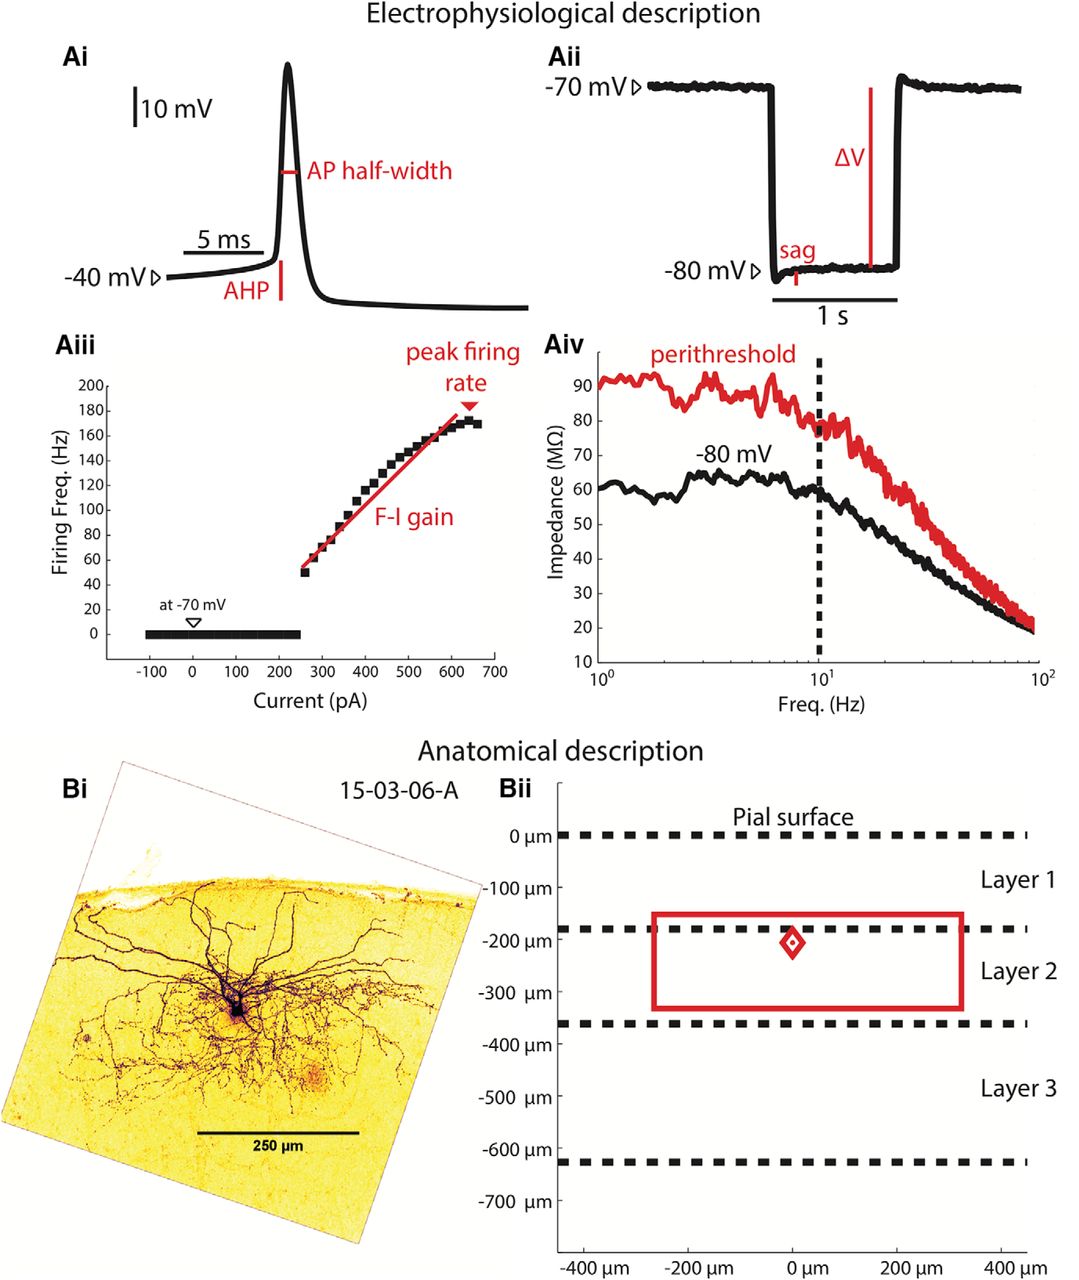
MEC interneuron electrophysiological and anatomic characterization. Ai, Depolarizing current was injected to elicit firing and resulting APs were characterized. AP half-widths are measured at half the height of the AP (using the AP initiation upstroke, or “knee,” as the base). The duration between passing the half-height on the depolarizing phase and passing the half-height on the hyperpolarizing phase is the AP half-width. The AHP is measured as the membrane potential difference between the AP knee and the most hyperpolarized membrane potential immediately following the AP. Aii, One-second-long hyperpolarizing pulses are injected to hyperpolarize the cell from −70 mV to approximately −80 mV. The resulting voltage deflection ΔV is divided by the injected current ΔI to calculate the input resistance. The sag ratio was defined as ΔV/(sag+ ΔV). Aiii, The F-I relationship was described injecting progressively increasing current pulses and measuring the resulting firing rate. The slope between the first non-zero F-I trial and the peak firing trial is the F-I gain. The fastest firing rate elicited by the current pulses is the peak firing rate. Aiv, The impedance spectra are measured at both −80 mV and near threshold are used to calculate the impedance change. The impedance between 1 and 10 Hz of the perithreshold spectrum is divided by the same impedance band of the rest spectrum. The dashed line indicates the upper band for the impedance change calculation, 10 Hz. Bi, A z-stack projection of a biocytin filled, Alexa Fluor 488-labeled MEC interneuron is used to determine the location of the soma and estimate the extent of the axonal tree. Bii, The neuron in Bi is described using a diamond to indicate the depth of the soma (relative to the pial surface) and a rectangle to describe the laminar and columnar extent of the neuron’s axonal projection, both in red. Dashed line indicate the average depth of layers 1–3. This neuron has a soma at the layer 1/2 border (∼200 µm deep), and its axonal tree extends from ∼170 to 350 µm in depth and is ∼500 µm wide.
- Figure 2.
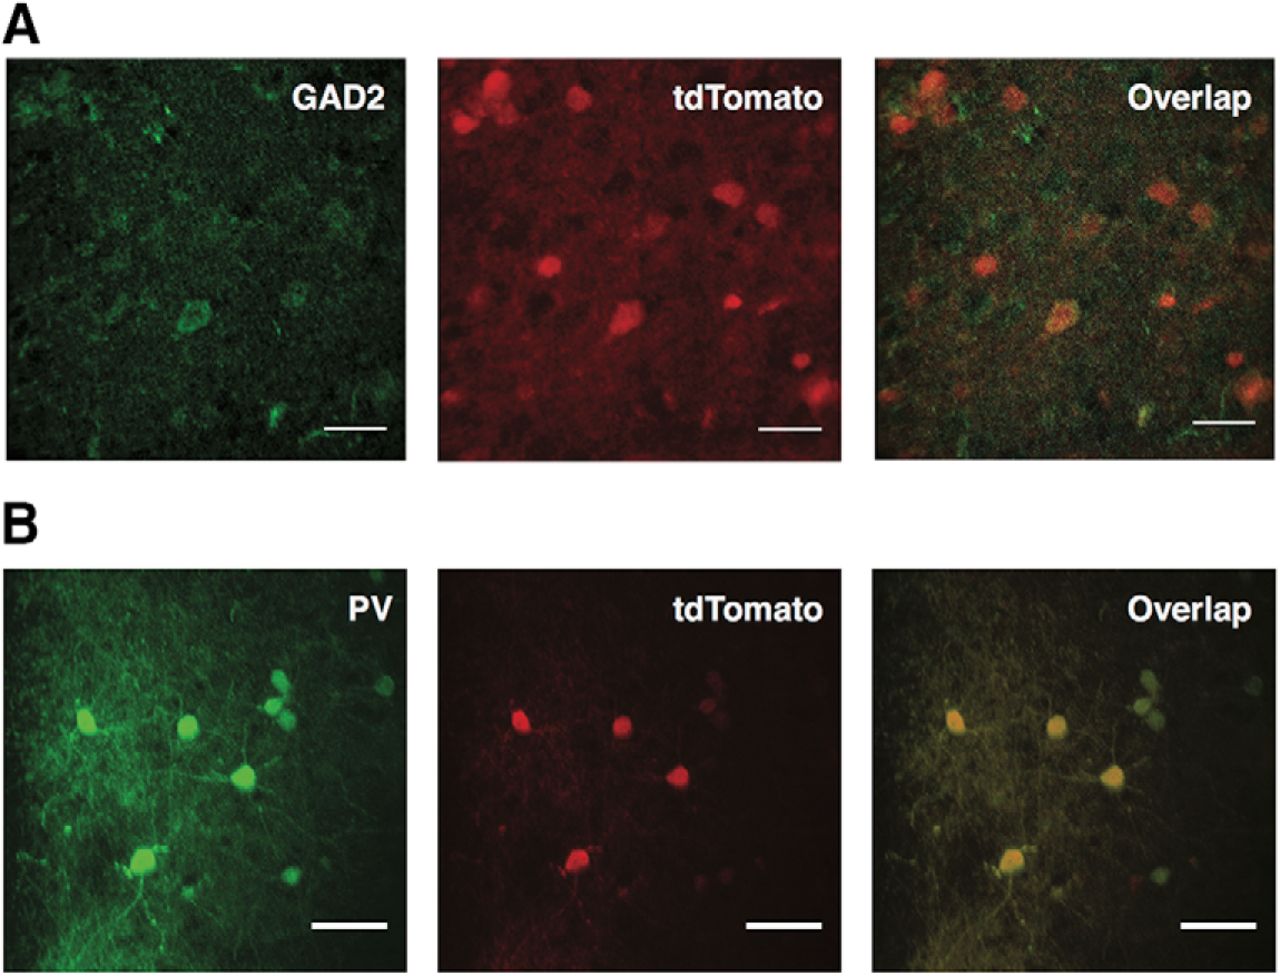
Immunohistochemical validation of transgenic mouse lines. A, Representative image showing overlap of GAD2 labeling with tdTomato cells of transgenic mice. The great majority of the tdTomato-positive cells are labeled for GAD2 as well (91.2% of 74 cells counted; n = 2 animals). Scale bar: 25 μm. B, Representative image showing overlap of staining for PV with tdTomato cells. Nearly all tdTomato-positive cells are labeled for PV as well (97% of 74 cells counted; n = 2 animals). Scale bar: 15 μm.
- Figure 3.
Histogram distributions for electrophysiological and anatomic characteristics. The distributions of the 20 electrophysiological and anatomic characteristics for all 106 superficial MEC interneurons are displayed in histogram form, with each characteristic binned into 12 groups.
- Figure 4.
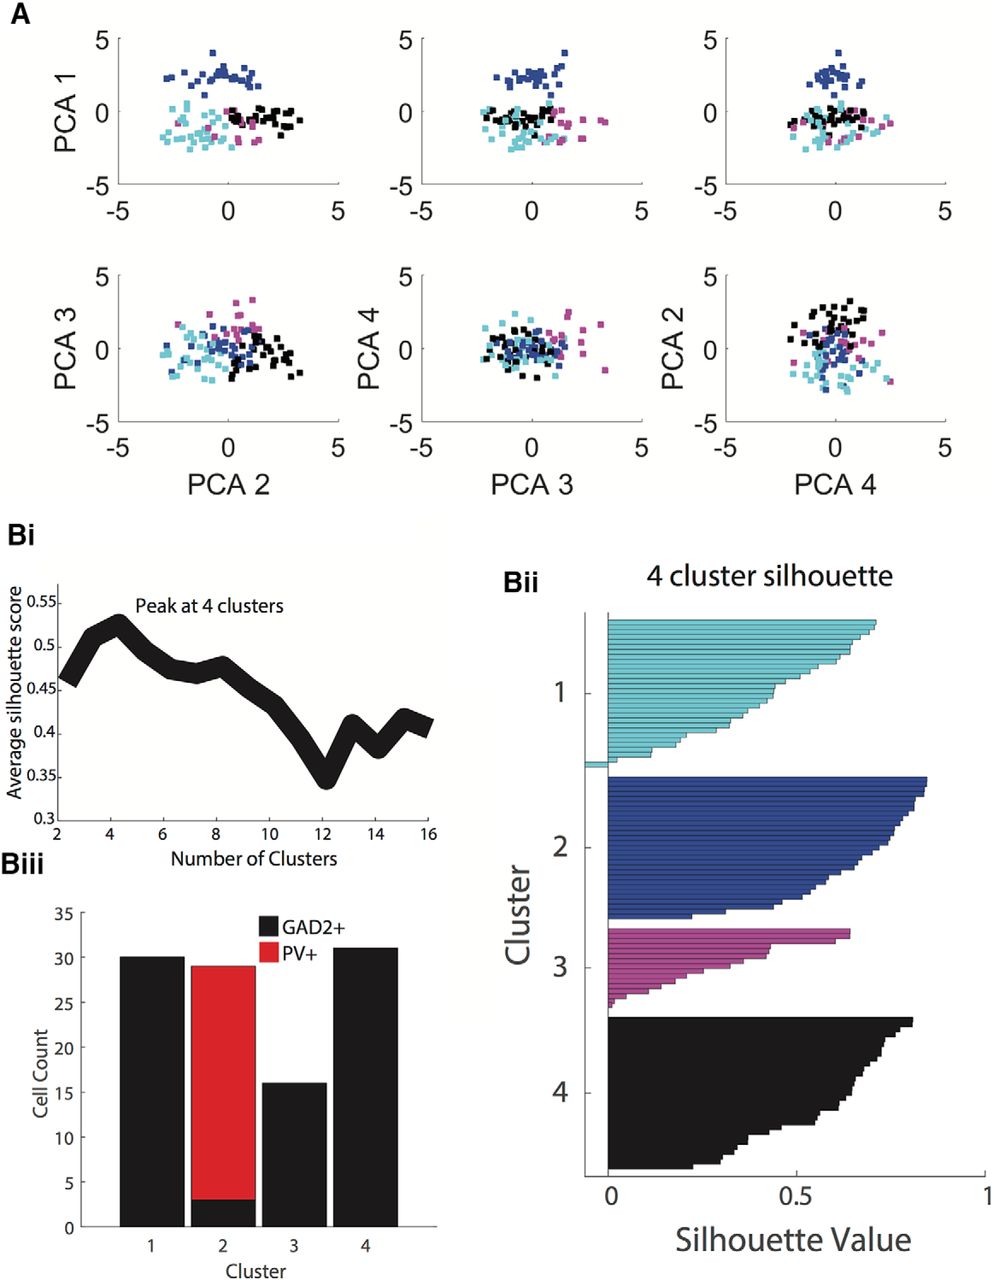
PCA and k-means clustering analysis. A, The first four principal components of combined electrophysiological and anatomic data are plotted in all possible combinations. These four principal component dimensions were used to conduct k-means clustering analysis. Cluster 1 is cyan, cluster 2 is blue, cluster 3 is magenta and cluster 4 is in black. Bi, To determine the optimal number of clusters for k-means clustering, the average silhouette score (measure of distance for within-cluster points compared to outside-of-cluster points) was calculated for k-means clustering analyses using between 2 and 16 clusters. The highest silhouette score was achieved using four clusters, suggesting that this is the optimal cluster number. Bii, The silhouette value (score) for each point is shown in their corresponding cluster. Low or negative silhouette values indicate points that fit poorly within its cluster. Biii, In a four-cluster analysis, PV+ cells were located entirely in cluster 2, with 26 out of 29 cells being PV+. This again suggests that using four clusters for the k-means clustering analysis is optimal.
- Figure 5.
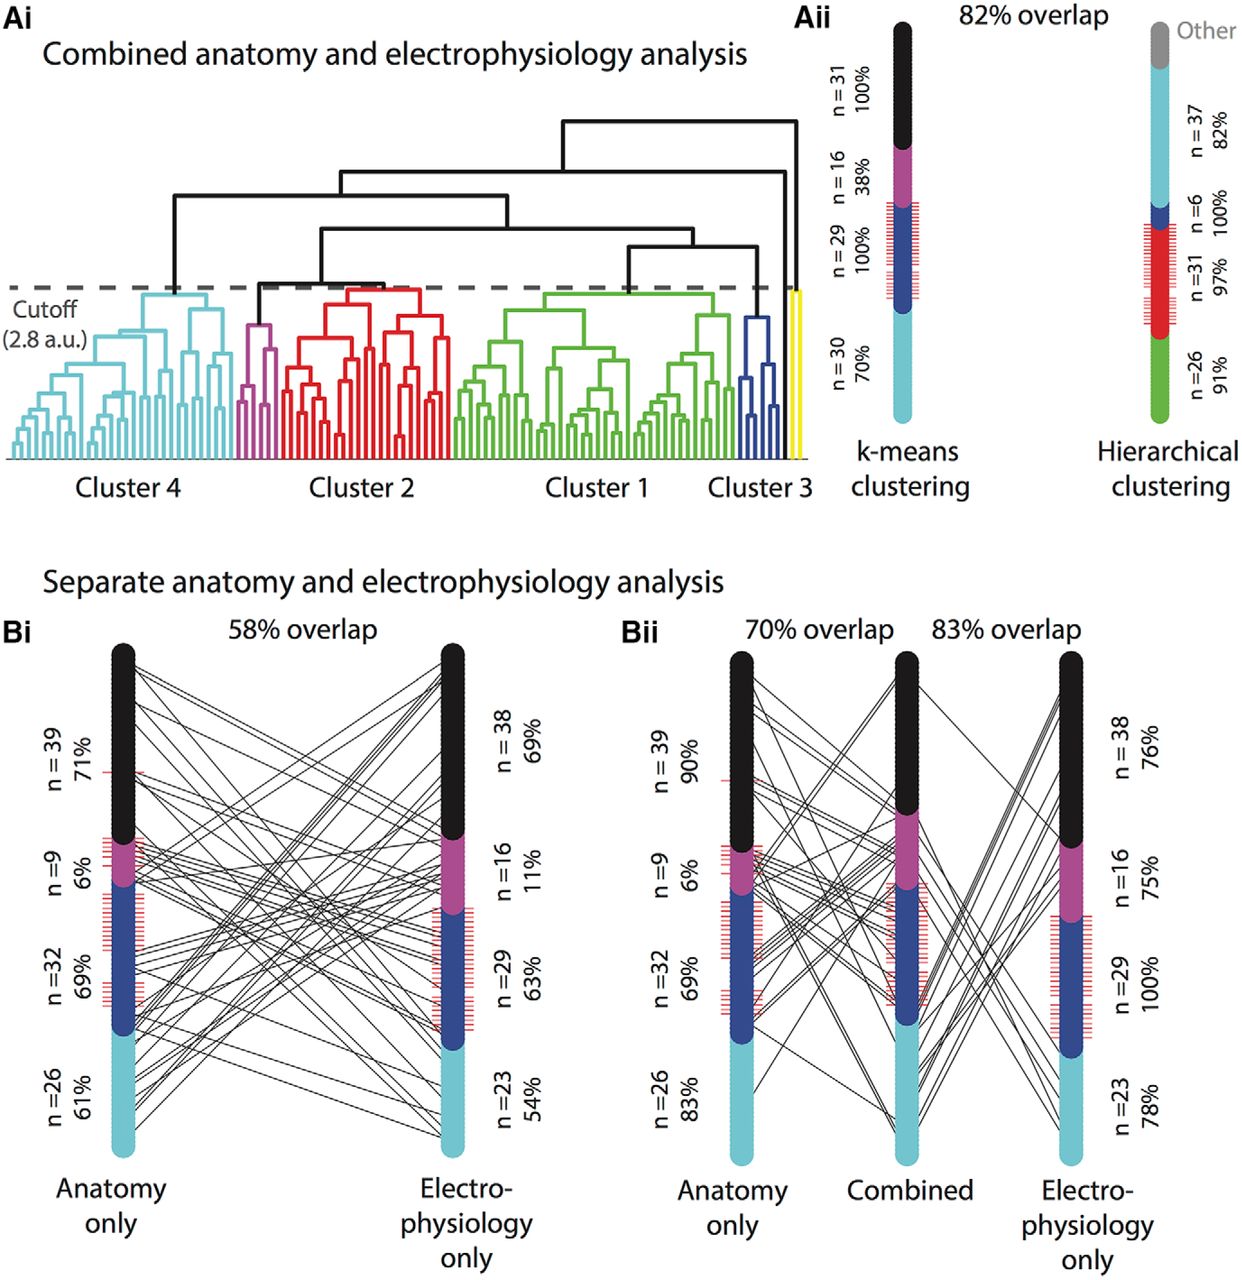
Comparison of different clustering methods: k-means clustering versus hierarchical clustering, combined versus separate anatomic and electrophysiological analysis. A, UPGWA hierarchical clustering using combined anatomic and electrophysiological data yielded similar results to k-means clustering. Ai, UPGWA hierarchical dendrogram separates the 106 interneurons sequentially by the least squared Euclidean distance. Each branching point represents the splitting of a cluster into two clusters, until the clusters are comprised of single neurons. Each end point thus represents a single interneuron. Branch points above the height of 2.8 (a.u.), in this case representing 52% of the maximum distance in the population, are considered to represent distinct clusters. These resulted in eight different clusters. To match up these clusters with those derived from the k-means clustering analysis, all possible permutations were tested. The permutation with maximum overlap, shown per the labels for each cluster, was used for further analysis. Aii, The clustering distribution for hierarchical clustering is shown on the left bar, with each color corresponding to the branch on the dendrogram. The four clusters with less than four interneurons were grouped into the gray “other” category. The clustering distribution for the k-means clustering is shown on the right, in the same color scheme used throughout the rest of the chapter. For each distribution, red whiskers represent the PV+ interneurons. Black lines connect corresponding interneurons that were categorized differently in each distribution, therefore fewer lines indicate greater overlap between clustering methods. The two clustering methods showed 82% overlap, meaning 82% of interneurons were categorized within the same cluster. The number of interneurons in each cluster is noted beside each cluster, along with the percentage of that cluster which was classified into their corresponding cluster in the other clustering method. For example, cluster 1 in the hierarchical clustering method has 26 interneurons, 91% of which were also classified into cluster 1 in the k-means clustering method. B, K-means clustering was used to cluster all 106 interneurons using only one type of data: either anatomic or electrophysiological. Bi, Distribution plots for purely anatomic clustering and purely electrophysiological clustering are shown as in Aii. Both anatomic and electrophysiological clustering were matched to the combined, four-cluster k-means clustering distribution, as described in Materials and Methods. The overlap between purely anatomic and purely electrophysiological clustering was 58%, indicating that some, but not most, interneurons could be matched to different anatomic and electrophysiological profiles. Bii, The same anatomic and electrophysiological distributions as in Bi are shown in comparison with the combined distribution in the center. There is a 70% overlap between the combined distribution and the anatomic, whereas there is 83% overlap between the combined and electrophysiological distribution.
- Figure 6.
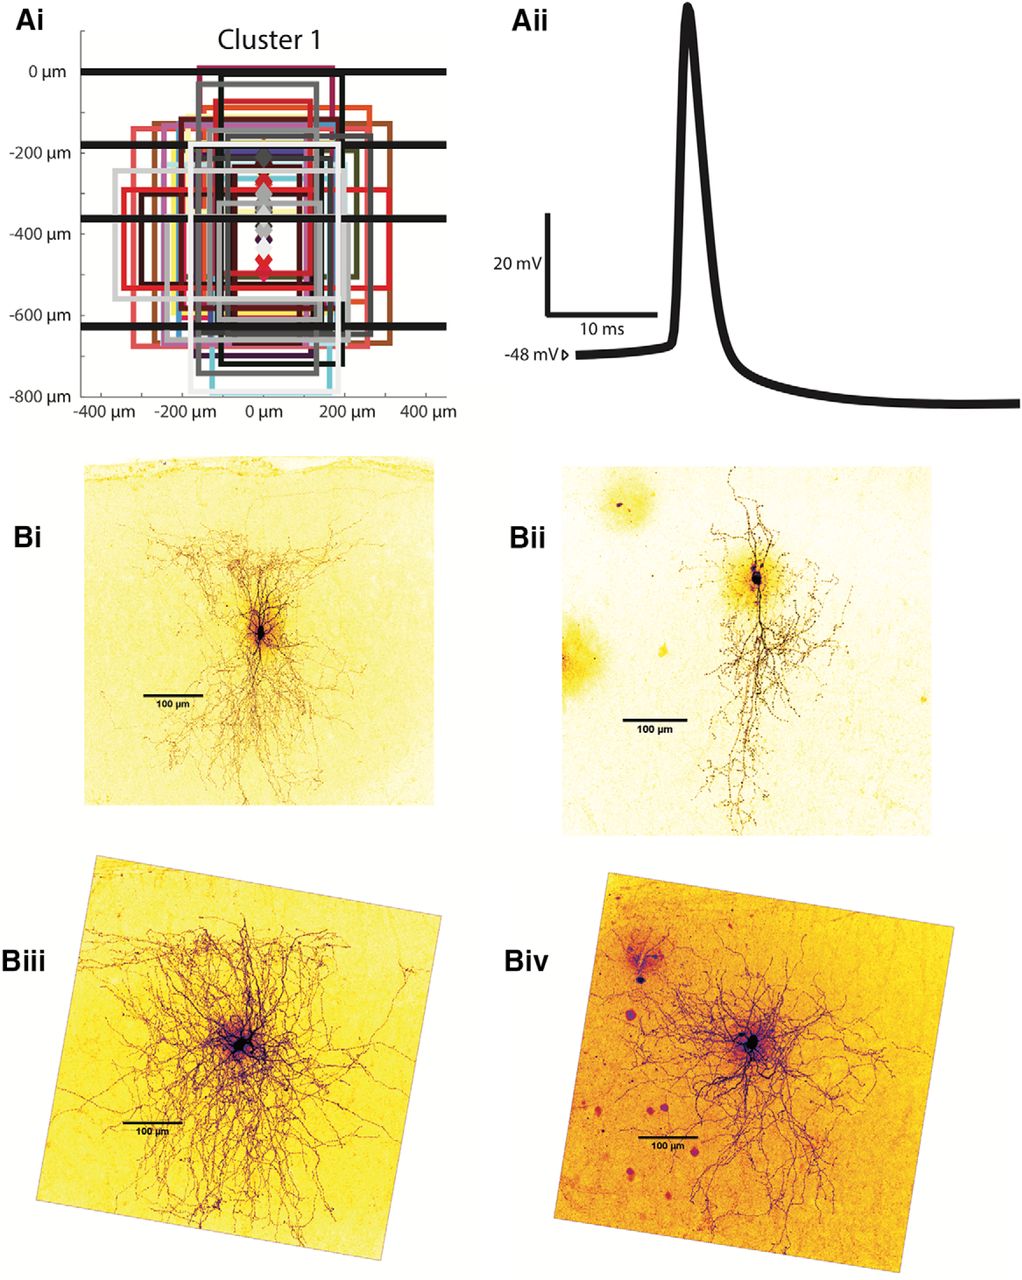
Examples of cluster 1 interneurons. Ai, Anatomic characteristics for all cells in cluster 1 are shown in the same abstract form as in Figure 1Bii. Aii, An example of an averaged AP from a characteristic cluster 2 interneuron. Bi-Biv, Z-stack projections of cluster 1 Alexa Fluor 488-labeled MEC interneurons are shown as examples.
- Figure 7.
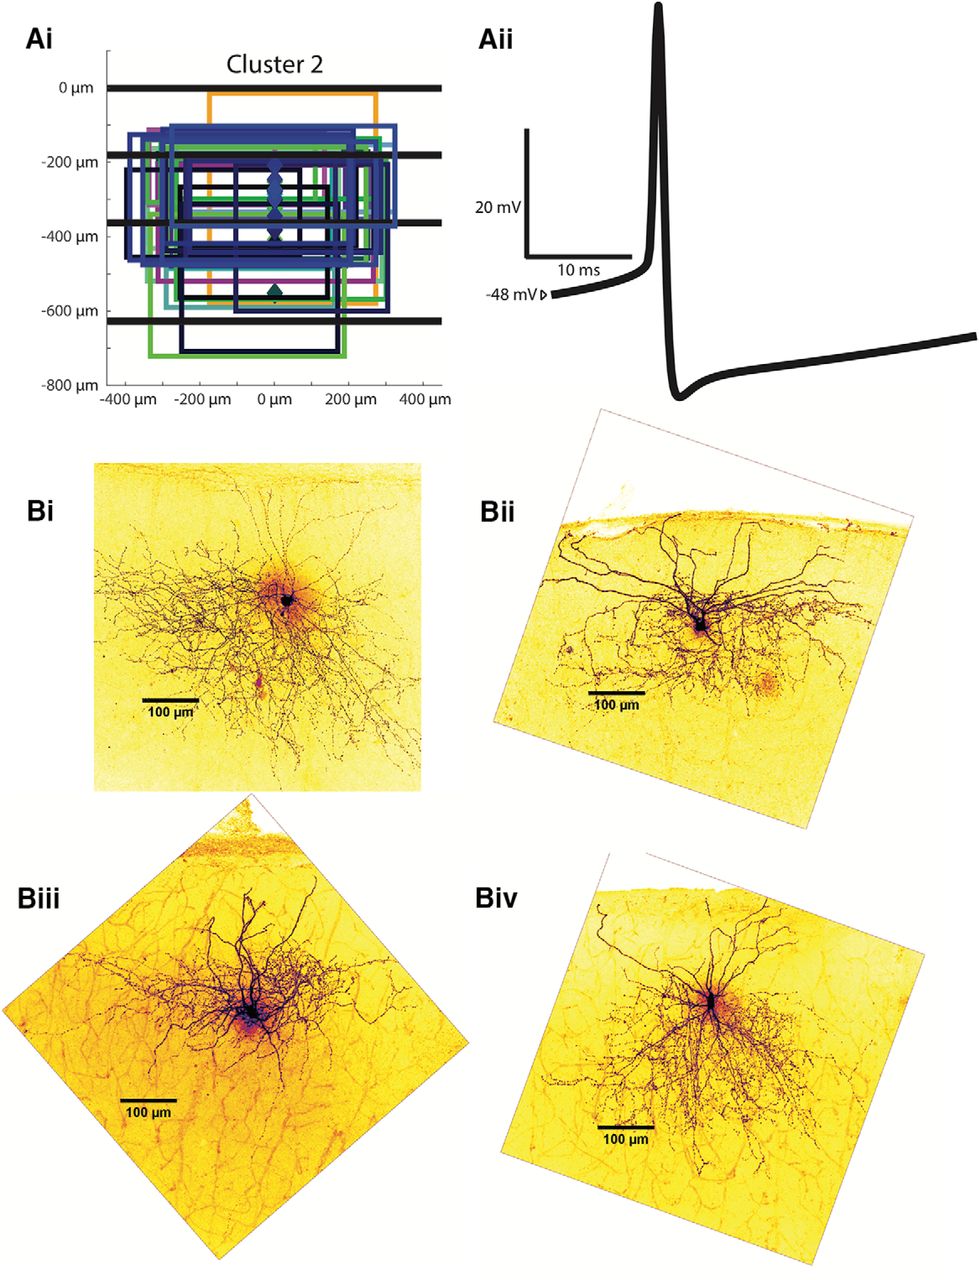
Examples of cluster 2 interneurons. Ai, Anatomic characteristics for all cells in cluster 2 are shown in the same abstract form as in Figure 3.1Bii. Aii, An example of an averaged AP from a characteristic cluster 2 interneuron. Bi-Biv, Z-stack projections of cluster 2 Alexa Fluor 488-labeled MEC interneurons are shown as examples.
- Figure 8.
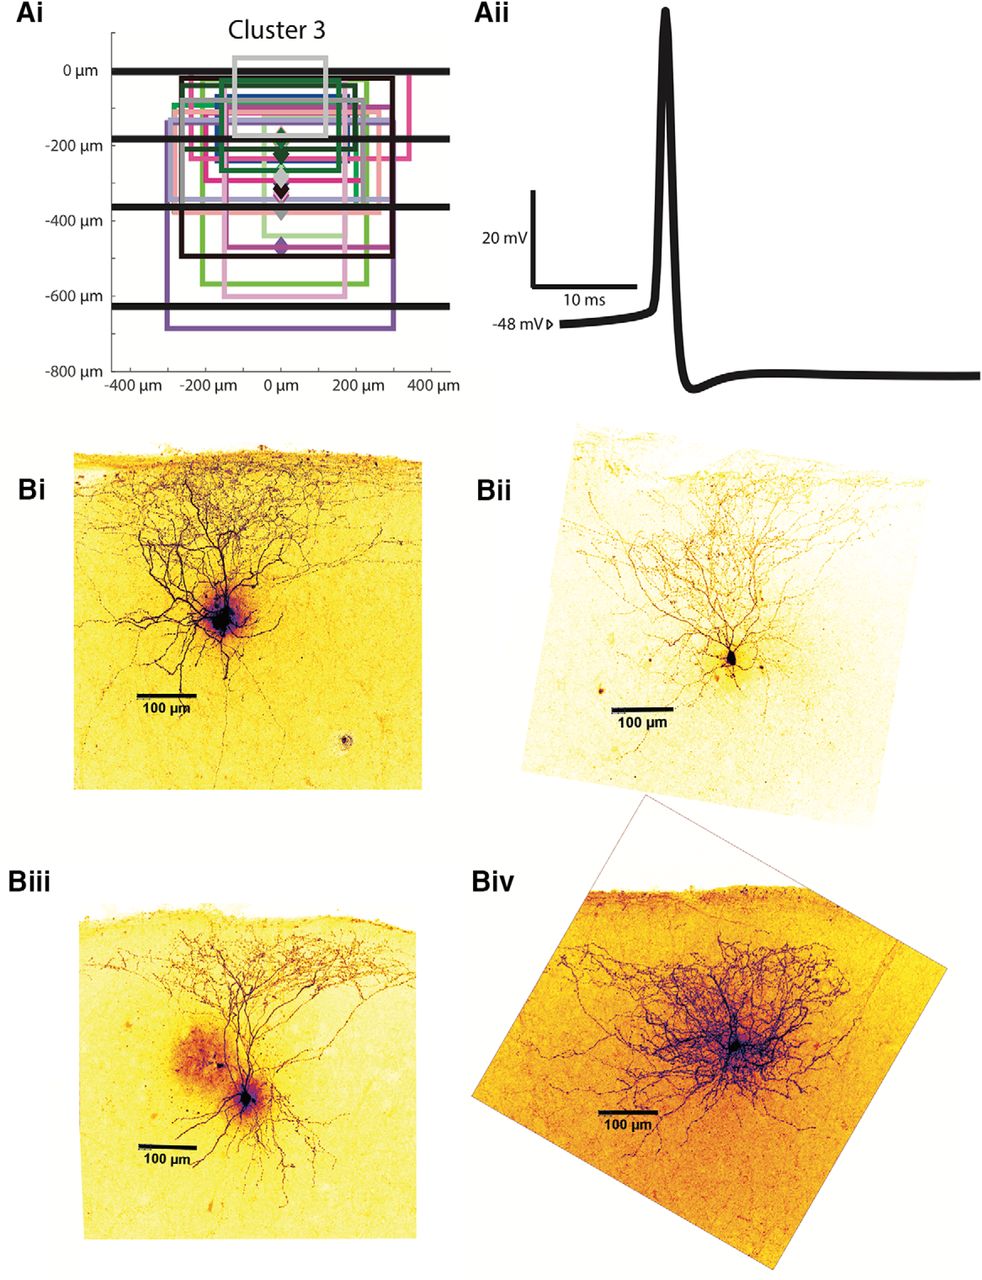
Examples of cluster 3 interneurons. Ai, Anatomic characteristics for all cells in cluster 3 are shown in the same abstract form as in Figure 3.1Bii. Aii, An example of an averaged AP from a characteristic cluster 3 interneuron. Bi-Biv, Z-stack projections of cluster 3 Alexa Fluor 488-labeled MEC interneurons are shown as examples.
- Figure 9.
Examples of cluster 4 interneurons. Ai, Anatomic characteristics for all cells in cluster 4 are shown in the same abstract form as in Figure 3.1Bii. Aii, An example of an averaged AP from a characteristic cluster 4 interneuron. Bi-Biv, Z-stack projections of cluster 4 Alexa Fluor 488-labeled MEC interneurons are shown as examples.
- Figure 10.
Interneuron groups of the superficial MEC. A, Layer 2/3 projecting, slow firing interneurons. Ai, Representations of the average soma depth and axonal projections are shown. Aii, A 1-s spike train of a representative cell. Aiii, A typical F-I curve for this population, with the inset showing an average AP (vertical scale bar is 20 mV and horizontal scale bar is 10 ms). B, Layer 2/3 projecting, fast firing interneurons. Bi-Biii, Same as A. C, Layer 1/2 projecting interneurons. Ci-Ciii, Same as A. D, Layer 2 projecting interneurons. Di-Diii, Same as A.


Tables
Characteristic F value p value Input resistance (MΩ) 72.93 1.0E-15 Time constant, falling (ms) 75.86 2.4E-16 Time constant, rising (ms) 76.05 2.2E-16 Rebound amplitude (mV) 25.08 1.5E-05 Firing threshold (mV) 12.26 6.5E-03 Resting membrane potential (mV) 37.26 4.1E-08 A.P. rise time (ms) 57.61 1.9E-12 A.P. half-width (ms) 69.29 6.1E-15 Spike AHP (mV) 16.44 9.2E-04 F-I gain (Hz/nA) 42.62 3.0E-09 Peak firing rate (Hz) 74.60 4.4E-16 Lowest firing rate (Hz) 54.33 9.6E-12 Rheobase (pA) 59.90 6.2E-13 Adaptation ratio 22.01 6.5E-05 Change in impedance (%) 14.42 2.4E-03 Sag ratio 33.51 2.5E-07 Soma depth (µm) 42.38 3.3E-09 Axonal tree, superficial (µm) 29.87 1.5E-06 Axonal tree, deep (µm) 29.77 1.5E-06 Axonal tree, width (µm) 25.09 1.5E-05 All characteristics were tested for normality using the Kolmogorov–Smirnov test, and none were found to be normally distributed. The nonparametric Kruskal--Wallis test was used to compare groups, and the F value and p value for each test is shown.
- Table 2.
Electrophysiological and anatomic characteristics for all four interneuron clusters with statistical comparisons
Cluster 1 2 3 4 1,2 1,3 1,4 2,3 2,4 3,4 n 30 29 16 31 Input resistance (MΩ) 220.2 85.7 274.4 155.1 12.3 5.1 14.9 6.2 p < 0.01 n.s. p < 0.05 p < 0.01 p < 0.01 p < 0.01 Time constant, falling (ms) 13.7 5.1 15.8 8.9 0.8 0.2 0.9 0.4 p < 0.01 n.s. p < 0.01 p < 0.01 p < 0.01 p < 0.01 Time constant, rising (ms) 14.1 5.2 16.2 9.5 0.8 0.2 1.0 0.4 p < 0.01 n.s. p < 0.01 p < 0.01 p < 0.01 p < 0.01 Rebound amplitude (mV) 0.75 0.41 1.48 0.62 0.08 0.03 0.20 0.10 p < 0.05 n.s. n.s. p < 0.01 n.s. p < 0.01 Firing threshold (mV) −38.7 −36.7 −40.8 −35.6 0.9 1.0 1.1 1.0 n.s. n.s. n.s. p < 0.05 n.s. p < 0.05 Resting membrane potential (mV) −66.3 −71.4 −55.5 −66.8 1.0 1.0 2.1 1.1 p < 0.01 p < 0.01 n.s. p < 0.01 p < 0.05 p < 0.01 A.P. rise time (ms) 0.273 0.192 0.253 0.292 0.006 0.003 0.013 0.009 p < 0.01 n.s. n.s. p < 0.01 p < 0.01 n.s. A.P. half-width (ms) 1.085 0.526 0.832 1.151 0.038 0.010 0.067 0.047 p < 0.01 n.s. n.s. p < 0.01 p < 0.01 p < 0.05 Spike AHP (mV) 16.2 19.9 19.3 20.8 1.0 0.5 1.0 0.7 p < 0.05 n.s. p < 0.01 n.s. n.s. n.s. F-I gain (Hz/nA) 153.0 281.9 373.9 162.0 18.9 15.8 51.4 13.0 p < 0.01 p < 0.01 n.s. n.s. p < 0.01 p < 0.01 Peak firing rate (Hz) 57.4 279.2 111.5 75.3 5.1 8.6 8.4 5.6 p < 0.01 p < 0.01 n.s. p < 0.01 p < 0.01 n.s. Lowest firing rate (Hz) 10.6 79.2 13.7 13.9 2.3 6.0 3.0 2.3 p < 0.01 n.s. n.s. p < 0.01 p < 0.01 n.s. Rheobase (pA) 185.7 380.7 118.8 262.6 15.7 22.2 12.3 13.2 p < 0.01 n.s. p < 0.05 p < 0.01 p < 0.05 p < 0.01 Adaptation ratio 0.783 0.878 1.335 0.917 0.153 0.007 0.730 0.153 p < 0.01 n.s. n.s. p < 0.01 p < 0.05 n.s. Sag ratio 0.936 0.945 0.888 0.936 0.006 0.004 0.013 0.008 n.s. p < 0.05 n.s. p < 0.01 n.s. p < 0.01 Change in impedance (%) 64.8 133.1 136.5 51.6 10.6 12.7 15.7 9.2 p < 0.01 p < 0.01 n.s. n.s. p < 0.01 p < 0.01 Soma depth (µm) 327.0 304.9 274.6 191.6 14.2 16.1 19.7 8.9 n.s. n.s. p < 0.01 n.s. p < 0.01 p < 0.05 Axonal tree, superficial (µm) 296.4 168.4 107.0 114.0 21.5 19.8 33.2 25.2 p < 0.01 p < 0.01 p < 0.01 n.s. n.s. n.s. Axonal tree, deep (µm) 446.4 298.0 318.0 252.9 23.0 16.4 35.6 25.7 p < 0.01 p < 0.05 p < 0.01 n.s. n.s. n.s. Axonal tree, width (µm) 361.4 513.0 440.6 472.2 21.7 12.8 30.8 20.1 p < 0.01 n.s. p < 0.01 n.s. n.s. n.s. The electrophysiological and anatomic characteristics of all four clusters are shown, along with the associated p values from a Kruskal--Wallis test (as described in Materials and Methods). Each row shows the average value for a different electrophysiological or anatomic measurement. The standard error associated with that measurement is located below the average value. Each column for the left half of the table shows the measurements for each of the four clusters. On the right half of the table, the p value for the Kruskal--Wallis test is shown for matched pairs. For example, column “1,2” shows the p values for the test between clusters 1 and 2 for each characteristics; p < 0.05 are highlighted in blue. Tests that showed no significance are shown as n.s.
In this issue


