

Article Figures & Data
Figures
- Figure 1.
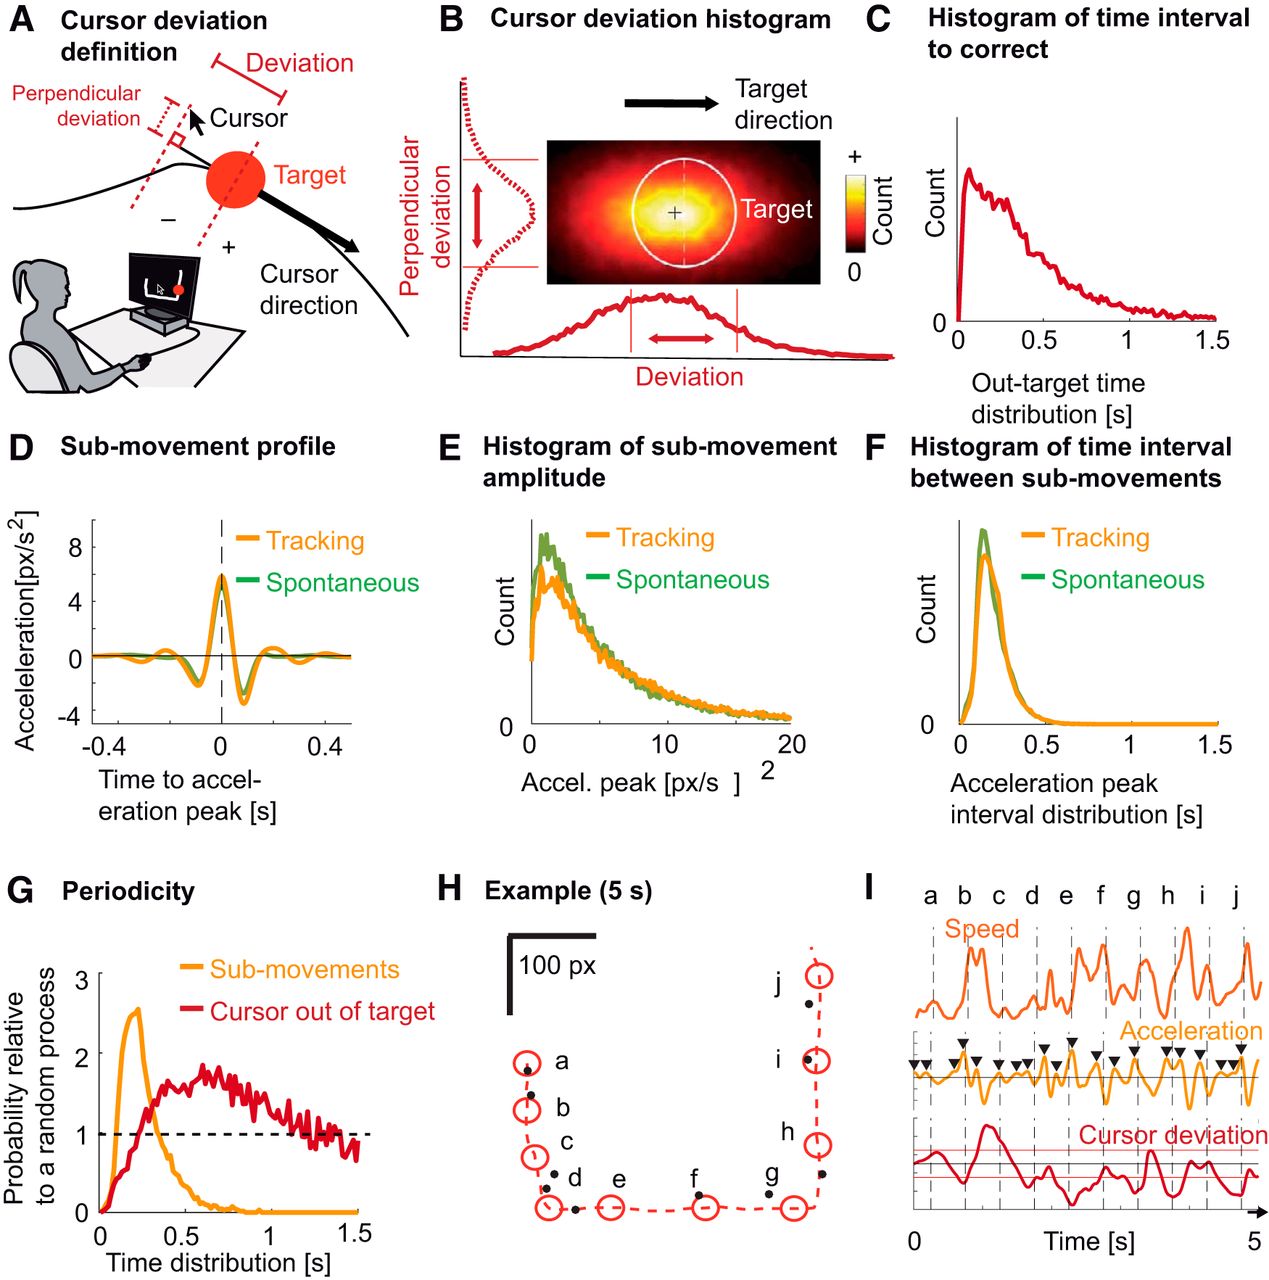
Cursor deviation and hand kinematics (submovements). A, Experimental setup and definition of cursor deviation. Subjects used a mouse cursor (a typical arrow) to track a target (red circle) moving on a computer screen along a visible trajectory. Cursor deviation was defined as the cursor’s position relative to the position of the target along the tangent to the target’s direction. Perpendicular deviation was defined as the deviation relative to the tangent. B, Distribution of cursor deviations around the target (white circle), averaged across subjects. The lower curve corresponds to the distribution of the cursor deviation used in the rest of the manuscript. The left (dashed) curve corresponds to the perpendicular deviation. Red vertical lines indicate target borders. C, Distribution of the time needed to correct cursor deviations: from the time the cursor left the target area to the time it went back in, averaged across subjects. D, Average hand acceleration profile, time-locked to submovements for tracking (yellow trace) and for spontaneous tracing (green trace), averaged across subjects. E, Distribution of the magnitude of hand acceleration peaks for tracking (yellow trace) and spontaneous tracing (green trace), averaged across subjects. F, Distribution of time intervals between submovements for tracking (yellow trace) and spontaneous tracing (green trace), averaged across subjects. G, Probability of time intervals relative to a random (Poisson) process for two types of events: submovements (yellow trace) and cursor leaving the target area (red trace). H, An example of 5 s of tracking. The target is depicted by red circles shown every 500 ms (a-j). The dashed red trace shows the trajectory of the target, moving from a to j. The corresponding cursor positions are depicted by black dots. I, Hand speed (orange trace), hand acceleration (yellow trace), and cursor deviation (dark red trace) for the 5 s depicted in H. Peaks selected by the peak selecting algorithm are depicted by black triangles. Horizontal red lines show target borders. Vertical dashed lines correspond to target positions in H.
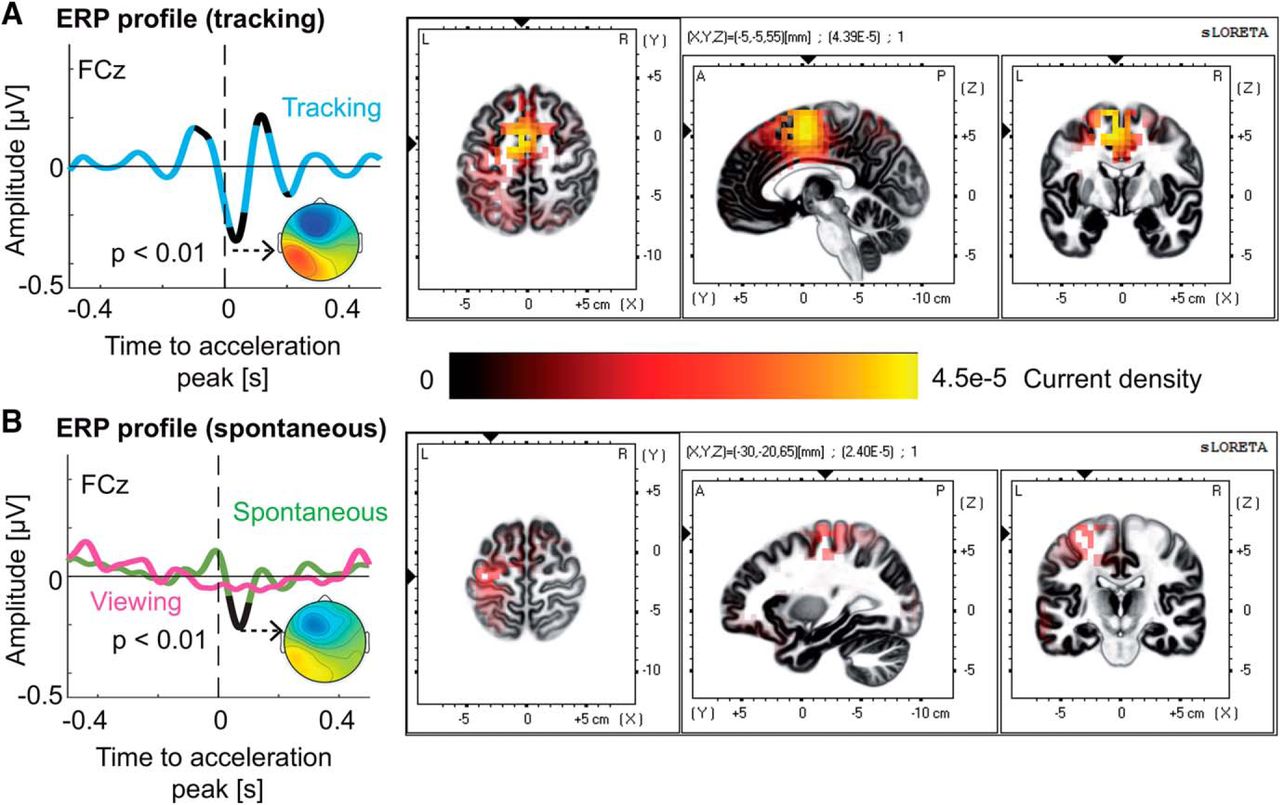
- Figure 2.
ERP time-locked to submovements A, The ERP time-locked to submovements for the tracking (cyan trace) conditions, averaged across subjects. The ERP showed a significant trough localized in the medial frontal gyrus (right inset). Significant portions of the ERP are shown in black (p < 0.01, Bonferroni corrected). B, The ERP time-locked to hand acceleration for the spontaneous (green trace) and viewing (magenta trace) conditions, averaged across subjects. During the spontaneous condition, the ERP showed a significant trough (black segment, p < 0.01, Bonferroni corrected), localized in the left (contralateral) precentral gyrus. The ERP for different directions of the target (orange for north, blue for east, purple for south and yellow for west; see inset) can be found in Extended Data Figure 2-1. No discernible differences in ERP amplitude were observed.
- Figure 3.
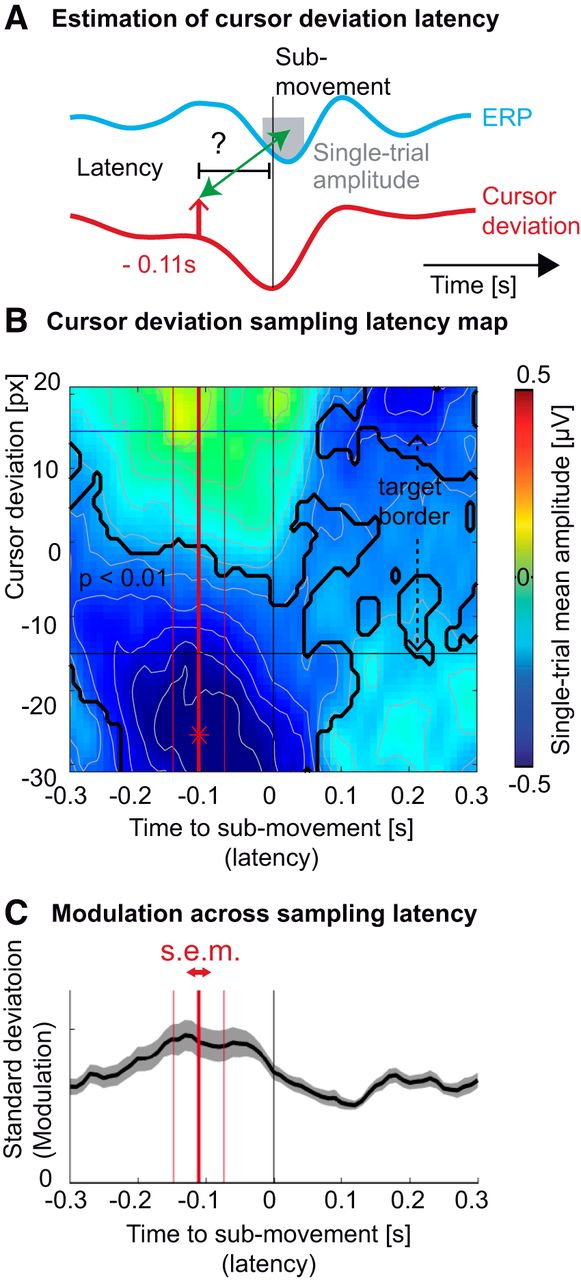
Latency of the sampling of cursor deviation. A, Average profile of the ERP (cyan trace) and cursor deviation (red trace), time-locked to hand acceleration peaks. The upward pointing arrow depicts one potential sampling latency of the cursor deviation, possibly influencing the amplitude of ERP (gray box). B, Averaged single-epoch mean amplitude (FCz electrode) as a function of the cursor deviation (vertical axis) and the sampling latency of the cursor deviation relative to the submovement (horizontal axis). The largest trough (depicted by a red asterisk) was observed for the cursor markedly lagging behind the target (negative cursor deviation) before the acceleration peak. The black trace shows portions of the map corresponding to ERP amplitudes significantly different from zero across subjects (p < 0.01, Bonferroni corrected). The horizontal black lines represent the target borders. C, The SD of the ERP amplitudes across cursor deviation. The maximum value, averaged across subjects (thick red vertical bar) of the minimum single-trial amplitude, was estimated to be 0.11 s before the submovement. The two thin red vertical bars represent the SEM of this estimation.
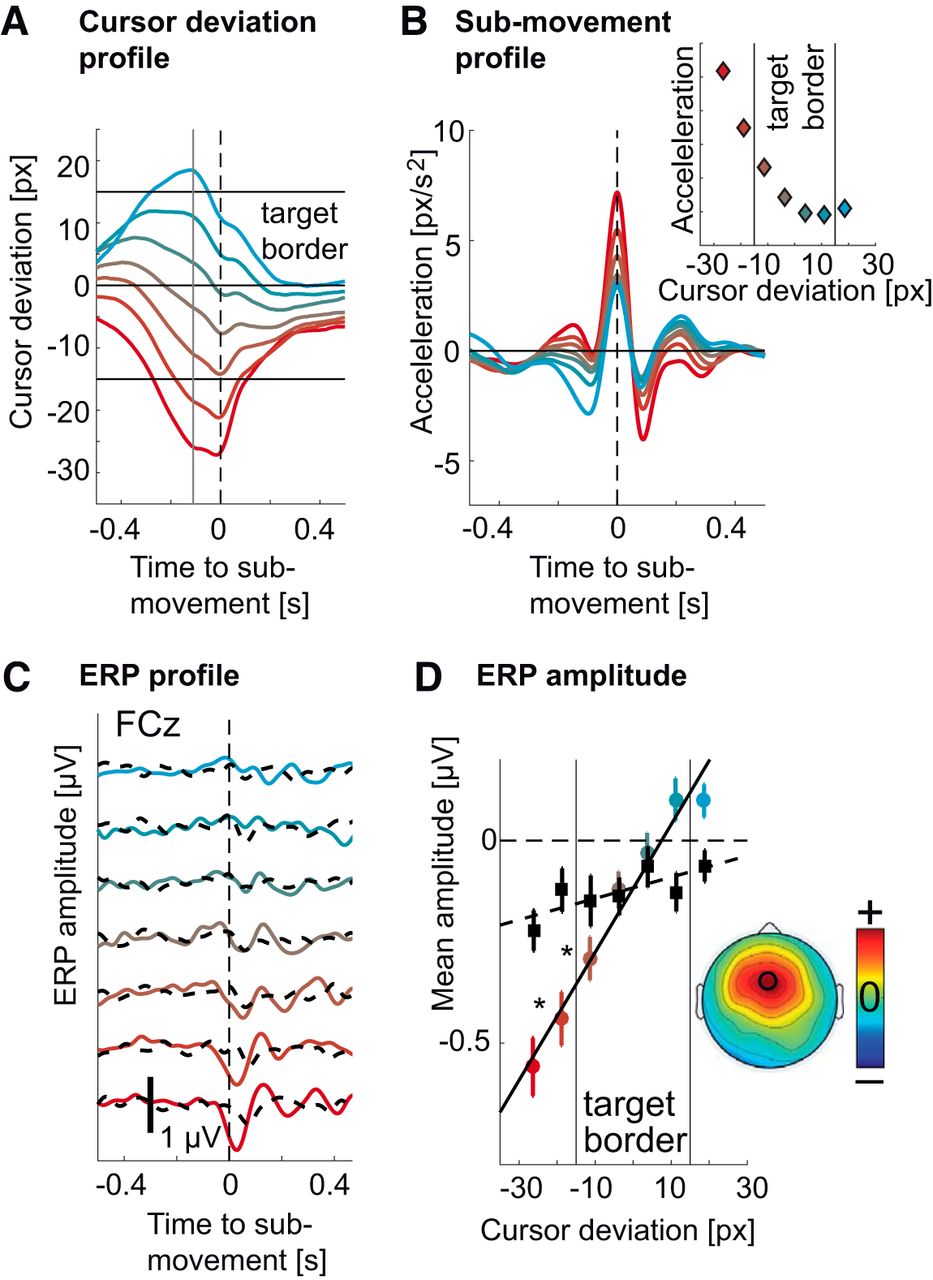
- Figure 4.
Modulation of the ERP by cursor deviation. A, Colored traces correspond to different average cursor deviation time courses leading to ERPs in C for the tracking condition. Red traces correspond to deviations occurring behind the target and cyan traces correspond to deviations occurring ahead of the target. The same coding scheme was used throughout the figure. The vertical gray line corresponds to the sampling of the error at 0.11 s before the submovement, leading to the modulation of the ERP. Horizontal black lines indicate the target’s center and borders. B, Average hand submovement kinematics (acceleration) corresponding to cursor deviations in A and ERPs in C for the tracking condition. Increasing lagging of the cursor behind the target led to increasing submovement kinematics (to catch up with the target). The panel on the upper right shows the relation between cursor deviation and submovement peak acceleration. The results of the matching procedure can be found in Extended Data Figure 4-1 with colored traces showing kinematic profiles of submovements from the tracking condition and dashed black traces corresponding to matched submovements from the spontaneous condition. Panels are ordered from left to right in order of increasing cursor deviation. C, ERP (FCz) for different cursor deviations (and submovement kinematics) showed increasing amplitudes for increasing lag of the cursor behind the target (negative values). D, Amplitude of the ERP troughs (FCz) from C against cursor deviation at 0.11 s presubmovement. The colored dots correspond to ERP amplitudes from the tracking condition and were correlated with cursor deviation (r2 = 0.97, p < 0.001). The black squares correspond to ERP amplitudes from the spontaneous condition and also linearly increased (r2 = 0.63, p = 0.034). The amplitudes were computed by averaging the ERP in time over a 0.1-s window centered on the ERP trough. More negative values correspond to larger troughs. Whiskers denote SEM across subjects. The asterisks show significant differences between the tracking and the spontaneous condition (p < 0.05, Bonferroni corrected). Vertical black lines indicate the target’s border. For the tracking condition, the slope of this linear fit was strongest over the frontal midline (inset).
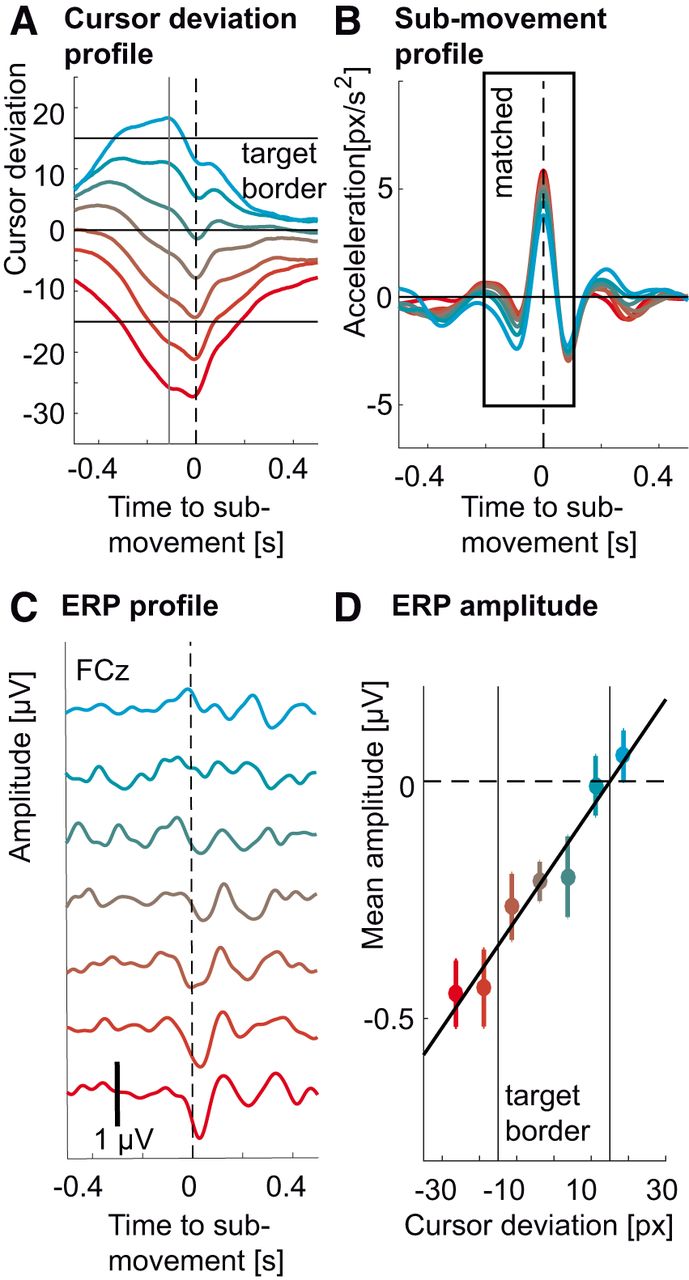
- Figure 5.
Modulation of the ERP by cursor deviation in the tracking task while controlling for kinematics. A, Colored traces represent average cursor deviation time courses leading to ERPs in C. Red traces correspond to deviations occurring behind the target and cyan traces correspond to deviations occurring ahead of the target. The same coding scheme was used throughout the figure. The vertical gray line corresponds to the sampling of the error at 0.11 s before the submovement leading to the modulation of the ERP. Horizontal black lines indicate the target’s center and borders. B, Matched average submovement kinematics (acceleration) corresponding to cursor deviations in A and ERPs in C. C, Average ERPs (FCz) for different cursor deviations during the tracking task (colored traces) for matched hand kinematics. The size of the ERP increased with increasing lag of the cursor behind the target (negative values). D, Amplitude of the ERP troughs (FCz) from C correlating to cursor deviation at 0.11 s presubmovement (r 2 = 0.95, p < 0.001). The amplitudes were computed by averaging the ERP in time over a 0.1-s window centered on the ERP’s trough. Negative values correspond to larger troughs. Whiskers denote SEM across subjects. Vertical black lines indicate the target’s border. The peak-to-peak ERP amplitudes for the control experiment with constant target speed are in Extended Data Figure 5-1A. Vertical black lines indicate target borders. Kinematics (top) and cursor deviation profiles corresponding to the ERP amplitudes are in Extended Data Figure 5-1B.
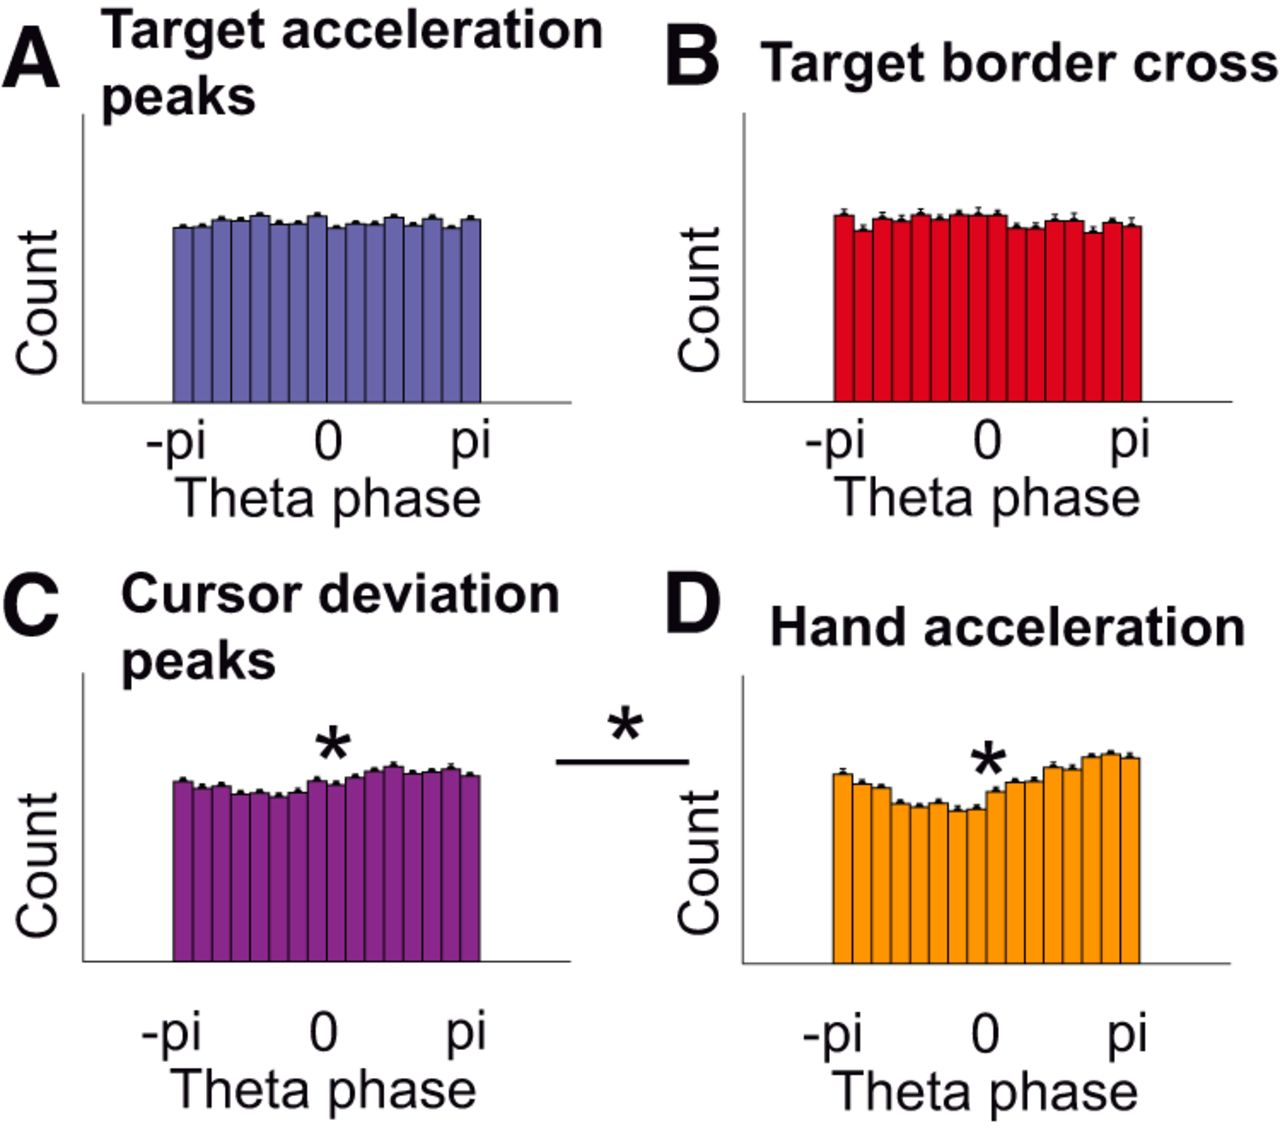
- Figure 6.
EEG phase-locking for different behavioral events. A, No significant phase modulation was found for target acceleration peaks (zPLV = 0.09 ± 0.21, p = 0.67, t(22) = 0.43, one-sample t test). Each histogram bar corresponds to the count of corresponding EEG phases at target acceleration peaks. B, No significant phase modulation was found when the cursor left the target area (zPLV = 0.42 ± 0.36, p = 0.25, t(22) = 1.17). C, A weak but significant phase modulation was found for peaks in the Euclidian distance between cursor and target (zPLV = 1.50 ± 0.33, p = 0.00014, t(22) = 4.60). D, The largest (significant) phase modulation was found for submovements (peaks in hand acceleration; zPLV = 5.26 ± 0.64, p < 0.001, t(22) = 8.18). This modulation was significantly stronger than for peaks in the Euclidian distance between the cursor and the target (C; p < 0.001, t(22) = 6.86, paired t test).


Tables
Data structure Type of test Power a ERP data for each subject (N = 23), repeated for each time point (N = 257) One-sample t test for all time samples (N = 257), Bonferroni corrected 1 b ERP data for each subject (N = 23), repeated for each time point (N = 257) One-sample t test for all time samples (N = 257), Bonferroni corrected 1 c ERP data for each subject (N = 23), repeated for each time point (N = 257) One-sample t test for all time samples (N = 257), Bonferroni corrected 0.73 d Mean amplitude of ERPs for each subject (N = 23) for two tasks (track/spont.) Repeated measures ANOVA with factor task 0.7 e Mean amplitude of ERPs for each subject (N = 23) for seven levels of cursor deviation Repeated measures ANOVA with factor deviation 0.16 f Mean amplitude of ERPs across subjects for 7 levels of cursor deviation F test 1 g Mean amplitude of ERPs across subjects for 7 levels of cursor deviation F test 0.41 h Mean amplitude of ERPs for each subject (N = 23) for tracking and spontaneous (repeated for 7 levels of deviation) Paired t test for all cursor deviation bins (N = 7), Bonferroni corrected 0.96 i Mean amplitude of ERPs across subjects for 7 levels of cursor deviation F test 1 j Mean zPLV for each subject (N = 23) One-sample t test 0.07 k Mean zPLV for each subject (N = 23) One-sample t test 0.07 l Mean zPLV for each subject (N = 23) One-sample t test 0.95 m Mean zPLV for each subject (N = 23) One-sample t test 1 n Mean zPLV for each subject (N = 23) Paired t test 1 o Mean amplitude of ERPs across subjects for 7 levels of cursor deviation F test 1* *p = 0.05 instead of p = 0.01.
Supplementary Figure 2-1
The ERP for different directions of the target (orange for north, blue for east, purple for south and yellow for west; see insert) can be found in Figure 2-1. No discernible differences in ERP amplitude were observed. Download Figure 2-1, EPS file.
Supplementary Figure 4-1
The results of the matching procedure can be found in Figure 4-1 with colored traces showing kinematic profiles of sub-movements from the tracking condition and dashed black traces corresponding to matched sub-movements from the spontaneous condition. Panels are ordered from left to right in order of increasing cursor deviation. Download Figure 4-1, EPS file.
Supplementary Figure 5-1
The peak-to-peak ERP amplitudes for the control experiment with constant target speed are in Figure 5-1A. Vertical black lines indicate target borders. Kinematics (top) and cursor deviation profiles corresponding to the ERP amplitudes are in Figure 5-1B. Download Figure 5-1, EPS file.
In this issue


