

Article Figures & Data
Figures
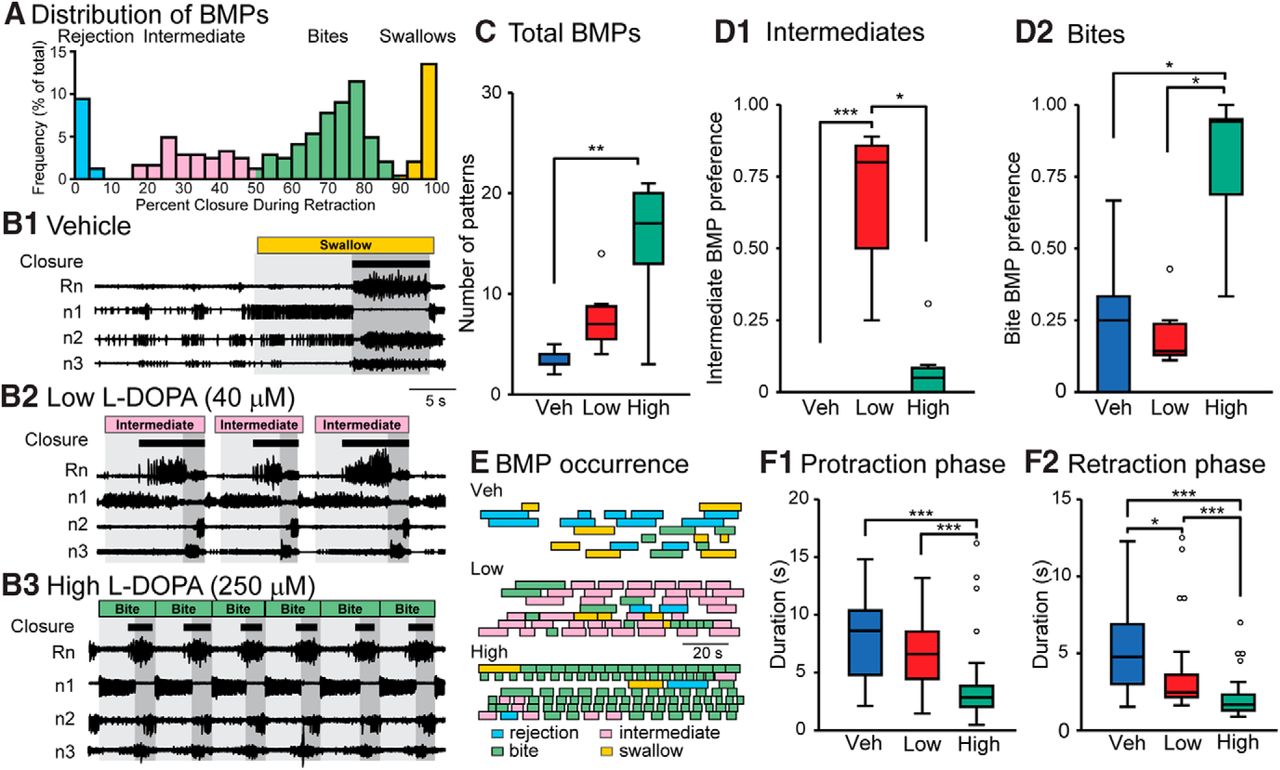
- Figure 1.
Changes in fictive behavior 15 min after treatment with Veh, 40 μM (Low), or 250 μM (High) l-DOPA. Each preparation only received a single treatment, which remained in the bath for the duration of the recording. A, Histogram of all BMPs recorded in all 21 experiments during the pretreatment observation period and following treatment. Each bin is indicated by a percentage value, calculated by dividing the duration of large-unit activity in Rn that occurred during the retraction phase by the total duration of large-unit Rn activity during the BMP. This graph indicates that there are four distinct clusters of BMPs that we designate as rejection, intermediate, bites, and swallows. B, Nerve recordings for the vehicle, low, and high treatments showing a 40-s time segment. Protraction phase is marked by light gray and retraction is marked in dark gray. The BMP classification is indicated at the top and closure activity is marked by brown boxes. Black bars under the BMP designation represent large-unit Rn activity, which has been associated with closure of the radula (Morton and Chiel 1993a,b). C, Summary data for the total number of BMPs. For all box plots, the boundaries of each box are the first and third quartiles (Q1 and Q3) and the line within the box is the median. The upper and lower extremes are the minimum (or maximum) data value within (Q1 or Q3) ± 1.5 times the interquartile range. Data outside the extremes are marked as open circles. D1, Summary data of the preference for intermediate BMPs. A value of one indicates the group exclusively expresses intermediate BMPs. D2, Summary data of the preference toward bite BMPs. Sample size for C, D1, and D2 is seven experiments for each group. E, The occurrence of BMPs. Each box represents the duration of a single BMP. Each row is an individual experiment. F1, Duration of protraction for the different treatment groups. F2, Duration of retraction for the different treatment groups. Sample size for the groups in F is Veh = 24, Low = 54, High = 104 BMPs for seven ganglia in each group. The same dataset was examined for all subsequent figures. *p < 0.05, **p < 0.01, and ***p < 0.001.
- Figure 2.
VSD imaging of neuronal activity in the buccal ganglia. A1, Image of the caudal surface of the ganglion for A2. The pixels that were averaged are highlighted in red. A2, VSD responses of neuron B4 to 20 intracellular current injections, aligned to the action potential detected in the nerve (n3). Green dotted line marks the baseline before current injection. For A2, B2, and E2, individual examples are gray and the average trace is black. Thick black line indicates the current injection. B1, VSD (black trace) of 42 neurons recorded simultaneously. Detected spikes are indicated by red vertical lines below each trace. Each trace was generated by averaging the pixels highlighted for each neuron in the top left image of C. B2, Temporally aligned action potentials detected in the corresponding trace in A1. Note the prominent AHP in cell 28 (arrowhead). C, Image of VSD response during the peak of the wave form of all the detected spikes that occurred in B for that neuron. The neuron designation is in the top left of each image. Image of the ganglion (caudal surface) with the neuron designations is the top left image. The number of spikes averaged for each neuron is indicated in the bottom left-hand corner. D, Individual frames of neuron 28 during and after an action potential. Arrowheads point to the presumed AHP. Data in A and B, C, and D are from separate animals. E, Coincidence of spikes between the nerve and neuron indicated the presence of an axonal projection. E1, Example recording segment of a neuron whose action potentials detected by VSD (top trace) coincide with a distinct spike in the nerve (bottom trace). E2, VSD traces (top) and nerve traces (bottom) of example in E1 aligned by the peak of the VSD signal. Note the nerve spike follows the VSD spike with a constant delay. E3, Probability of an action potential in the nerve given a spike in the neuron at time 0. Displayed is every neuron–nerve pair for all experiments in this study. A sharp peak in conditional probability with a time delay of a few ms indicates an axonal projection. Dark line represents the example in E1. Includes data from 21 preparations.
- Figure 3.
Changes in fictive behavior and neuronal activity 15 min after treatment with Veh, Low, or High l-DOPA. Each preparation received only a single treatment. Each treatment group consisted of seven preparations. A 40-s segment is shown. Recording segment same as for Fig. 1. A, Images of the ganglion (caudal surface). Neurons whose activity is shown in B are highlighted. Scale bar is 100 μm. B, Top, recordings of Rn and n1–3 nerve activity. Bottom, raster of VSD activity recorded simultaneously with nerve activity. Each row is an individual neuron with the location in the image marked in A. Vertical black lines indicate an action potential. Light gray indicates protraction. Dark gray indicates retraction. Closure activity is marked by black boxes. The BMP classification is indicated at the top of the traces. C, Correlation matrices for the recordings in B. Numbers correspond to the cell designations in A and B. Only neurons primarily active during retraction are shown in the correlation matrix. The dendrogram of each matrix is shown on the right. D, Mean pairwise correlation between neurons. Sample sizes were seven preparations for each treatment group in panel D. Time bin was 0.5 s.
- Figure 4
Temporal dynamics of specific groups of neurons are modified by l-DOPA. A, Activity of each neuron during each BMP aligned to the start of retraction phase. The level of activity was measured for protraction (A1), retraction (A2), and Rn (A3), n2 (A4) and n3 (A5) projecting neurons following treatment with Veh, Low, or High l-DOPA. Each row of the image represents the activity of a single neuron during a single BMP. The vertical black line indicates the start of retraction. The horizontal black line separates the treatment groups. Time bin was 0.1 s. B, Peri-event histograms for the data in A. Horizontal bars indicate a significant difference between the specified groups at those time points. See Figures 4-1, 4-2, 4-3, 4-4 and 4-5 for statistics on A1, A2, A3, A4 and A5, respectively. Peaks in activity outside ± 4 s for High are due to activity in adjacent BMPs. The fill represents the interquartile range and the line represents the median level of activity of each time point. Time bin was 0.5 s. Sample size is number of BMPs. Each treatment group consisted of seven preparations.
- Figure 5
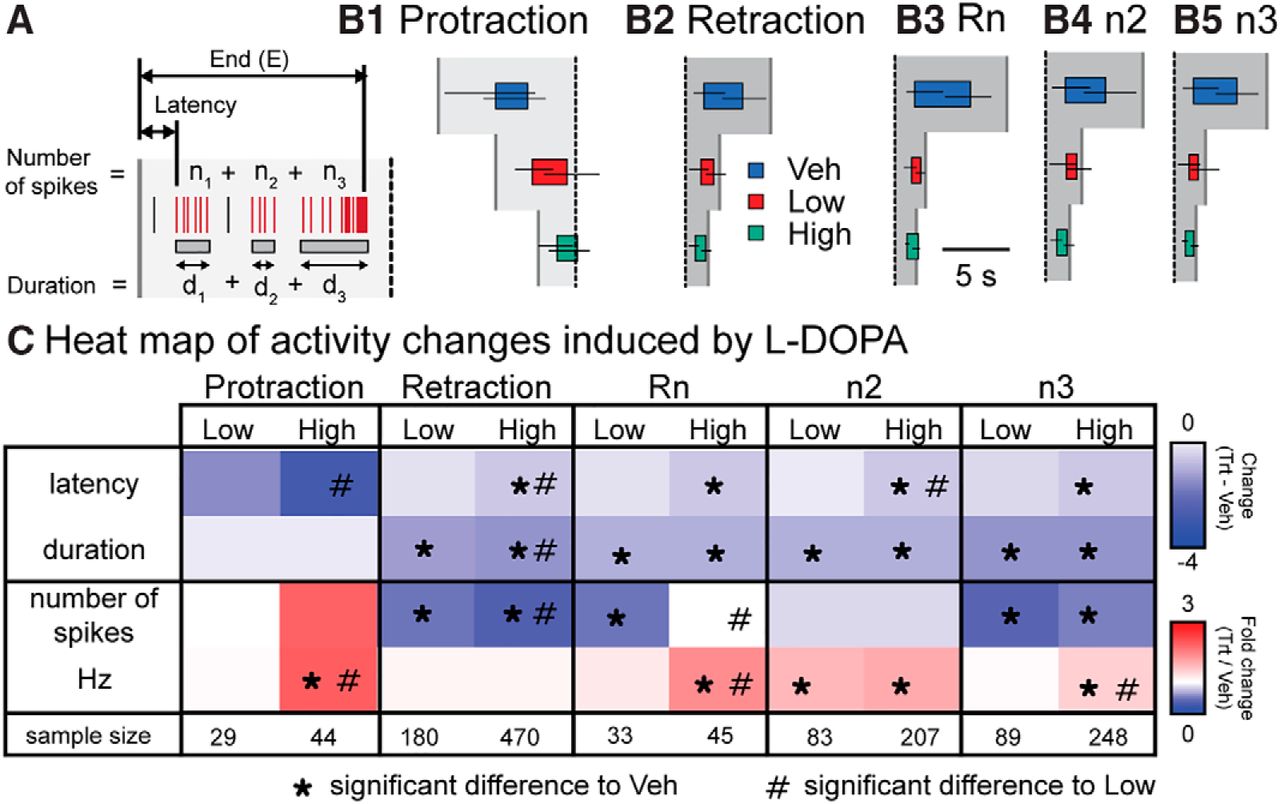
l-DOPA differentially modified the burst properties of neurons. A, Diagram depicting the measurements. The latency is the start of the first burst overlapping with the phase. The duration is the sum of the duration of all bursts for that neuron during the phase. The burst end time is the end of the last burst overlapping with the phase. The number of spikes is the sum of spikes within all the burst overlapping that phase. Frequency is the number of spikes divided by the burst duration. B, Graphical representation of the burst timing during a BMP. The colored box represents the median start and end time for bursts in that treatment. The horizontal lines represent the interquartile range for the start and end time of the bursts. The vertical gray lines in B1 indicate the median start of protraction. The vertical gray lines in B2–B5 indicate the median end of retraction. The vertical dotted line indicates the start of retraction. C, Matrix of the l-DOPA induced changes in burst times and spiking activity. For display purposes, Veh median start and duration were subtracted from the median start and duration of either Low or High. For spiking activity, the number or frequency of spikes was divided by the median number or frequency of spikes in Veh. *, Significance relative to Veh; #, significance relative to Low. See Fig. 5-1 for statistics. The sample size is the number of bursts examined. Each treatment group consisted of seven preparations.
- Figure 6.
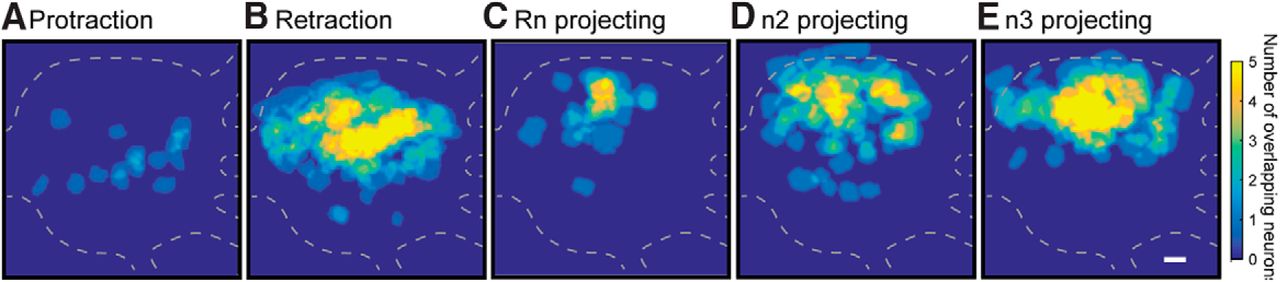
Spatial distribution of protraction, retraction, Rn, n2, and n3 projecting neurons. A, Protraction neurons are clustered near the center. B, Retraction neurons are near the upper middle. C, Rn projecting neurons are in the center upper region. D, E, n2 and n3 neurons are in the topmost region of the ganglia. Caudal surface with the buccal commissure on the left. Scale bar is 100 μm. Data were pooled across all 21 preparations.
- Figure 7.
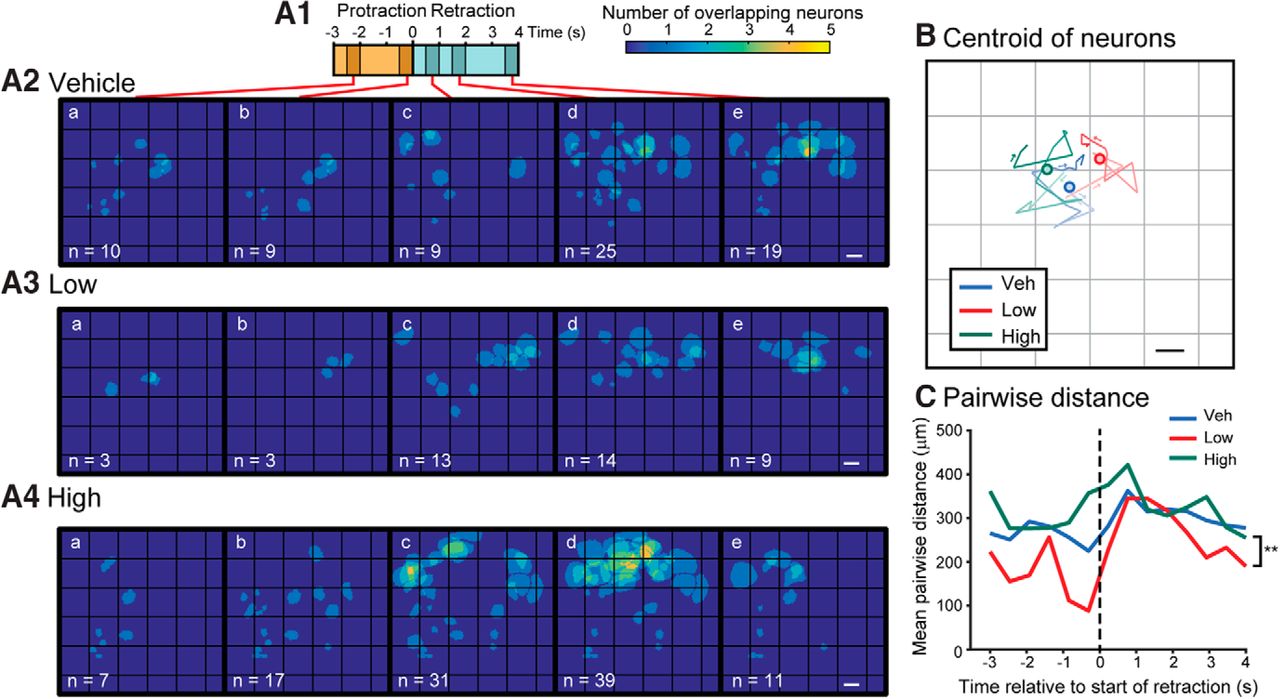
l-DOPA tended to recruit neurons with different spatial distributions. Data were pooled across all seven preparations for each treatment group. A1, Timeline of a BMP. A2–A4, Images of the locations of all neurons activated at the time bins indicated in A1 from all experiments within a given treatment. Five of the 14 time bins are shown. The pixels for each overlaying ROI were summed. The number at the bottom left is the number of neurons activated. Caudal surface with the buccal commissure on the left. Scale bar is 100 μm. B, The centroid of all neurons as it progresses through each time bin in A1. An opacity gradient was added to the line to represent time (light→dark represents beginning→end). The filled circle marks the mean of all the centroids. C, Mean pairwise distance between all pairs of neurons for each time bin. **p < 0.01.
- Figure 8.
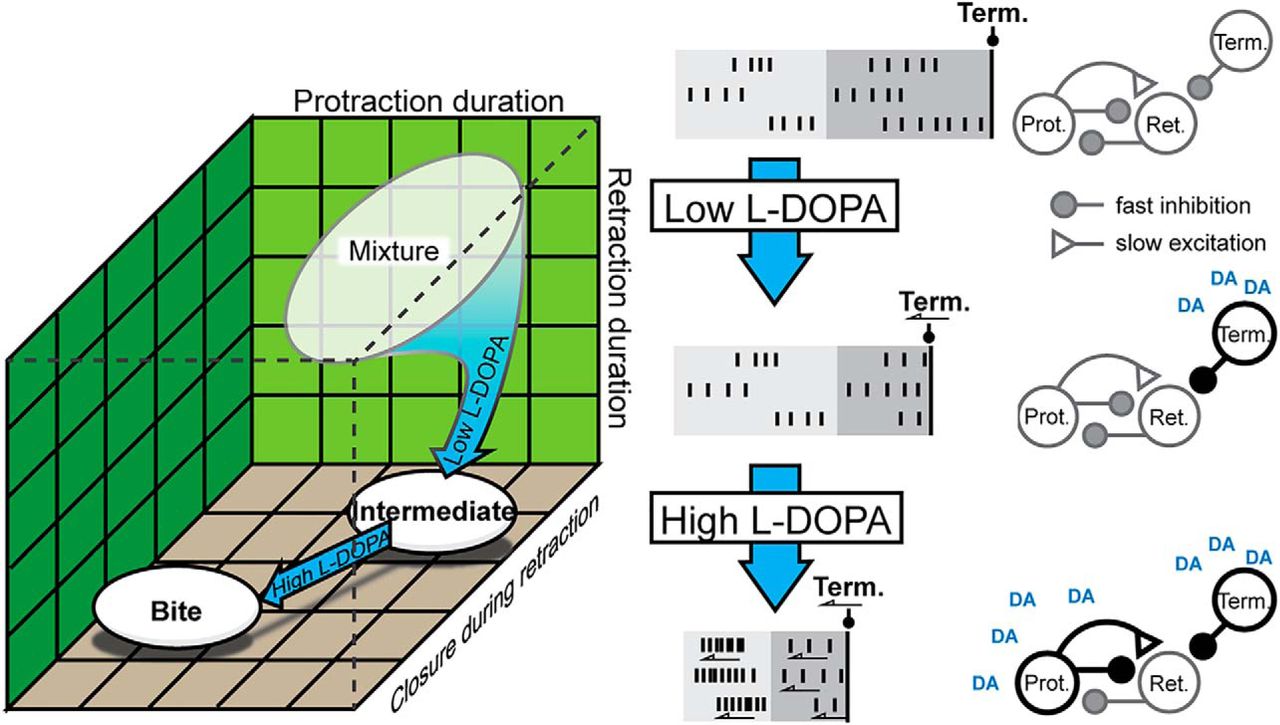
Summary of the l-DOPA effects on neuronal activity. A, Low l-DOPA biased the selection of BMPs toward intermediates starting from primarily rejection and to a lesser extent swallows (see Veh in Fig. 1E). High l-DOPA biased the selection of BMPs toward bite BMPs. B, Summary of the changes in activity (left) and the proposed mechanism (right). B1, Activity in Veh. Vertical lines signify action potentials. Light gray is protraction phase. Dark gray is retraction phase. Black line is the onset of activity of BMP terminating (Term.) neurons. Gray outlines indicate basal conditions; black outlines indicate enhancement. Protraction spike frequency is enhanced. B2, Activity in Low l-DOPA. The burst are truncated because the terminating neurons are being activated sooner (arrow). B3, Activity in High l-DOPA. The enhancement of protraction neurons more rapidly activates retraction neurons.


Tables
Data structure Type of test Statistical value (χ2) p value a Normality not assumed Kruskal–Wallis 11.513 0.003 b Normality not assumed Kruskal–Wallis 11.359 0.034 c Normality not assumed Kruskal–Wallis 16.145 3.1 × 10⁻⁴ d Normality not assumed Kruskal–Wallis 65.499 5.9 × 10⁻¹⁵ e Normality not assumed Kruskal–Wallis 65.232 6.9 × 10⁻¹⁵ f Normality not assumed Kruskal–Wallis 1.789 0.409 g Normality not assumed Kruskal–Wallis 6.264 0.044 h Normality not assumed Kruskal–Wallis 859.92 1.3 × 10−133 i Normality not assumed Kruskal–Wallis 1575.30 4.4 × 10−280 j Normality not assumed Kruskal–Wallis 660.15 6.3 × 10−95 k Normality not assumed Kruskal–Wallis 913.19 8.1 × 10−145 l Normality not assumed Kruskal–Wallis 707.03 4.9 × 10−104 m Normality not assumed Kruskal–Wallis 0.998 0.607 n Normality not assumed Kruskal–Wallis 0.800 0.670 o Normality not assumed Kruskal–Wallis 0.236 0.889 p Normality not assumed Kruskal–Wallis 1.051 0.591 q Normality not assumed Kruskal–Wallis 1.628 0.443 r Normality not assumed Kruskal–Wallis 144.63 8.5 × 10⁻²⁴ s Normality not assumed Kruskal–Wallis 217.68 1.3 × 10−38 t Normality not assumed Kruskal–Wallis 133.82 1.2 × 10⁻²¹ u Normality not assumed Kruskal–Wallis 165.54 5.4 × 10⁻²⁸ v Normality not assumed Kruskal–Wallis 12.192 0.0023
Movies
- Video 1.
VSD changes for nine neurons during an action potential. The raw images of nine cells in Fig. 2A are displayed with an outline of the ROI. The ROI designations are in the top left of each image. The video plays at 1/500 speed to highlight the spatiotemporal voltage response of each cell. The VSD response appears to be centralized to the ROI (also seen in image preview). An apparent AHP can be seen following the action potential (3.2–3.6 ms; not seen in image preview). The scale bar is 100 μm. Images were filtered with a 1-pixel Gaussian filter.
- Video 2.
Neuronal activity after treatment with Veh, Low, or High l-DOPA. Each video segment corresponds to the activity in Veh, Low (shown in image preview), and High treatment groups. An image of the ganglia is on the left and a raster plot of the activity is on the right. The nerve activity is on the top right. The ROI overlying the neuron is highlighted when the neuron is active. Activity of each neuron is also indicated by a tone with specific pitch (the lowest tone is assigned to Neuron 1 and the highest to Neuron 12).
- Video 3.
l-DOPA recruits neurons with different spatial distributions. A–C, Locations of all neurons from all experiments with a given treatment activated at the time bins indicated in D. Each frame represents 0.5 s. The pixels for each overlaying ROI were summed. The number at the top left is the number of neurons activated. The red circle is the centroid of the neurons in the current time bin and the red line is the path of the centroid from previous time bins. Scale bar is 100 μm. D, Timeline of a BMP.
Figure 4-1
Statistical comparisons among protraction neurons for Fig. 4. The treatment groups were compared for each time bin (column 1), and each comparison is represented in columns 2–4. The first row for each time bin is the t value. The second row for each time bin is the Bonferroni-adjusted p value. Bonferroni-adjusted p values can be larger than one; such p values were capped at one in this and subsequent tables. *, p < 0.05, **, p < 0.01, and ***, p<0.001. Kruskal–Wallis test indicated a significant difference between the groups (χ2 = 859.92, p = 1.3 × 10−133)h. Download Figure 4-1, DOC file.
Figure 4-2
Statistical comparisons among retraction neurons for Fig. 4. The organization of the table is the same as Fig. 4-1. Kruskal–Wallis test indicated a significant difference between the groups (χ2 = 1575.30, p = 4.4 × 10−280)i. Download Figure 4-2, DOC file.
Figure 4-3
Statistical comparisons among protraction neurons for Fig. 4. The organization of the table is the same as Fig. 4-1. Kruskal–Wallis test indicated a significant difference between the groups (χ2 = 660.15, p = 6.3 × 10−95)j. Download Figure 4-3, DOC file.
Figure 4-4
Statistical comparisons among n2 neurons for Fig. 4. The organization of the table is the same as Fig. 4-1. Kruskal–Wallis test indicated a significant difference between the groups (χ2 = 913.19, p = 8.1 × 10−145)k. Download Figure 4-4, DOC file.
Figure 4-5
Statistical comparisons among n3 neurons for Fig. 4. The organization of the table is the same as Fig. 4-1. Kruskal–Wallis test indicated a significant difference between the groups (χ2 = 707.03, p = 4.9 × 10−104)l. Download Figure 4-5, DOC file.
Figure 5-1
Table summarizing the statistical comparisons for Fig. 5. The neuron subgroup indicated in the first column and the treatment groups being compared are in the second column: LV represents Low vs. Veh, LH represents Low vs. High, VH represents Veh vs. High. A separate Kruskal–Wallis (four total) done on each variable is indicated in the first row. The first row of each comparison is the rank-sum z statistic. The second row for each comparison is the Bonferroni-adjusted p value. p values were capped at one. *, p < 0.05, **, p < 0.01, and ***, p<0.001. Download Figure 5-1, DOC file.
In this issue


