

Article Figures & Data
Figures
- Figure 1.
Thick F-actin belts of mature supporting cells maintain spatial organization at the surface of the lesioned organ of Corti. A, Illustrations of the developing and adult organ of Corti. Coordinate arrows demonstrate image orientations. Color coding is shown on the right. B, C, SBEM single block-face images at the level of the apical cell junctions of the adult (P20) organ of Corti of the medial cochlear turn. In the nonlesioned cochlea, OHCs (blue) are evenly delineated by SCs. Arrow marks a thick F-actin belt of Deiters cells (B). 1.5 d after induction of ototoxic trauma (KAFU, see Methods), thick-belted SCs have resealed the epithelial surface (red hatched line in C). The line demonstrates that the length of the reticular lamina is maintained, similar to positioning of survived cells. White dashed line shows orientation in C′. C′, Side view of the scar between outer pillar cells. D–G, In the developing (E18.5) organ of Corti, Deiters cells have thin belts (arrow; D). A degenerating OHC from a Gfi1GFP/GFP mouse cochlea is undergoing apical constriction (arrows), a typical feature of degenerating hair cells (E). A degenerating OHC from a Gfi1GFP/GFP mouse shown in 3D, with colored mitochondria (purple) and nucleus (blue; F). Upon OHC loss in Gfi1GFP/GFP mice, thin-belted Deiters cells collapse and the reticular lamina is shrunken (G). Compare the line in G demonstrating the length of the reticular lamina to the corresponding line in the image from the adult organ of Corti (C). H, Quantification (mean ± SD) shows that OHC loss leads to significant reduction of the width of the reticular lamina during development, but not at adulthood. I, I′, Quantification (mean ± SD) shows that apices of developing Deiters cells do not expand, as opposed to mature Deiters cells (I). This is evidenced by modeling of F-actin belts (red) and junctions (green; I′). Abbreviations: cc, Claudius cell; d, Deiters cell; ger, greater epithelial ridge; hec, Hensen cell; i.p., inner pillar cell; KAFU, kanamycin and furosemide; ohc, outer hair cell; op, outer pillar cell; SC, supporting cell; ph, phalangeal cell. Scale bar (in G): B–E, G, 5 µm; F, 7.5 µm; I′, 6.5 µm.
- Figure 2.
Junctional proteins of supporting cells are not uniformly recruited to new junctions after outer hair cell loss. The organ of Corti of P20 cochlea analyzed 1.5 d after induction of ototoxic trauma (see Methods). A–C′, Confocal microscopy images show phalloidin-labeled original F-actin belts (thick arrow) as well as scar-forming thinner belts (thin arrow) at the site of lost OHCs. Double-labeling shows that ZO-1–positive junctional plaques (white arrowheads) remain associated with the original belts, despite formation of new junctions at the lesion site. Black arrowhead marks a new junction below the cuticular plate of a dead OHC. White dashed line shows orientation in C″. Insets (A′, B′, C′) show respective double-labeling in a nonlesioned specimen. D, D′, Double-labeling for E-cadherin and phalloidin shows that the junctional plaques close to the original F-actin belt are also positive for E-cadherin (white arrowheads). D″, Double-labeling for E-cadherin and phalloidin in a nonlesioned specimen. E, E′, Block-face single images confirm that Deiters cell junctions do not readily detach from the original belts during wound healing. Junctional plaques form vacuoles (red arrowheads) and surface depressions (white arrowheads). White dashed line shows orientation in E′. F, Block-face single image shows a typical cross-shaped scar formed by two Deiters cells. It also shows original F-actin belts with detached junctional plaques (red arrows). G, Junctional components fail to readily detach from the original F-actin belts in scar-forming outer pillar cells as well (red arrowheads). Note also the prominent microtubule bundles in these cells. Color coding refers to block-face images. Abbreviations: d, Deiters cell; cp, cuticular plate; hec, Hensen cell, i.p., inner pillar cell; ohc, outer hair cell; op, outer pillar cell. Scale bars (in F): A–C′, 5 µm; D–D″, 6.6 µm; E–G, 1.6 µm.
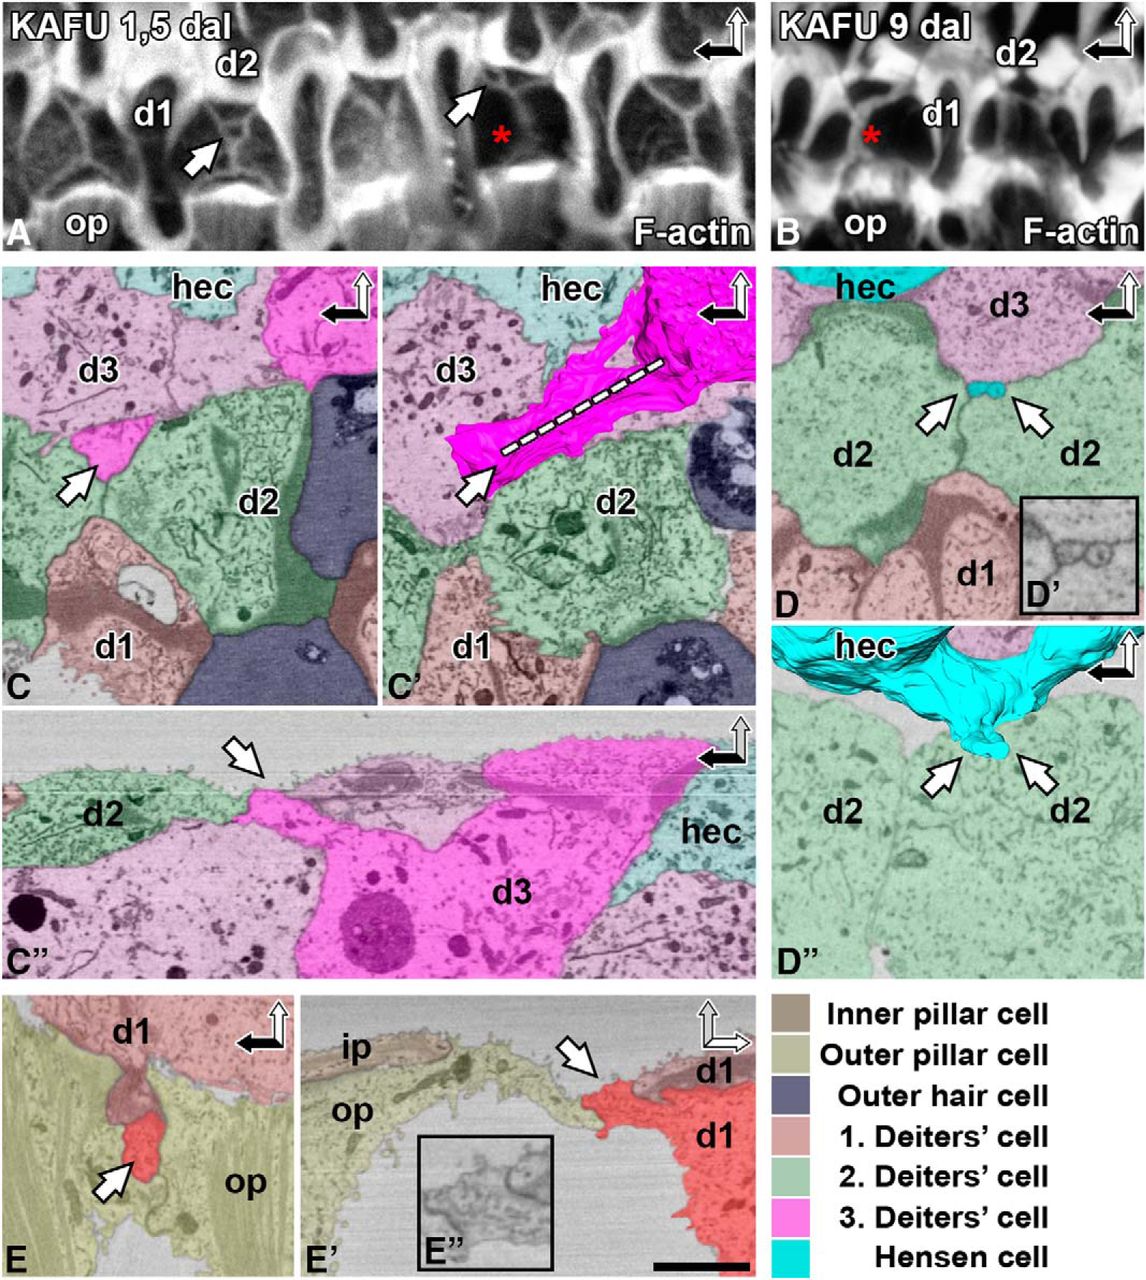
- Figure 3.
Supporting cells without junctional contacts to dying outer hair cells contribute to acute wound healing. The organ of Corti of P20 cochlea analyzed 1.5 and 9 d after ototoxic trauma (KAFU, see Methods). A, B, Phalloidin labeling at the acute postlesion stage shows that the scars formed by Deiters cells are associated with F-actin rings (white arrows; A). Similar structures are not found at the later postlesion stage (B). Note the reinforcement of F-actin scars (red asterisks), evident by comparing the intensity of phalloidin labeling at the two postlesion time points. C–C″, A ring-like structure (white arrow) is present at the scar. It originates from a basolateral extension of a distant Deiters cell, shown in a block-face single image (C) and after 3D modeling (C′). Dashed line shows orientation in C″. D–D″, A Hensen cell has extended two basolateral membrane protrusions to the scar (D), shown at a higher magnification in D′ and with 3D modeling in D″. E–E″, A basolateral projection of a Deiters cell is found between two outer pillar cells, shown in two orientations (E and E′, E″). Color coding refers to SBEM images. SC basolateral extensions are shown by more intense colors. Abbreviations: d, Deiters cell; dal, days after lesion; hec, Hensen cell; i.p., inner pillar cell; KAFU, kanamycin and furosemide; ohc, outer hair cell; op, outer pillar cell. Scale bar (in E′): A, B, 5 µm; C, D, D″–E′, 2.5 µm; D′, E″, 1.5 µm.
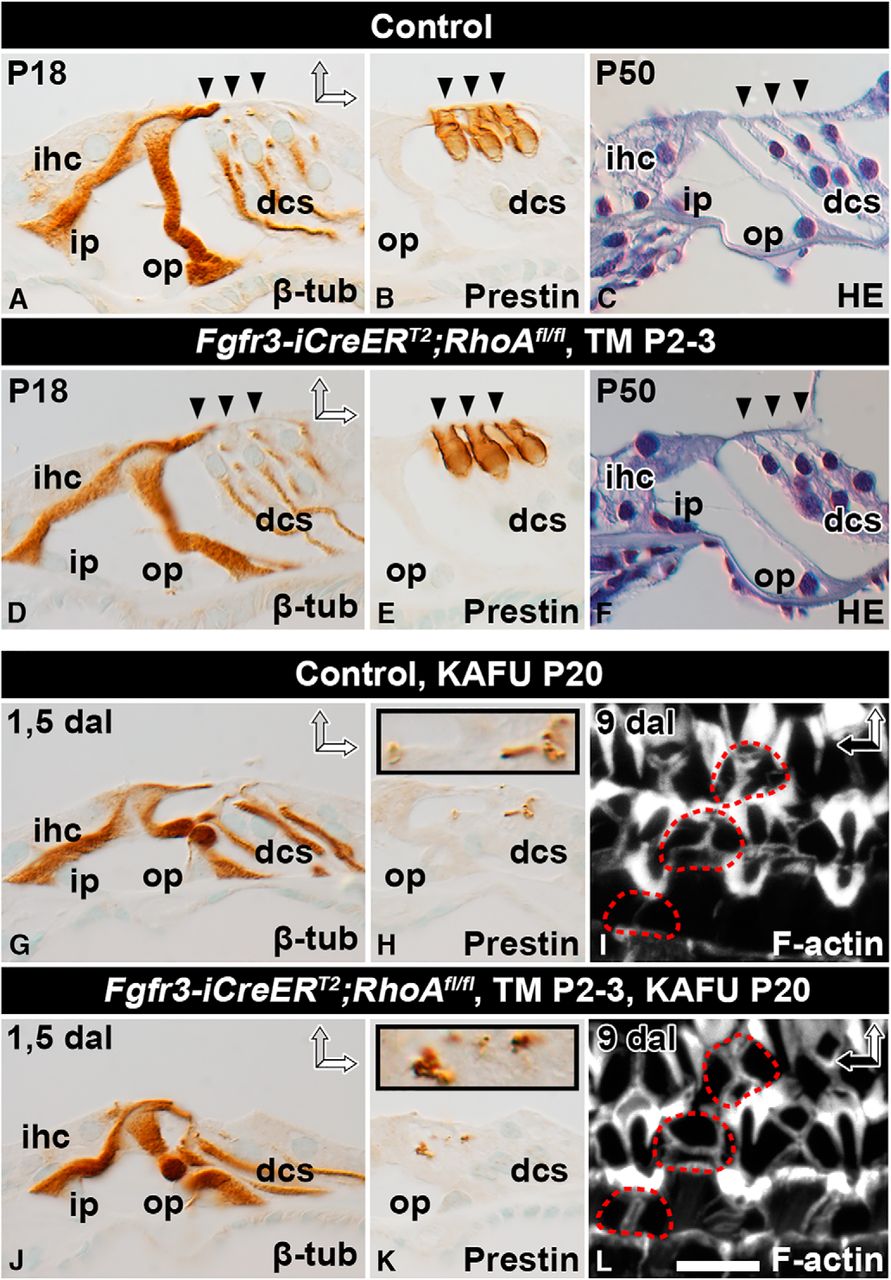
- Figure 4.
RhoA is dispensable for supporting cell maturation and wound healing. Recombination was induced in auditory SCs of RhoAfl/fl;Fgfr3-iCre-ERT2 mice at P2–3, and analysis was performed at adulthood. Paraffin-embedded cross-sections (A–H, J, K) and phalloidin-labeled whole-mount specimens (I, L) of the organ of Corti of the cochlear medial turn of mutant and control mice. A, D, At P18, β-tubulin immunocytochemistry shows no major structural differences between SCs of the two genotypes. B, E, Prestin immunostaining shows comparable morphology of non-recombined OHCs as well. C, F, Hematoxylin staining shows that the cytoarchitecture of the organ of Corti is comparable between mutant and control mice at P50. G, J, Most OHCs are lost 1.5 d after induction of ototoxic lesion (KAFU, see Methods). In both types of specimens, β-tubulin–positive SCs maintain positions at the reticular lamina, although their cell bodies have partially lost upright position. H, K, In both genotypes, Deiters cells phagocytose prestin-positive OHC debris, shown in insets at a higher magnification. I, L, Both control and RhoA-depleted SCs form stable F-actin scars, shown 9 d postlesion. Red dashed lines mark scars at the site of lost OHCs. Abbreviations: β-tub, β-tubulin; dal, days after lesion; dcs, Deiters cells; HE, hematoxylin; ihc; inner hair cell; i.p., inner pillar cell; KAFU, kanamycin and furosemide; ohc, outer hair cell; op, outer pillar cell; TM, tamoxifen. Scale (in L): A–H, J, K, 20 µm; I, L, 6.5 µm.
- Figure 5.
RhoA-depleted outer hair cells are extruded from the organ of Corti. Recombination was induced in RhoAfl/fl;Fgfr3-iCre-ERT2 mice at E13–14, and analysis was performed at E18.5. Images show paraffin-embedded cross-sections from the medial turn of the cochlea (A–F) as well as single block-face images and 3D modeling of Deiters cells (G–H″). A, B, Myosin 6–immunostained OHCs extrude (arrowhead in B) from the organ of Corti of mutant mice. The presence of myosin 6–positive degenerating cell profiles (arrow in B) in the endolymph shows that OHCs die after extrusion. C, D, Similar to controls, OHCs of mutant cochleas possess espin-positive stereociliary bundles with abnormal morphology. Arrowhead points to an extruding OHC with an espin-stained bundle (D). E, E′, Extruding OHCs (arrowheads) are negative for cleaved caspase-3. As a positive control in the same section, the inset shows apoptotic cell profiles in the greater epithelial ridge of the cochlea. F, Extruding OHCs are negative for Ki-67. Proliferating mesenchymal cells underneath the basement membrane in the same section serve as positive controls. G–G″, 3D modeling of a control Deiters cell. Dashed lines demonstrate the level of block-face single images (G′, G″). H–H″, 3D modeling of a mutant Deiters cell shows that the general features of this cell type are maintained, but apical junctions (H′) and the basolateral cell membrane (red arrow in H, H″) have moved due to the loss of adjacent OHCs. A Deiters cell has invaded the space previously occupied by an OHC, and only a “tail” (asterisk) is left of the extruding OHC (H″). Color coding is explained below SBEM images. Abbreviations: c-Casp3, cleaved caspase-3; dcs, Deiters cells; hec, Hensen cell; ihc; inner hair cell; i.p., inner pillar cell; Myo6, myosin 6; ohc, outer hair cell; op, outer pillar cell; TM, tamoxifen. Scale bar (in F): A–F, 10 µm; G, H, 4 µm; G′, G″, H′, H″, 3 µm.
- Figure 6.
Loss of apical stability of RhoA-depleted outer hair cells and its effect on planar cell polarity, microtubule network, and junctional stability. Recombination was induced in RhoAfl/fl;Fgfr3-iCre-ERT2 mice at E13–14, and analysis was performed at E18.5. A, B, Cochlear ducts of control and mutant mice viewed under dark-field illumination show comparable lengths. C, D, Compared with the control specimen, basal turn of the mutant cochlea shows distinct abnormalities in the apical domain of OHCs, revealed by phalloidin labeling. E–G, Shown at a higher magnification and compared with the control specimen (E), medial turn of the mutant cochlea shows rather mild expansion of the OHC apical surface area. Hair bundles appear relatively normal as well (F). In contrast, the OHC apical area displays distinct expansion in the basal turn. Extrusion of OHC nuclei is evident (G). H, Quantification of the width of the apical surface area of hair cells in the basal turn of control and mutant cochleas. Differences are statistically significant in the case of recombined OHCs, as opposed to non-recombined inner hair cells. I, In controls, Vangl2 is expressed in the contact sites between the OHC’s medial wall and Deiters cells (arrows). J, K, In mutants, Vangl2 expression is maintained until OHCs are extruded (red arrow), based on phalloidin and Vangl2 double-labeling. K′, K″, An OHC with expanded apical surface is contacted by Vangl2-positive domains, shown at a high magnification. L, Acetylated tubulin-positive microtubules radiate from the kinocilia in OHCs of the control specimen. M, N, In mutant OHCs with a slightly expanded apical surface area, microtubules appear to be largely intact. Microtubules become disorganized along with further expansion of the OHC apex (asterisk) and cell extrusion (two asterisks). N′, N″, In a mutant OHC, acetylated tubulin and phalloidin double-labeling shows an intact appearance of microtubules around the kinocilium (arrowhead). Microtubules become less organized along radiation toward the cortex. O–Q, Similar to control OHCs (O), ZO-1 localizes evenly to tight junctions of mutant OHCs with an expanded apical surface area (asterisks; P, Q). This junctional expression is also seen in extruding OHCs (two asterisks; P, Q). Q′, Q″, A higher-magnification view of ZO-1–labeled tight junctions of an expanded OHC, shown together with phalloidin labeling. Images in I–Q″ are from the medial turn of the cochlea. Abbreviations: Ac. tub, acetylated tubulin; TM, tamoxifen. Scale bar (in Q″): A, B, 0.3 mm; C, D, 8 µm; E–G, I–K, L–N, O–Q, 5.5 µm; K′, K″, N′, N″, Q′, Q″, 3.5 µm.
- Figure 7.
RhoA-depleted outer hair cells show normal junctional E-cadherin expression before their extrusion. Recombination was induced in RhoAfl/fl;Fgfr3-iCre-ERT2 mice at E13–14, and analysis was performed at E18.5. Whole-mount specimens from the medial turn are shown. A, A′, The apical surface of control OHCs is delineated by E-cadherin–positive adherens junctions and a perijunctional actin ring, revealed by phalloidin labeling. Note the constant size of the apical cell surface areas. B, B′, In mutants, E-cadherin is still expressed in OHCs with expanded apical surface area (asterisk). In OHCs that are in the late phase of extrusion, E-cadherin is unevenly localized to junctions (two asterisks). Abbreviations: OHC, outer hair cell; Ecad, E-cadherin. Scale bar (in B′): A–B′, 5 µm.
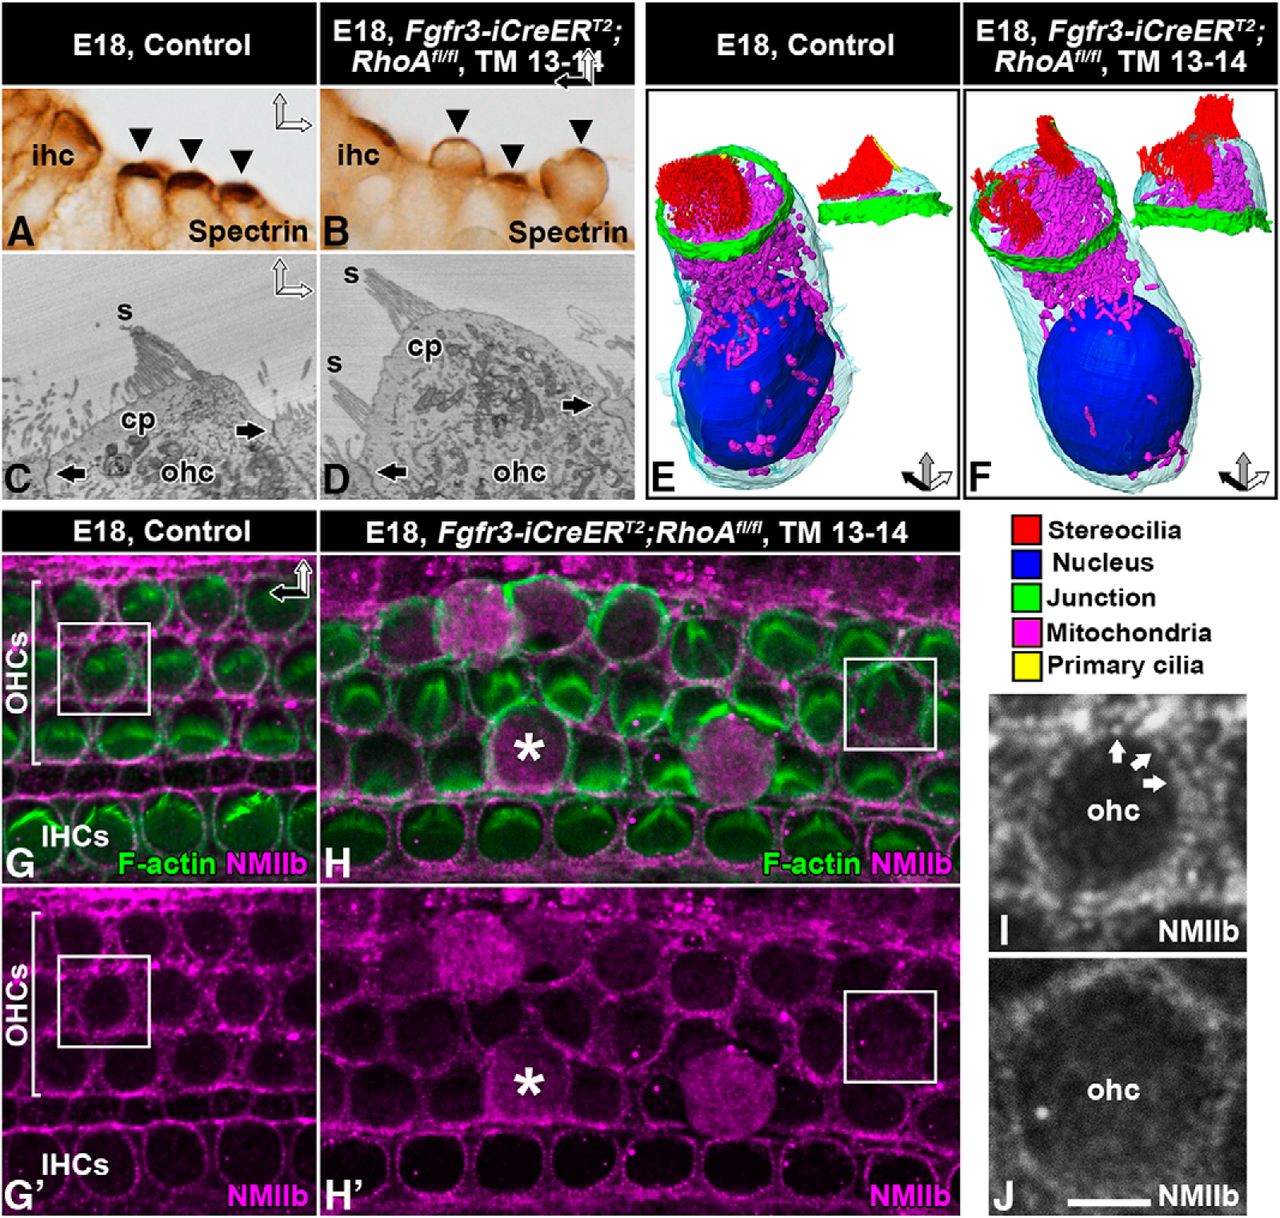
- Figure 8.
Loss of apical stability of RhoA-depleted outer hair cells and altered intracellular NMII localization. Recombination was induced in RhoAfl/fl;Fgfr3-iCre-ERT2 mice at E13–14, and analysis was performed at E18.5. Images show paraffin-embedded cross-sections (A, B), block-face single images (C, D), 3D models (E, F), and whole-mount specimens (G–J) from the medial-basal region of the cochlea. A, B, Spectrin immunostaining marks cuticular plates (arrowheads). Cuticular plates of mutant OHCs bulge outward, as opposed to control ones. C, D, Control OHC shows apical junctions (arrows) and a linear cuticular plate that anchors stereocilia (C). Mutant OHC shows intact junctions (arrows). Its cuticular plate bends upwards, splitting the stereociliary bundle (D). E, F, 3D modeling confirms these phenotypic changes. The morphology of mitochondria appears comparable in control and mutant OHCs. Color coding is shown below images. G, G′, Double-labeling for F-actin and NMIIb shows perijunctional colocalization in control OHCs. Note the puncta-like expression of NMIIb. Squares in G, G′ mark the cell shown in I. H, H′, Along with expansion of the apical surface of mutant OHCs, NMIIb delocalizes from the cortex into diffuse cytoplasmic expression (asterisk). Note that cortical NMIIb localization is maintained in non-recombined inner hair cells. Squares in H, H′ mark the cell shown in J. I, J, Higher magnification views of boxed areas in G, G′ and H, H′, respectively. Cortical NMIIb is expressed in a puncta-like pattern (arrows) in the control OHC (I). Mutant OHC lacks the strictly cortical expression of NMII and its puncta-like pattern (J). Note that this image shows a RhoA-depleted OHC before its extrusion from the epithelium. Abbreviations: cp, cuticular plate; ihc, inner hair cell; ohc, outer hair cell; s, stereocilia; TM, tamoxifen. Scale bar (in J): A, B, 10 µm; C, D, 3 µm; E, F, 5 µm; G–H′, 8.5 µm; I, J, 3 µm.


Tables
Type and analysis Cochleas Cochleas total Analysis area (µm) Measurements/sample Measurements total n Average SD Two-tailed t test Reticular lamina length (µm) E18 1.17 × 10⁻¹¹ Control 4 18 18.44 3.94 SBEM 1 70 9 9 Confocal 3 3 × 100 3 9 Gfi1GFP/GFP 3 12 5.47 0.84 SBEM 1 61 3 3 Confocal 2 2 × 100 3 9 0.051 Adult Control 4 13 25.58 2.02 SBEM 2 46; 75 3; 4 7 Confocal 2 2 × 100 3 6 KAFU 4 12 24.04 2.04 SBEM 2 67; 75 3 6 Confocal 2 2 × 100 3 6 Deiters cell surface area (µm2) E18 0.41 Control 3 46 13.08 3 SBEM 1 70 25 25 Confocal 2 2 × 100 9;12 21 Gfi1GFP/GFP 3 55 12.77 4.15 SBEM 1 61 27 27 Confocal 2 2 × 100 9;19 28 Adult 1.23 × 10⁻²⁷ Control 3 46 25.23 5.32 SBEM 2 46; 75 10;16 26 Confocal 1 100 20 20 KAFU 4 60 43.97 7.55 SBEM 2 67; 75 6;14 20 Confocal 2 2 × 100 18;22 40 Hair cell surface area (µm2) OHCs 1.90E-22 E18 control Confocal 6 50–120 19; 15; 17; 19; 31; 57 158 28.91 3.21 E18, TM E13–14 RhoAfl/fl;Fgfr3-iCreERT2 Confocal 7 50–120 10; 17; 14; 21; 7; 25; 33 127 45.62 15.72 IHCs 0.61 E18 control Confocal 6 50–120 6; 5; 5; 6; 8; 19 49 36.1 4.81 E18, TM E13–14 RhoAfl/fl;Fgfr3-iCreERT2 Confocal 5 50–120 5; 6; 10; 10; 11 42 35.5 5.94
In this issue


