

Article Figures & Data
Figures
- Figure 1.
Rapamycin treatment reduces, but does not normalize, the increased activity of hilar inhibitory interneuron 8–12 weeks after CCI injury. A, Representative traces showing spontaneous action potential firing from three different treatment groups: control (i.e., sham and contralateral neurons), ipsilateral to CCI injury + vehicle (CCI Ipsi), and ipsilateral to CCI injury + 3 mg/kg rapamycin (CCI + Rapa Ipsi). B, Mean spontaneous action potential firing in sham, CCI Contra, CCI Ipsi, CCI + Rapa Contra, and CCI + Rapa Ipsi groups. Error bars indicate SEM; *p < 0.05 compared to sham and contralateral hemispheres; #p < 0.05 for CCI Ipsi versus CCI + Rapa Ipsi.
- Figure 2.
Rapamycin treatment reduces, but does not normalize, the increase in sEPSC frequency in hilar inhibitory interneurons 8–12 weeks after CCI injury. A, Representative traces showing sEPSCs in eGFP+ neurons from three different treatment groups: control (i.e., sham and contralateral neurons), ipsilateral to CCI injury + vehicle (CCI Ipsi), and ipsilateral to CCI injury + 3 mg/kg rapamycin (CCI + Rapa Ipsi). Expanded sections of the trace under the black line are indicated by arrows. B, Mean sEPSC frequency, amplitude, and whole-cell capacitance in sham, CCI Contra, CCI Ipsi, CCI + Rapa Contra, and CCI + Rapa Ipsi groups. Error bars indicate SEM; *p < 0.05 compared to sham and contralateral hemispheres; #p < 0.05 for CCI Ipsi versus CCI + Rapa Ipsi; †p < 0.05 compared to sham, CCI Contra, and CCI Ipsi.
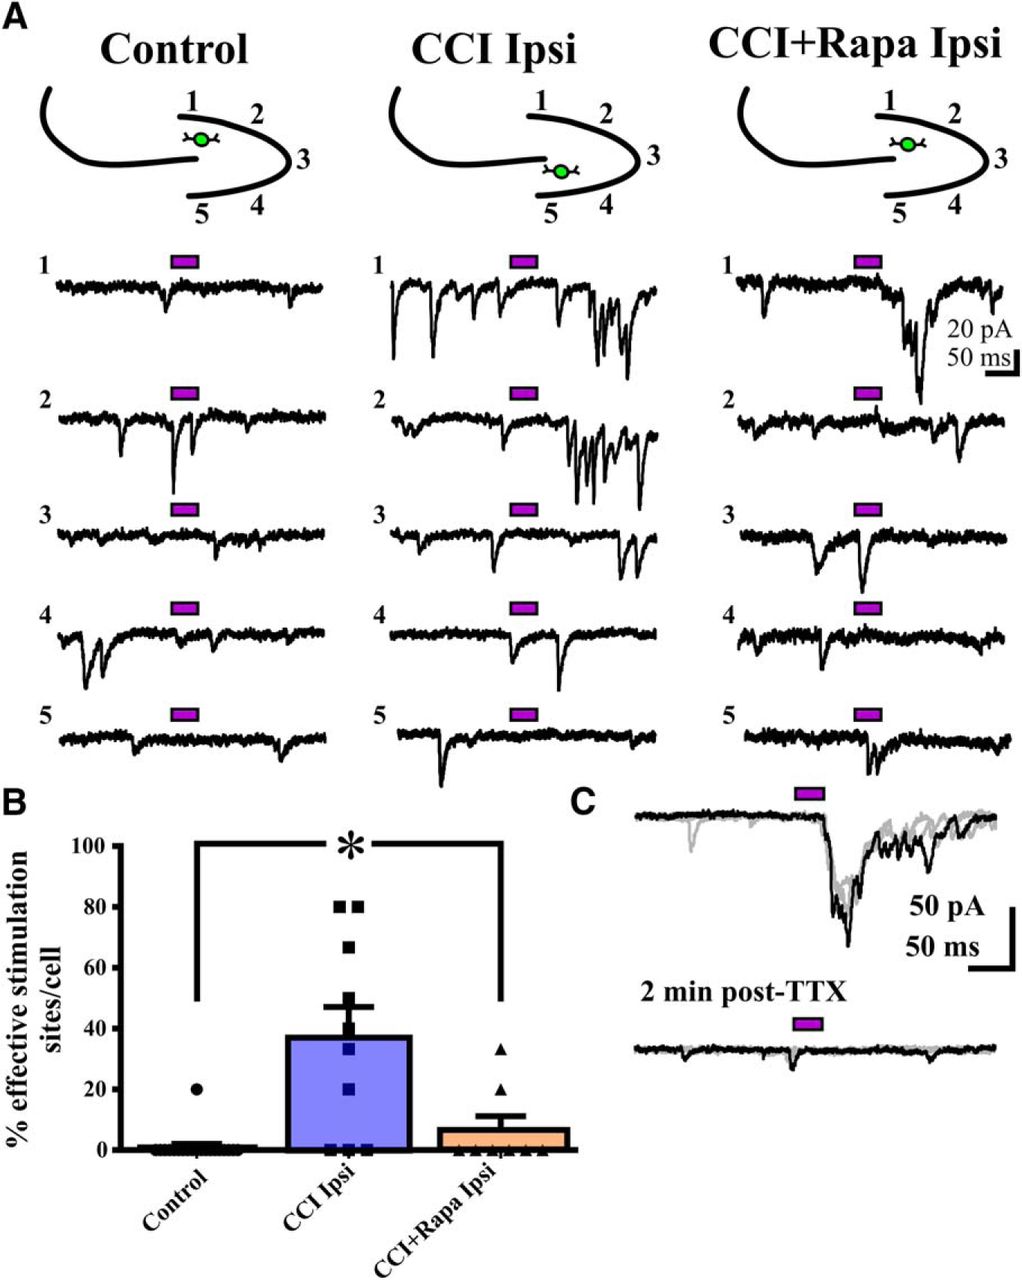
- Figure 3.
Rapamycin treatment abrogates the injury-induced increase in synaptic input from DGCs to hilar inhibitory interneurons 8–12 weeks after CCI injury. A, Representative eEPSC responses in eGFP+ interneurons to glutamate photostimulation applied to DGCs from three different treatment groups: control (i.e., sham and contralateral hemispheres), CCI Ipsi, and CCI + Rapa Ipsi. Bars above traces indicate glutamate photostimulation period. The relative position of the recorded hilar interneuron (green) and numbered stimulation sites in the dentate gyrus are shown on the stereotyped drawing above each set of traces; numbers for traces correspond to stimulation site numbers in the drawing. B, Individual and mean percentage of effective stimulation sites in control, CCI Ipsi, and CCI + Rapa Ipsi groups. C, The synaptic response of a eGFP+ hilar interneuron after photostimulation of DGCs (top trace) is blocked in the presence of TTX (2 µM; bottom trace), additional stimulation sweeps in gray. Error bars indicate SEM; *p < 0.05 compared to control. The number of stimulation sites, cells, and animals from separate treatment groups are presented in Table 3.
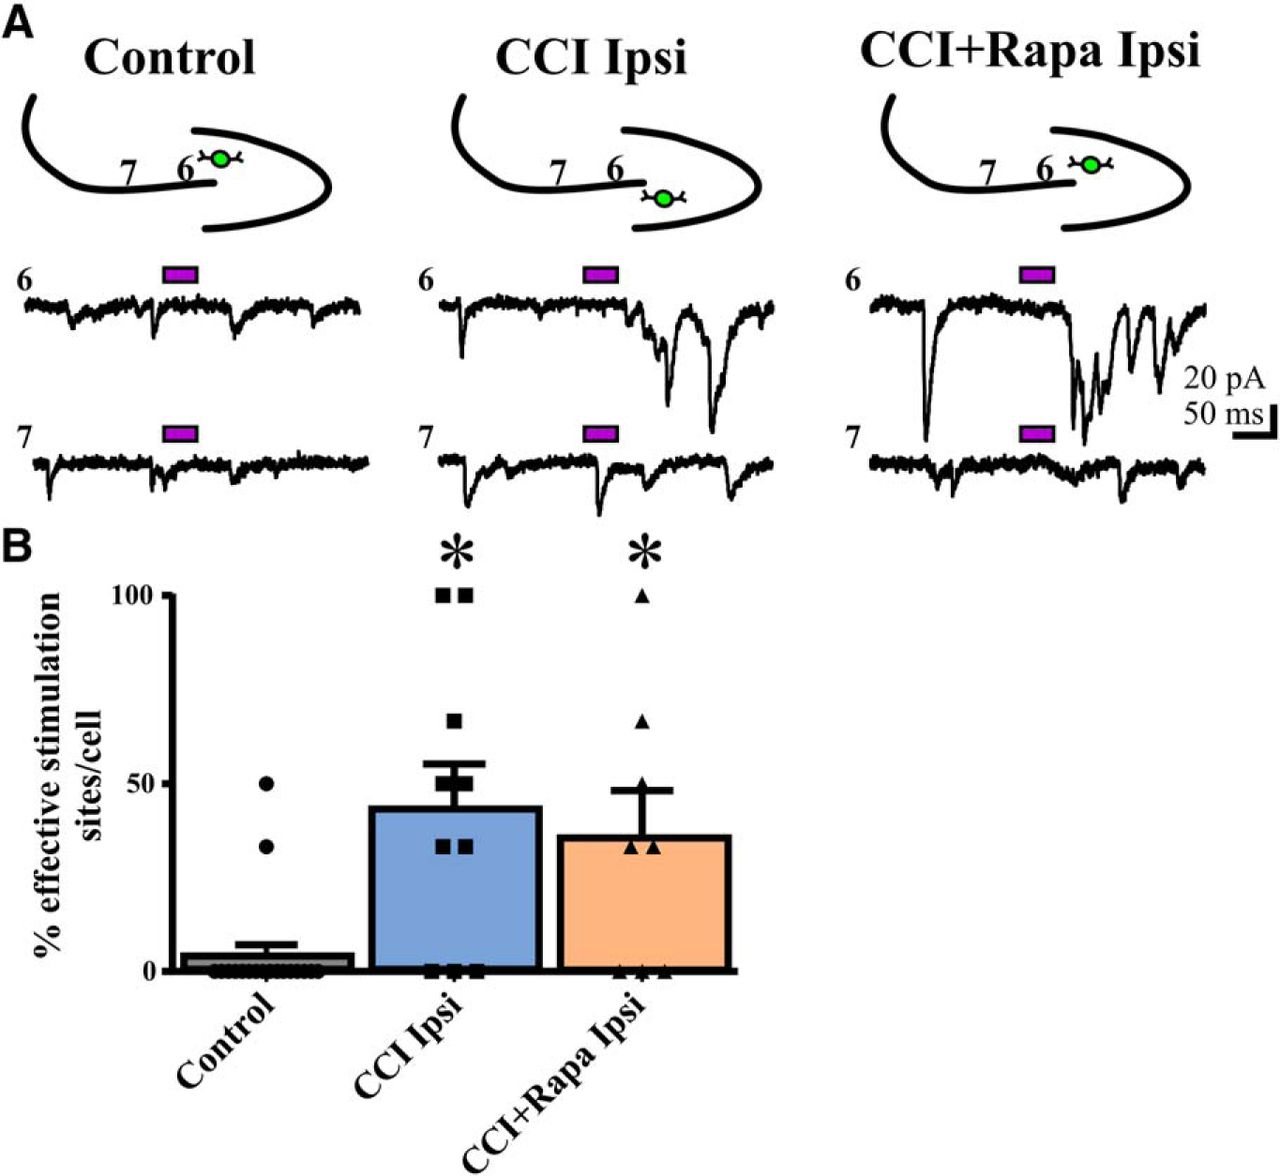
- Figure 4.
Rapamycin fails to suppress the injury-induced increase in eEPSC responses from CA3 pyramidal cells to eGFP+ hilar interneurons 8–12 weeks after injury. A, Representative traces showing responses in eGFP+ hilar interneurons to glutamate photostimulation applied to CA3 pyramids from three different treatment groups: control, CCI Ipsi, and CCI + Rapa Ipsi. Bars above traces indicate glutamate photostimulation period. The relative position of the recorded hilar interneuron (green) and numbered stimulation sites in the CA3 pyramidal cell layer are shown on the stereotyped drawing above each set of traces. B, Individual and mean percentage of effective stimulation sites in control, CCI Ipsi, and CCI + Rapa Ipsi groups. Error bars indicate SEM; *p < 0.05 compared to control. The number of stimulation sites, cells, and animals from separate treatment groups are presented in Table 3.
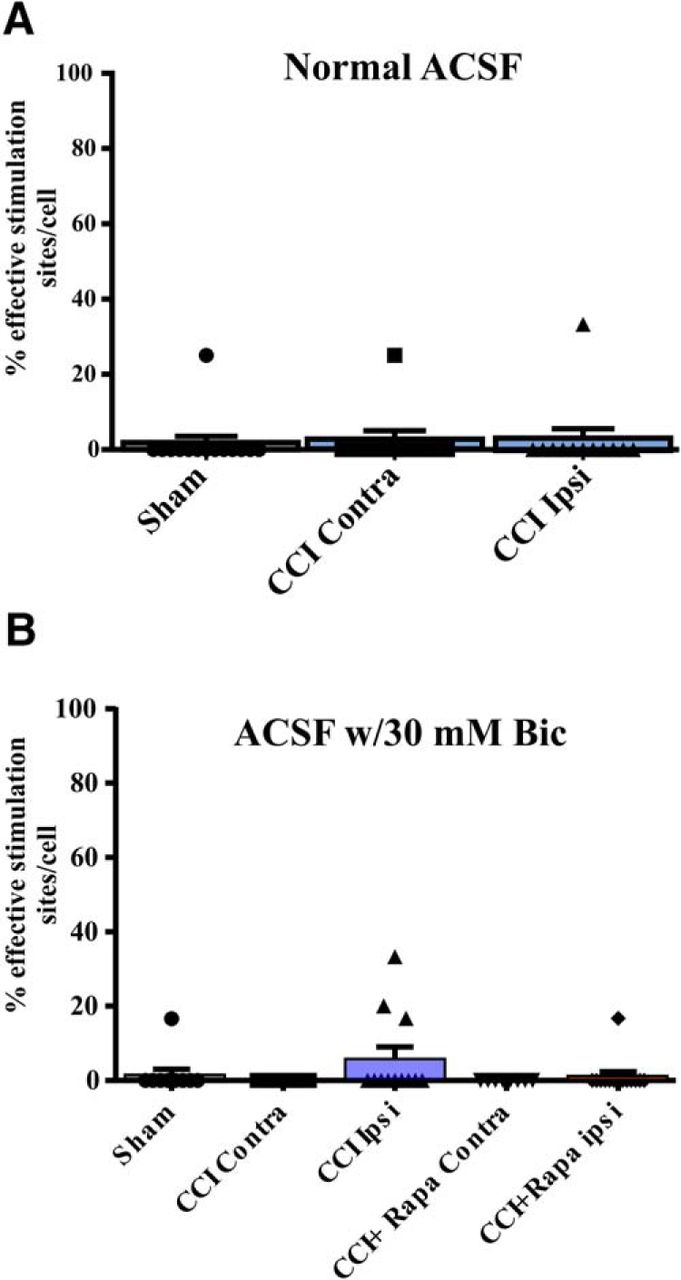
- Figure 5.
eEPSC responses in DGCs after glutamate photostimulation of CA3 pyramidal cells 8–12 weeks after injury. A, Individual and mean percentage of effective stimulation sites. Responses in DGCs from three different treatment groups: sham, CCI Contra, and CCI Ipsi in normal ACSF. B, Individual and mean percentage of effective stimulation sites for DGCs in the presence of 30 μM bicuculline from three different treatment groups: control (i.e., sham and contralateral hemispheres), CCI Contra and Ipsi, and CCI + Rapa Contra and Ipsi. The number of stimulation sites, cells, and animals from separate treatment groups are presented in Tables 4, 5.
- Figure 6.
Diagramatic representation of effects of rapamycin treatment on dentate gyrus circuitry after focal brain injury. A, Normal circuit in dentate gyrus. The projection of a DGC onto a CA3 pyramidal cell is shown (solid black arrow). GABAergic hilar inhibitory interneurons are also present, but are not robustly innervated by DGCs or CA3 pyramidal cells (dashed arrows). B, Functional synaptic input to surviving hilar interneurons arising from activity in both DGCs and CA3 pyramidal cells (red arrows) are increased ipsilateral to CCI injury, as are connections between DGCs (red oval; Hunt et al., 2010, 2011; Butler et al., 2015). C, mTOR inhibition after CCI injury reduces reorganization of functional DGC connections with surviving hilar inhibitory interneurons, but aberrant excitatory connection arising from CA3 pyramidal cell activity is sustained. This cartoon does not discriminate between mono- and polysynaptic connections. Line thickness is used as a surrogate marker for the percentage effective stimulation sites as assessed by glutamate photolysis here and in Hunt et al. (2010).


Tables
Outcome measure Data structure Type of test Power a. ΔsEPSC frequency Nominal data, non-normal distribution Kruskal Wallis 0.05 b. Weight change Normal distribution One-way ANOVA 0.99 c. Action potential firing rate Normal distribution One-way ANOVA 0.98 d. sEPSC frequency Normal distribution One-way ANOVA 0.8 e. sEPSC amplitude Normal distribution One-way ANOVA 0.06 f. eGFP+ neuron whole-cell capacitance Normal distribution One-way ANOVA 0.72 g. DGC RMP Normal distribution One-way ANOVA 0.05 h. eGFP+ neuron RMP Normal distribution One-way ANOVA 0.06 i. CA3 neuron RMP Normal distribution One-way ANOVA 0.11 j. Direct photostimulation evoked AP’s in DGCs Normal distribution One-way ANOVA 0.05 k. Direct photostimulation evoked AP’s in eGFP+ neurons Normal distribution One-way ANOVA 0.05 l. Direct photostimulation evoked AP’s in CA3 neurons Normal distribution One-way ANOVA 0.05 m. % effective stimulation sites to DG photostimulation per eGFP+ neuron, controls Nominal data, non-normal distribution Kruskal Wallis 0.05 n. % effective stimulation sites to DG photostimulation per eGFP+ neuron Nominal data, non-normal distribution Kruskal Wallis 0.68 o. % effective stimulation sites to CA3 photostimulation per eGFP+ neuron, controls Nominal data, non-normal distribution Kruskal Wallis 0.05 p. % effective stimulation sites to CA3 photostimulation per eGFP+ neuron Nominal data, non-normal distribution Kruskal Wallis 0.4 q. % effective stimulation sites to CA3 photostimulation per DGC nACSF Nominal data, non-normal distribution Kruskal Wallis 0.05 r. % responsive sites to CA3 photostimulation per DGC ACSF w/30 μM Bic Nominal data, non-normal distribution Kruskal Wallis 0.12 - Table 2.
RMP and direct photoactivation measures for DGCs, eGFP hilar neurons, and CA3 pyramidal neurons
Cell type Group Number of cells Number of animals Direct photoactivation (number of APs) RMP (mV) DGC Control 66 32 5.31 ± 0.43 −67.11 ± 0.97 DGC CCI ipsi 24 7 6.04 ± 0.80 −66.73 ± 2.18 DGC CCI + Rapa ipsi 14 7 5.54 ± 0.92 −65.63 ± 2.03 eGFP+ neuron Control 20 15 3.88 ± 0.57 −54.72 ± 1.95 eGFP+ neuron CCI ipsi 10 6 3.44 ± 0.62 −52.33 ± 1.63 eGFP+ neuron CCI + Rapa ipsi 8 7 3.78 ± 0.72 −60.64 ± 3.46 CA3 neuron Control 16 11 3.79 ± 0.35 −55.76 ± 1.78 CA3 neuron CCI ipsi 7 4 4.03 ± 0.76 −49.53 ± 2.77 CA3 neuron CCI + Rapa ipsi 6 3 3.53 ± 0.61 −48.39 ± 4.23 No significant differences were detected within any cell type.
- Table 3.
Responses of eGFP+ hilar inhibitory interneurons to photostimulation of DGCs and CA3 neurons
Group Responsive DG stimulation sites Responsive CA3 stimulation sites Number of cells Number of animals Net eEPSC frequency DG stimulatio n Net eEPSC frequency CA3 stimulation Sham 1/34 0/18 9 5 0.13 ± 0.08 0.09 ± 0.10 CCI contra 3/36 1/14 6 5 0.31 ± 0.13 0.28 ± 0.14 CCI ipsi 22/55* 10/25* 10 6 0.90 ± 0.19* 1.31 ± 0.43* CCI + Rapa contra 1/26 1/10 5 5 0.04 ± 0.10 0.02 ± 0.38 CCI + Rapa ipsi 7/40 8/18* 8 7 0.33 ± 0.11 1.27 ± 0.44* Significant differences from control indicated with an asterisk.
Group Number of effective stimulation sites Number of cells Number of animals Sham 1/67 14 4 CCI contra 1/46 10 6 CCI ipsi 3/57 12 5 - Table 5.
Responses of DGCs from control groups to photostimulation of CA3 neurons in ACSF containing 30 μM bicuculline
Group Number of effective stimulation sites Number of cells Number of animals Net eEPSC frequency Sham 2/57 11 4 0.22 ± 0.06 CCI contra 0/40 9 6 0.13 ± 0.06 CCI ipsi 3/49 12 6 0.08 ± 0.04 CCI + Rapa contra 0/49 10 7 0.05 ± 0.04 CCI + Rapa ipsi 1/78 14 7 0.01 ± 0.01
In this issue


