

Article Figures & Data
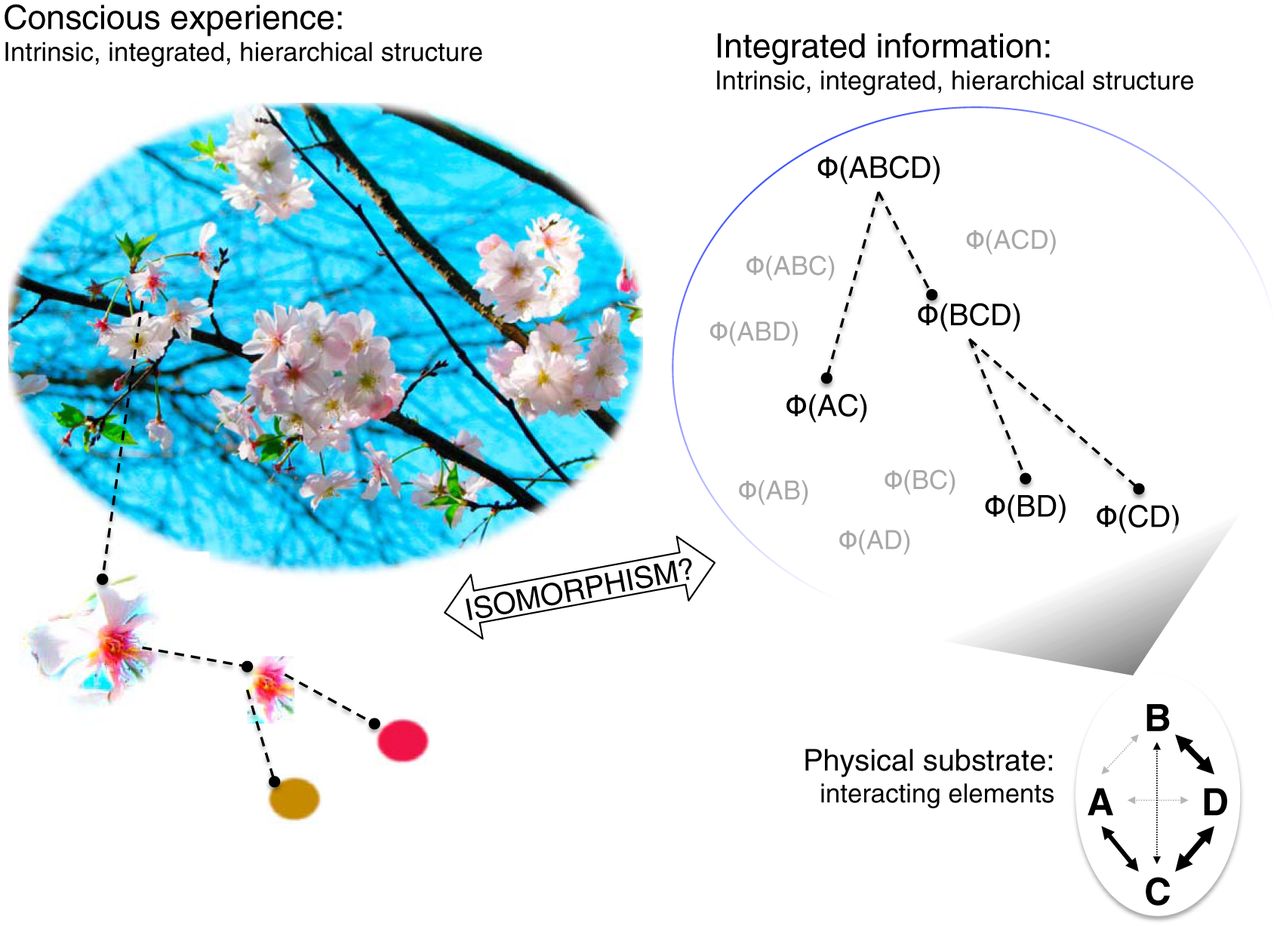
- Figure 1.
Left, Conscious experience is a multilevel integrated pattern, where, for example, distinct colors constitute shapes, which constitute distinct objects, which constitute distinct scenes, which are part of a multimodal conscious percept. Right, A system of interacting elements (ABCD, lower right corner) generates a multilevel pattern of integrated information. In this example, an integrated system ABCD is supported by AC and BCD, with the latter further supported by BD and CD. IIT proposes that such a pattern of integrated information is isomorphic to the structure of a conscious experience.
- Figure 2.
Derivation of integrated information for a “simplest” system of two data channels, X1 and X2, depicted by the two connected nodes on the far left. We assume that X1 and X2 can take continuous values at each time. A, Entropy is the uncertainty of the system's states at time t, corresponding to its spread. X[t] is represented as a cloud of dots, a random distribution of joint values of X1 (state of unit 1) and X2 (state of unit 2). B, Mutual Information. If states at time t-τ (X[t-τ]) are given, then uncertainty about the state at time t is reduced; this reduction, illustrated by the green “shrinkage” of the entropy, is called the Mutual information (I). C, Integrated Information. Mutual information can be measured for the whole system, I(X1, 2), and for each part of a “cut” system, I(X1) and I(X2). Note we dropped t and τ for simplification. If the information of the whole system is greater than the sum of the information in the parts of the cut system, the residual is Integrated Information (Φ*), information generated only by the whole system. Note that this formulation is only for an intuitive illustrative purpose. We estimate the sum of the information of the cut systems using a more sophisticated method of “mismatched decoding,” which guarantees that 0 <= Φ* <= I (Oizumi et al., 2016a).
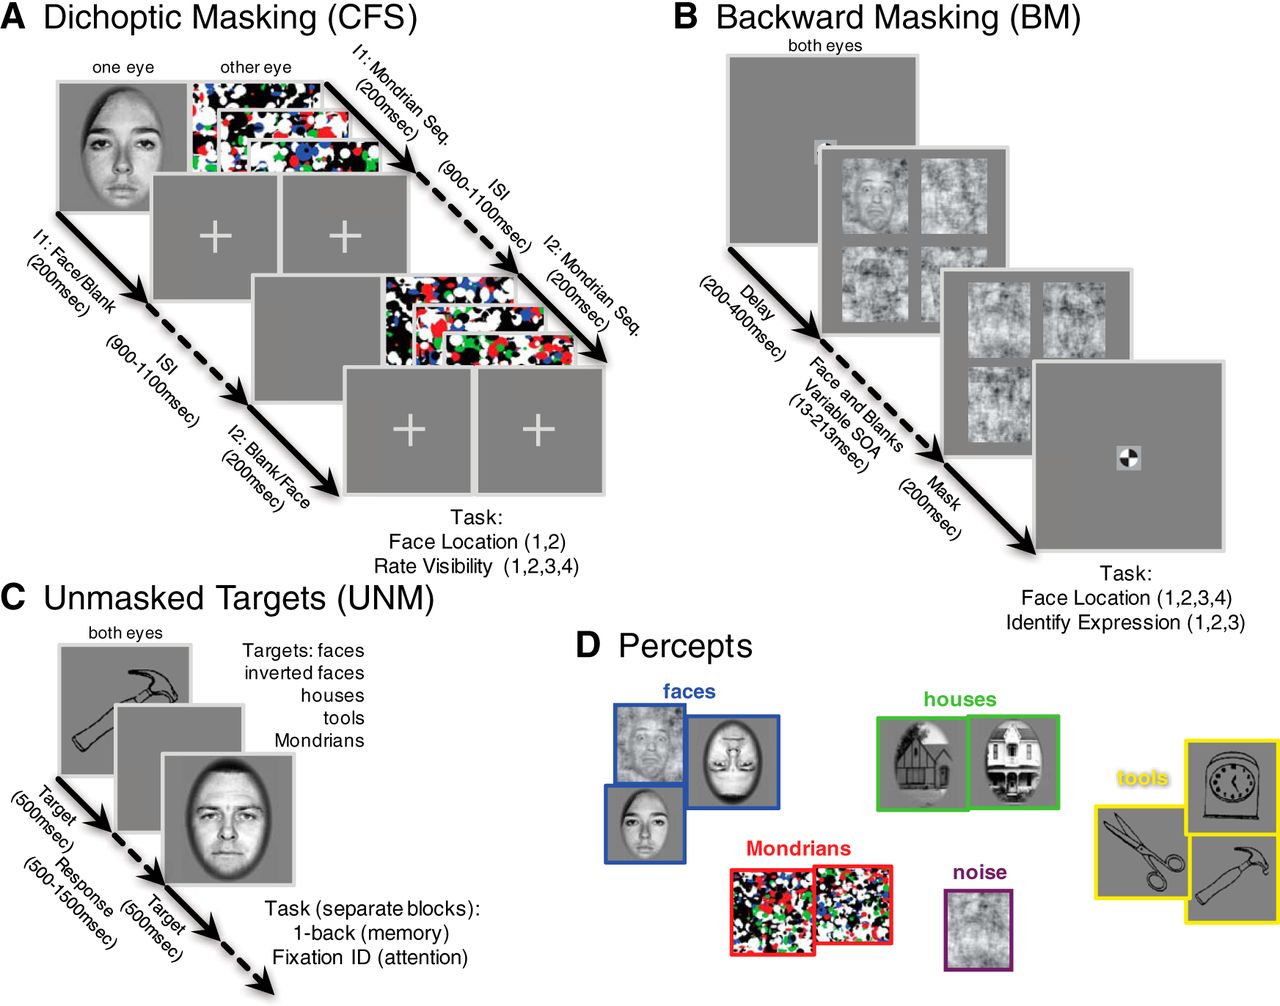
- Figure 3.
Paradigms for stimulus presentation. A, CFS task. Each trial consisted of a temporal sequence of two stimulus intervals, separated by a random interstimulus interval (ISI, 900–1100 ms). In one eye, each interval contained three flashes of colorful Mondrian patterns; in the other eye, one interval contained a face image of variable contrast. These conditions result in stochastic trial-to-trial visibility of the target face; sometimes the face is consciously seen, sometimes it is not. The subjects’ task was to select which interval contained the face, and to indicate how visible it was on a scale of 1–4. B, BM task. After a random fixation delay, subjects saw an array of four noise patches, one of which contained a face image (the upper left, in the illustration), for 13 ms. After a variable SOA, another array of noise patches was presented to reduce the visibility of the face. The subject’s task was to identify the location of the face target among four possible locations, and also to identify its emotional expression among three possible labels (happy, fearful, and neutral). C, Unmasked conditions included a one-back memory task, in which subjects paid attention to the category of the stimuli, or a simple fixation task, in which they detected a change of color orientation of the fixation cross. In both tasks, faces and other objects were presented for 500 ms without any masks, with trials separated by a blank interval (500 ms for the fixation task, 1000 ms for the one-back task). D, From subjects’ performance on a task (correct/incorrect, ratings of visibility, identification of expression), we can reasonably infer their percept on each trial of an experiment. We used subjects' performance to divide trials into the percept categories shown here: faces (and inverted faces), houses, tools, Mondrians, and noise.
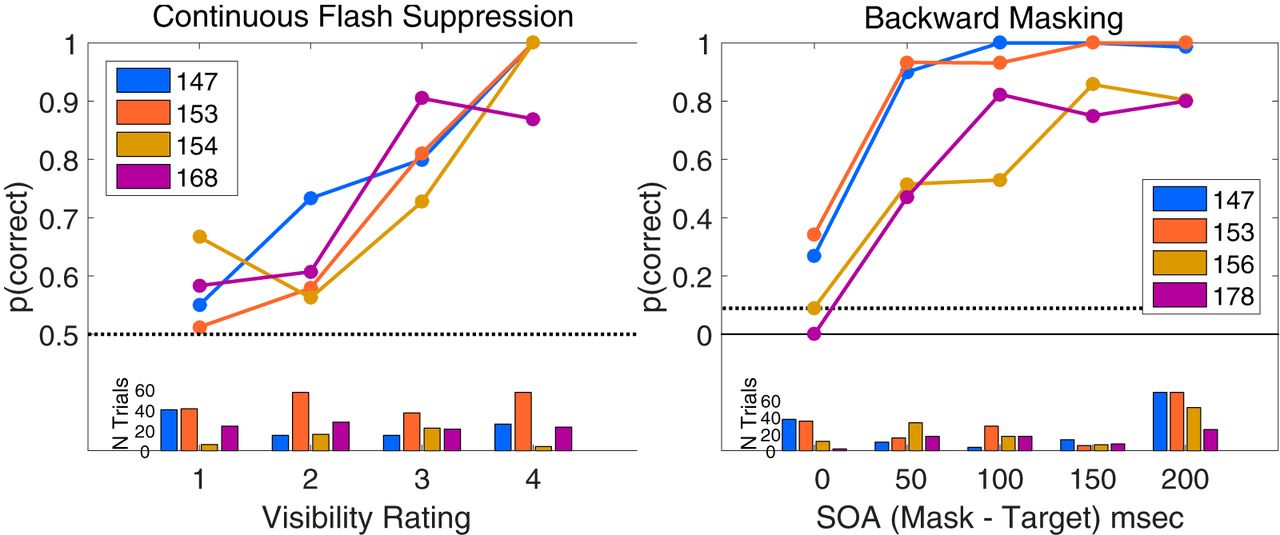
- Figure 4.
Behavioral performance on the CFS and BM tasks. Subjects who participated in each task are identified in the legend. Upper panels show proportion correct for each task. Lower panels show the number of trials at each trial type. Left, Proportion correct for four CFS subjects, as a function of visibility rating. Trials rated as 3 or 4 were treated as visible in the classification analyses. Right, Proportion correct for BM subjects, as a function of (binned) backward-mask SOA. Trials where subjects were correct on both 4AFC location and 3AFC emotion judgments (here coded as “correct,” making chance level 1/12) were treated as visible in the classification analyses. Catch trials were not included in the graph.
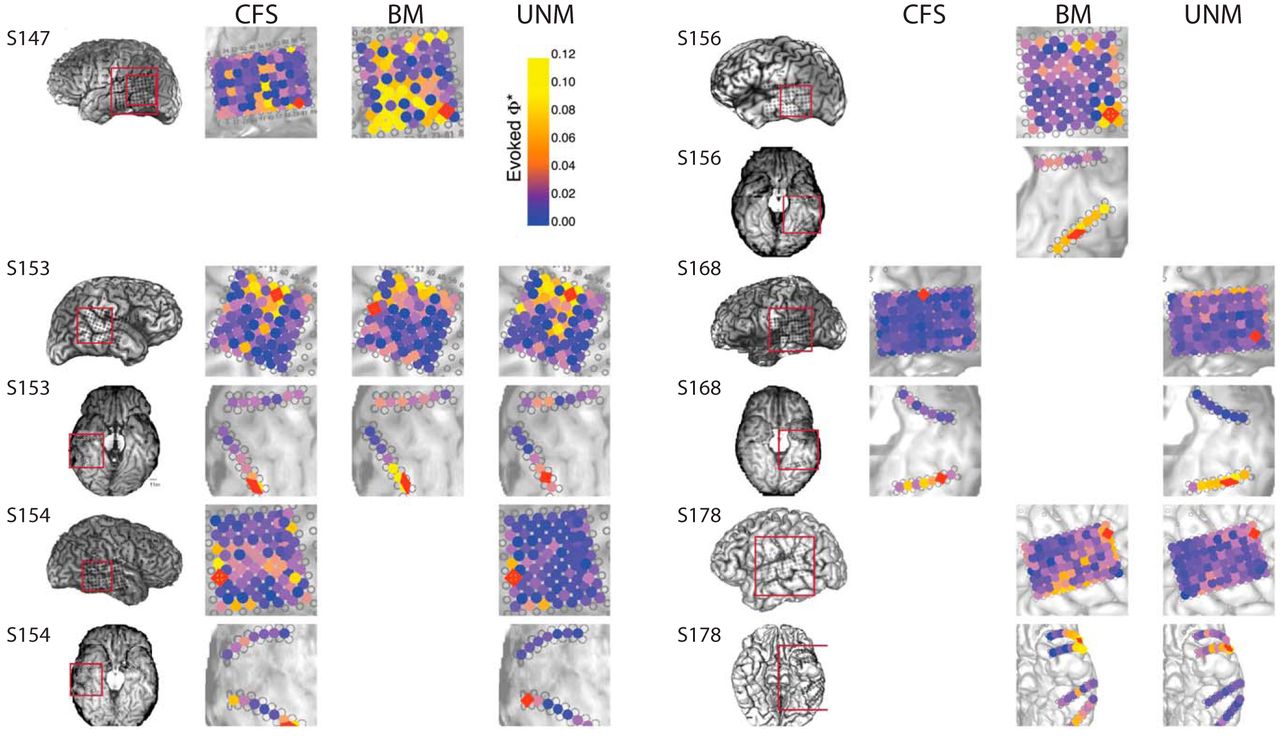
- Figure 5.
Max evoked Φ* searchlight and ROI selection. For each of 22 conditions (combinations of six subjects with ventral and/or lateral electrode implantation, and three stimulus paradigms, as represented by the rows and columns of the figure), we computed the average Φ*-pattern (over all experiment trials) for every four-channel system (square and rhombuses where each vertex is adjacent to the next), at each of four τ values (1.5, 3, 6, and 12 ms). As an ROI for further analysis, we chose one channel set that contained the subsystem with the highest Φ* regardless of stimulus/percept (see Materials and Methods for details). The selected regions for classification analysis (Figs. 9, 11) are marked in red. Estimated anatomic region of the max evoked-Φ* channel set are given in Table 1. Marker colors encode the magnitude of the maximal evoked Φ* at the centroid of each system (values above 0.1 are all given the color yellow).
- Figure 6.
Measuring the integrated information pattern in ECoG data. A, ECoG recording. Black rings mark the location of electrodes; we used bipolar re-referenced channels between each local pair of electrodes. Four of these are marked in color. B, Means (thick lines) and SDs (shades) of the field potentials for the four channels marked in A, from 500 ms before to 1000 ms after a face stimulus onset. Here, we included intervals over 45 trials in the CFS experiment where the high-contrast face target was reported as highly visible by Subject 153. C–E, Time courses of the entropy H (C), mutual information I (D), and integrated information Φ* (E) for each of 11 subsystems. Each subsystem is a subset of the channels in the system ABCD. Values were estimated over a time window T = 200 ms and with time lag τ = 3 ms. Entropy and the mutual information are proportional to the number of channels, so we plot values in C, D per channel for each subsystem, to emphasize the dynamics over all subsystems. The dynamics of Φ* are highly idiosyncratic. Note the increase in Φ* for subsystems BD and ACD, after the stimulus onset.
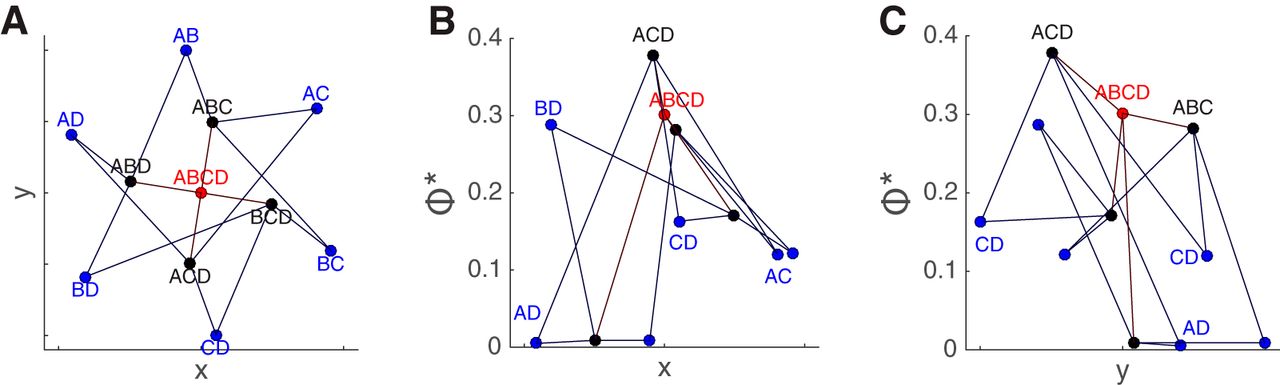
- Figure 7.
Integrated information pattern presented on a Hasse graph. See also Video 1. A, The graph for all subsystems in the system ABCD as evaluated in Figure 6 (the same visible face trials in the CFS task) in the interval 200–400 ms. The x and y coordinates here are assigned for visualization purposes. Each node in the graph is one of the 11 subsystems in the system ABCD. The edges of the graph represent addition or subtraction of a single channel from a subsystem. The color of each node represents the number of channels in subsystem: blue nodes are two-channel subsystems, black nodes are three-channel subsystems, and the red node is the “top” four-channel subsystem. B, The same graph viewed along the y-axis, with the magnitude of Φ* represented on the vertical (z) axis. Three-channel subsystem ACD labeled in black attained the highest Φ*. Adding or subtracting any channel to ACD only reduces Φ*. All the other subsystems in this system integrate less information than ACD, including the “enveloping” system ABCD. C, The same graph viewed along the x-axis.
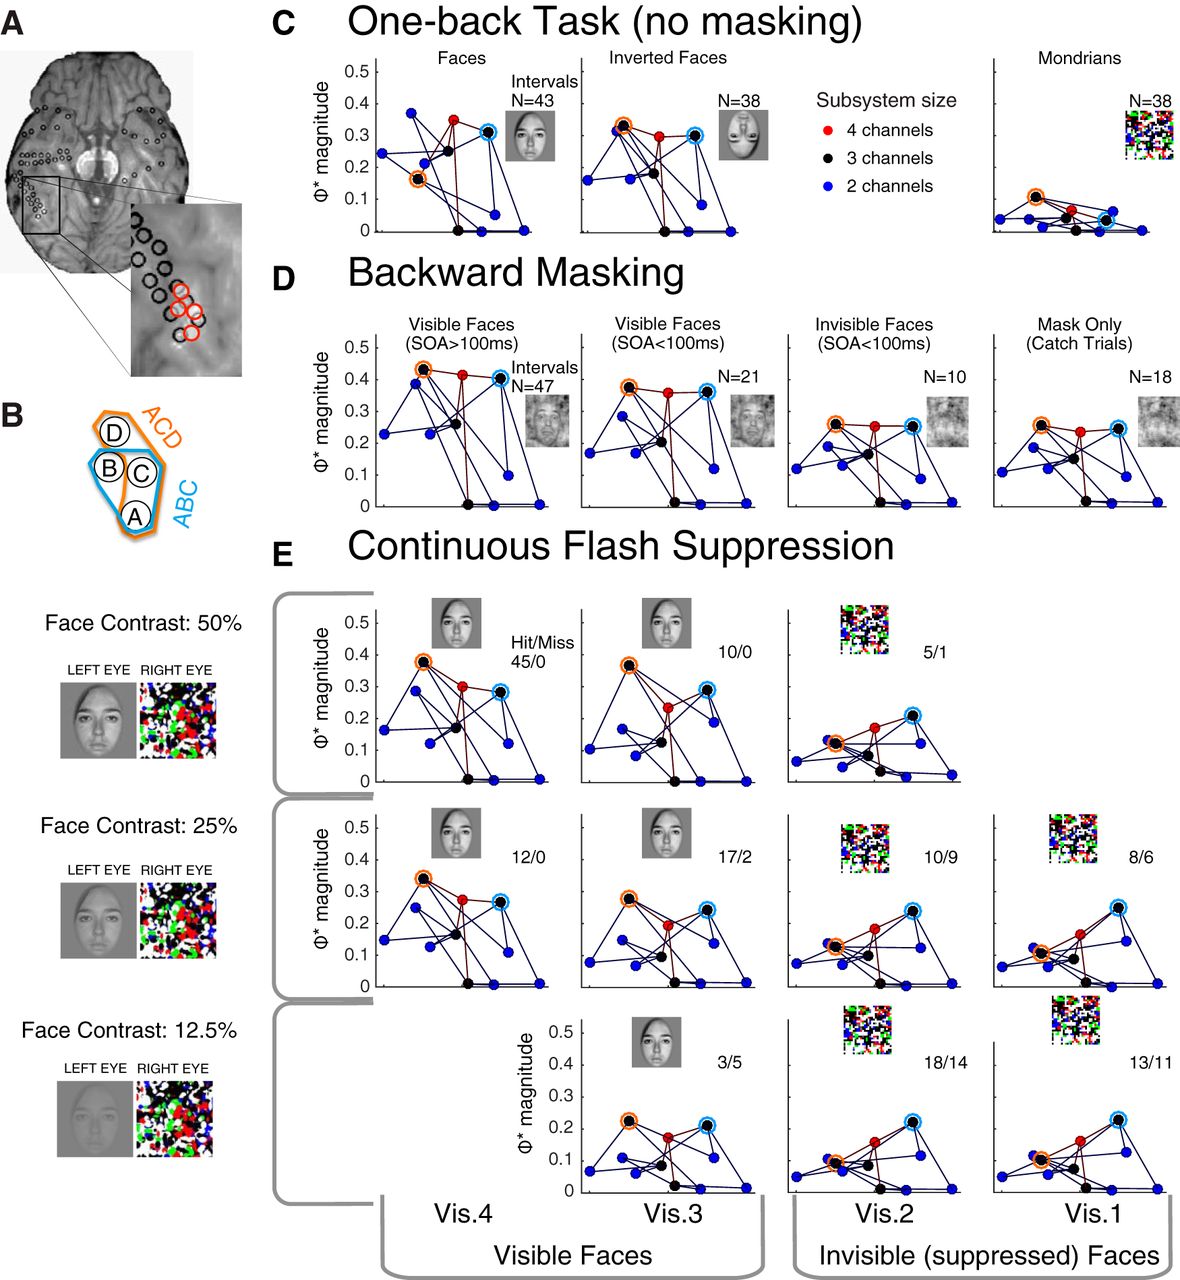
- Figure 8.
Patterns of integrated information corresponding to conscious perception of a face, generalizing across three completely different tasks and stimuli. A, S153’s right fusiform gyrus. B, Closeup of the channel configuration. Two prominent subsystems, ABC and ACD, are marked by the blue and orange circles in the following graphs (C–E). C–E, Φ*-pattern graphs in the interval 200–400 ms after stimulus onset in multiple percept/stimulus conditions in three stimulus paradigms. Marker colors mean the same thing as in Figure 7. The same channel system in subject 153 is analyzed here as in Figures 6, 7. C, Unmasked stimulus paradigm: Φ*-patterns for trials with the unmasked stimuli in the one-back experiment: faces, inverted faces, and Mondrians. D, BM paradigm: Φ*-patterns generated in the four trial types in the BM experiment: visible face trials here are those where the subject correctly localized (4AFC) and identified emotion (3AFC) of the masked face, shown separately for long and short SOA trials; invisible face trials are those short SOA trials where the subject was incorrect for localization; and mask only trials were catch trials where no faces were presented. E, CFS paradigm: Φ*-patterns from the interval that contained the face in the CFS experiment (Fig. 3). Φ*-patterns from the interval that did not contain the face were very similar to the pattern with visibility 1 or 2 in the face-present interval (data not shown). Within each row, the physical stimulus contrast was identical. Columns indicate the reported visibility of the face target. Hit/miss ratios are shown in each panel. The inset images roughly depict what was perceived in the corresponding intervals. To compute the Φ*-pattern in each panel, we used the number of trials available in the condition (N or Hit + Miss), as indicated by the inset numbers. Video 2 compares visible face trials in CFS and BM with invisible trials in CFS in a 3D rendering.
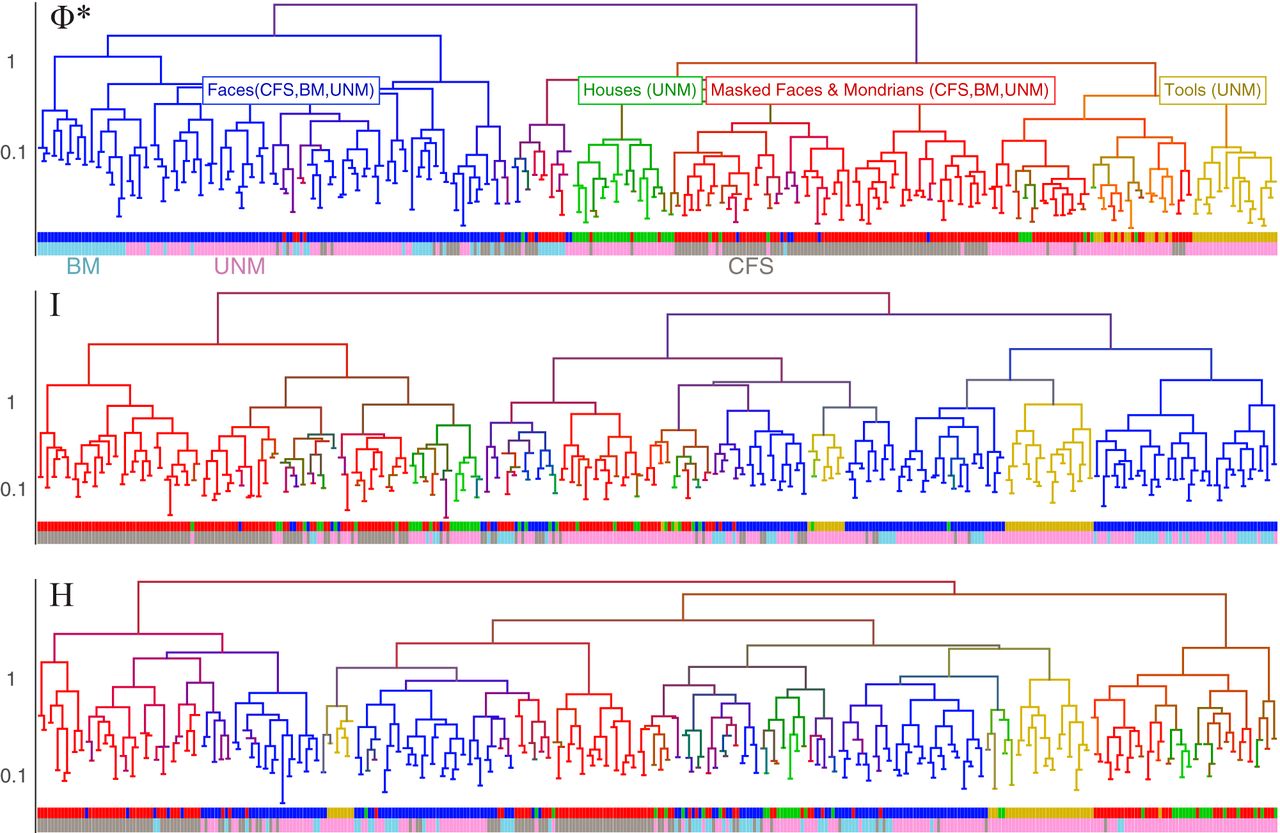
- Figure 9.
Pattern clustering for the channels featured in Figures 6-8 in subject 153, across 364 bins of three trials each. Three dendrograms are illustrated based on the patterns of Φ* (top), mutual information I (middle), and entropy H (bottom). The dendrograms represent relative (Euclidean) distance between patterns. Four coarsely defined percept categories are conscious perception of faces (blue), masking stimuli (red), houses (green), and “tools” (yellow). The red category, conscious perception of masking stimuli, corresponds to the two right columns in Figure 8, and it consists of UNM Mondrian trials, BM invisible trials (location discrimination incorrect) and catch trials (no face presented), CFS invisible face-present intervals (visibility 1 or 2), as well as CFS face-absent intervals (Fig. 3). Thus, we analyzed all available trials in BM regardless of SOAs and CFS regardless of presence or absence of the face as well as all face contrasts. Below each dendrogram are two bands of colors: the upper band identifies the percept category for each dendrogram leaf (trial bin), and the lower band identifies the stimulus paradigm: CFS (dark gray), BM (light blue), and UNM (light magenta).
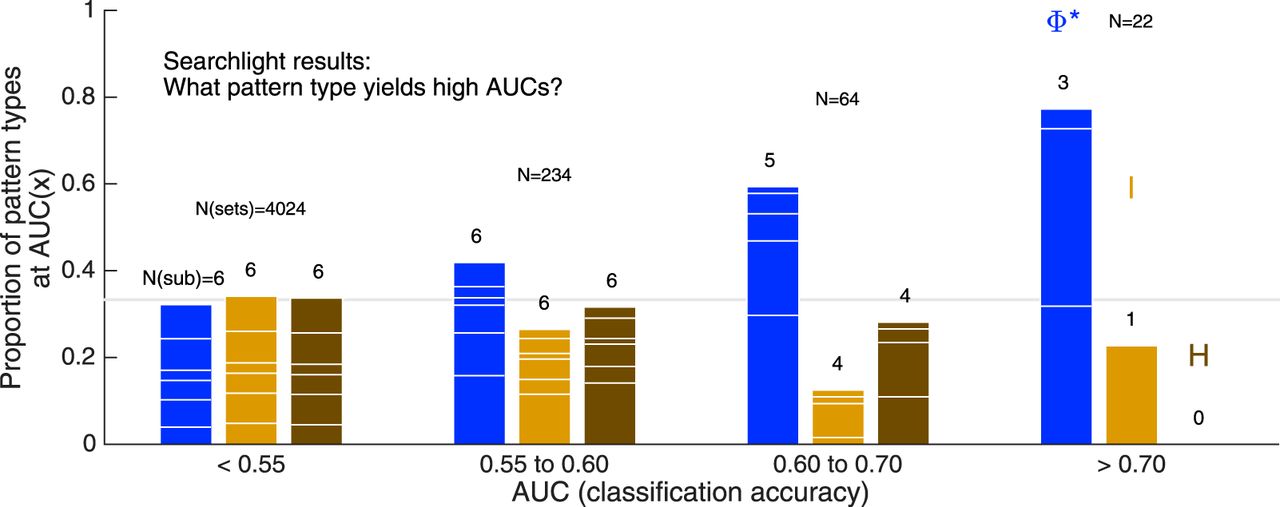
- Figure 10.
The likelihood of each pattern type given specific AUC ranges, over all searchlight locations, all stimulus paradigms, and all subjects. AUC is taken as the average between 200 and 400 ms after stimulus onset. Likelihood is the incidence of a pattern type at the given AUC, divided by the total number of sets yielding the given AUC (indicated by the N over each group of bars). Thus, the chance level is 0.33 (i.e., one of three pattern types), indicated by the horizontal gray line. Each column is subdivided according to the contribution of six subjects, the numbers over each column indicate the number of subjects contributing to each pattern type at that AUC range. This analysis does not rely on a particular channel selection strategy, and emphasizes that accurate matches with percepts (AUC > 0.6) are predominantly found with the Φ* pattern.
- Figure 11.
Percept classification accuracy for different pattern types. A, B, Trials were classified within each task. For UNM, they were classified as either faces or nonfaces; for BM, as visible versus invisible face trials (including catch trials as invisible faces); and for CFS, as visible face-present intervals versus all other intervals (including invisible and absent faces). A, Average time course of pattern classification (AUC) over 22 conditions (combinations of six subjects, three possible stimulus paradigms, and either lateral or ventral electrode implantations), where the four-channel sets were selected based on their maximal evoked Φ*. Φ*-patterns classify percept category better than mutual information and entropy patterns (I, H). Error bars are the SEM. B, Average AUC over the period between 100 and 600 ms after stimulus onset, in each of the three stimulus paradigms, for each pattern type. C, Classification accuracy for CFS trials, restricted to middle contrast face-present trials (corresponding to the middle row of Fig. 8E) for each of three observers [two with both ventral (V) and lateral (L) electrodes]. In this analysis, all trials were identical in physical stimulus contrast; above-chance classification relies only on differentiation of perceptual state. As with the analysis in A, B, the Φ* structures match contents of consciousness better than H or I structures in each observer.
- Figure 12.
A, B, Selecting systems based on a “minimal mutual information or entropy” criterion, rather than a max evoked Φ* criterion, still picks out systems where Φ* structures match with conscious percept better than other structures, although peak AUC is not as high as when the criterion is max evoked Φ* (as in Fig. 11).
- Figure 13.
To isolate the contribution of self-interactions, we repeated the main analysis described in Figure 11A, but we used only H and I derived from each channel (i.e., {H(A), H(B), H(C), H(D)}, etc.). Using these 4D patterns, instead of 11D pattern, we performed the same analysis, but the results were very poor, consistent with a critical role of cross-channel causal interactions.


- Video 1.
Four-channel Φ*-pattern (from Figs. 6, 7), rotated through 3D to clearly illustrate its construction. The x-y coordinates are arranged to illustrate the layout of the Hasse graph that connects all the subsystems. The z-coordinate is the magnitude of Φ* for each subsystem. This pattern is generated by a system of four channels over subject 153’s posterior fusiform gyrus.
- Video 2.
Four-channel Φ*-patterns for visible BM faces (left pattern), visible CFS faces (middle pattern), and invisible CFS faces or Mondrians (right pattern). Similar patterns from the same subject 153 are shown in Figure 8.
In this issue


