

Article Figures & Data
Figures
- Figure 1.
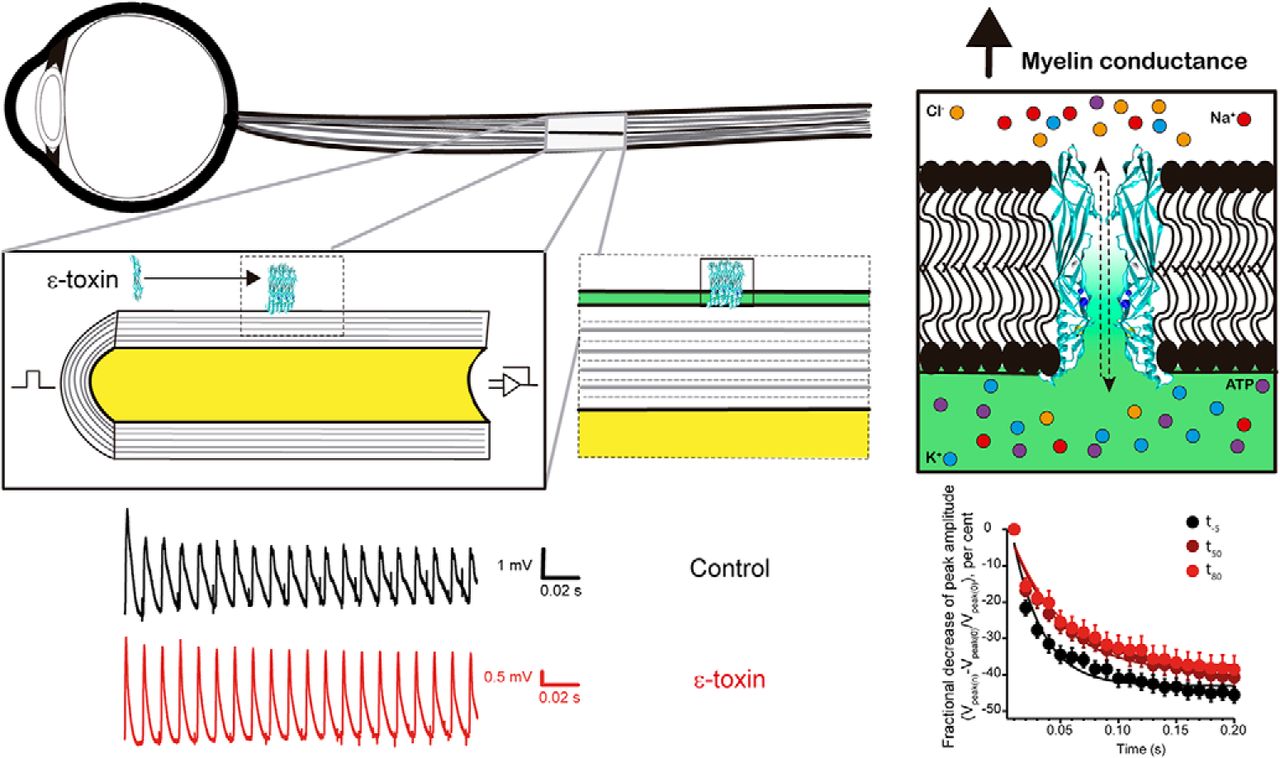
Recording CAPs from mouse optic nerve. A, Set-up diagram, the signal is generated with a stimulator and conveyed into the optic nerve through a suction electrode, then recorded using a second suction electrode and send to the amplifier. At the same time, the recording chamber is perfused with Locke solution, which recirculates to get aerated in carbogen every turn. O.N., optic nerve. B, Time line of experiment. The time was set at 0 once the ε-toxin is added to the recording chamber. Three train stimulations of 100 Hz that lasted for 200 ms were applied to the optic nerve: one before the addition of the ε-toxin (t-5), 50 min later (t50), and a last, 80 min (t80). Before ε-toxin addition, the optic nerve is let 30 min to stabilize to the set-up and Locke solution. C, Settings for CAPs analysis. The axes were placed to calculate individually the amplitude and area of the CAP. C1 and C2 are the axes set at the beginning and at the end of the CAP, respectively. The red line is set at the base level. l determines the maximum amplitude of the CAP. D, CAPs elicited at low-frequency stimulation (0.03 Hz) in control conditions before and after adding 50 µl of PBS (vehicle). At -5 min (black), minute 50 (blue), and 85 min (red). E, In ε-toxin condition, examples of CAPs at the same given times. ε-toxin was added dissolved in PBS. Scale bars are represented in each panel. Stimulus artifact was eliminated manually. Differences in shape and amplitudes of initial CAPs in D, E (black) are not related to the action of the ε-toxin, they represent the variability of recording CAPs of different animals.
- Figure 2.
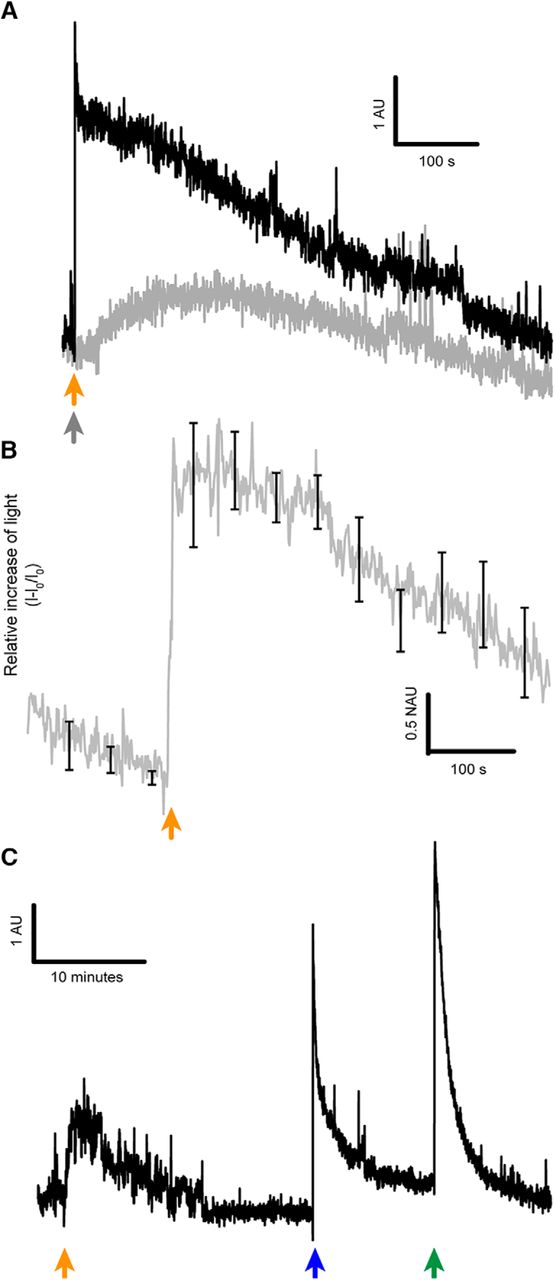
ATP release of the optic nerve on ε-toxin exposure. A, Difference of light emission of ATP when optic nerves were treated with ε-toxin (black) or prototoxin (gray). Orange arrow indicates when ε-toxin is added and gray arrow when prototoxin is added. B, Relative increase of light due to the release of ATP induced by ε-toxin (n = 4), mean values ± SEM in black. C, Light emitted indicating ATP is released by the optic nerves once the ε-toxin is applied (orange arrow), ATP is also released when 500 µl of ultrapure water (mQ) was added (blue arrow) and with Triton X-100 at 0.02% (green arrow). Scale bar represented in each panel. AU, arbitrary units; NAU, normalized arbitrary units.
- Figure 3.
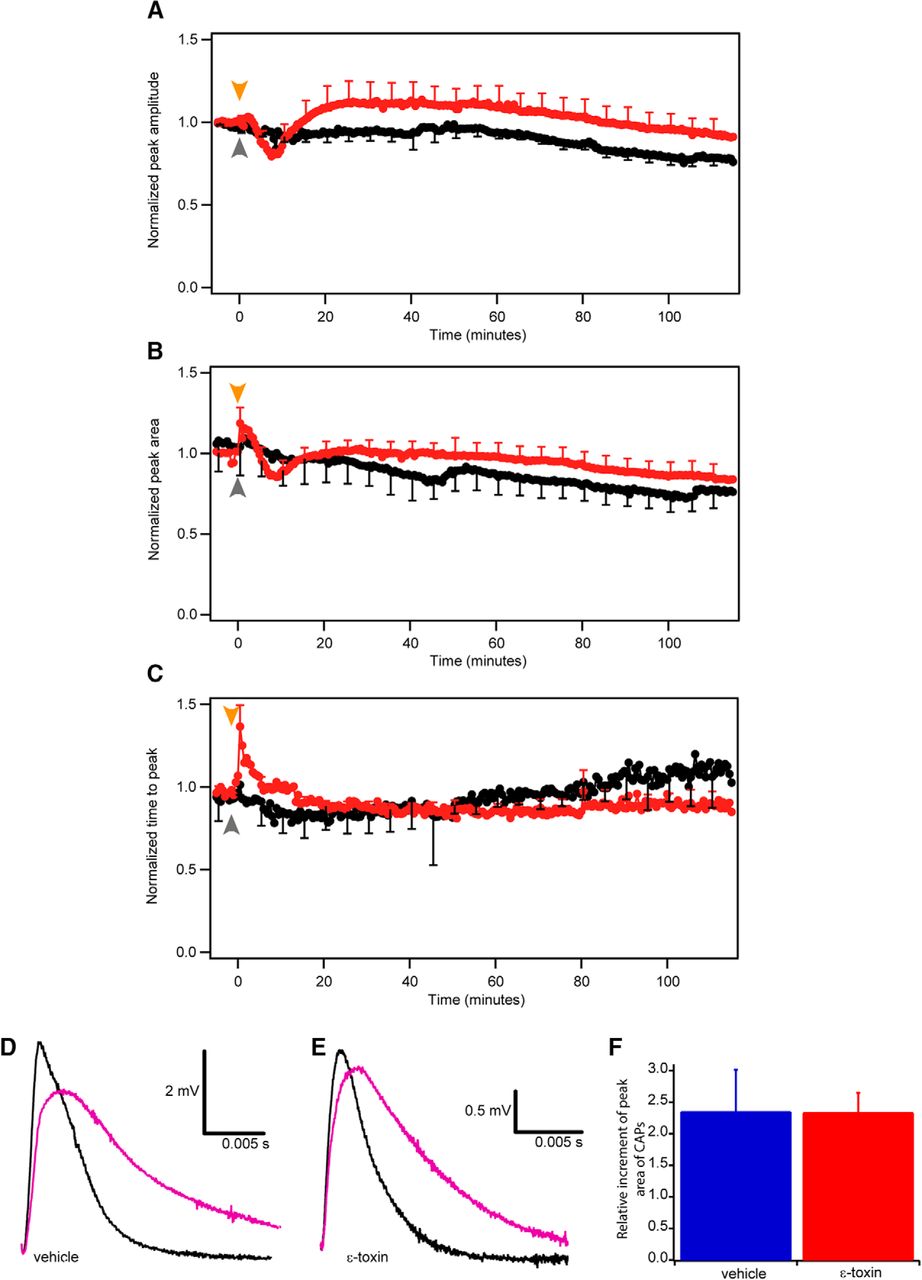
Time-course changes of the CAPs elicited at low frequency (0.03 Hz). Comparison of normalized peak amplitude (A), peak area (B), and time to peak (C) in control (black) and ε-toxin (red) conditions during 125 min. Normalization was done comparing the mean of the last nine CAPs before adding ε-toxin. Mean value ± SEM of control conditions (n = 7) and ε-toxin conditions (n = 11) are shown. Arrows represent when the vehicle (gray) or ε-toxin (orange) was added. After 115 min, 3,4-DAP is added to block potassium voltage-dependent channels present in the juxtaparanode. In nontoxin (D) and ε-toxin (E) conditions, the CAP before the addition of 3,4-DAP (black) and the CAP once 3,4-DAP is applied (purple). Scale bar represented in each panel. F, Comparison of the area increment once 3,4-DAP is applied in control (blue, n = 4) and ε-toxin conditions (red, n = 11). Mean values ± SEM represented.
- Figure 4.
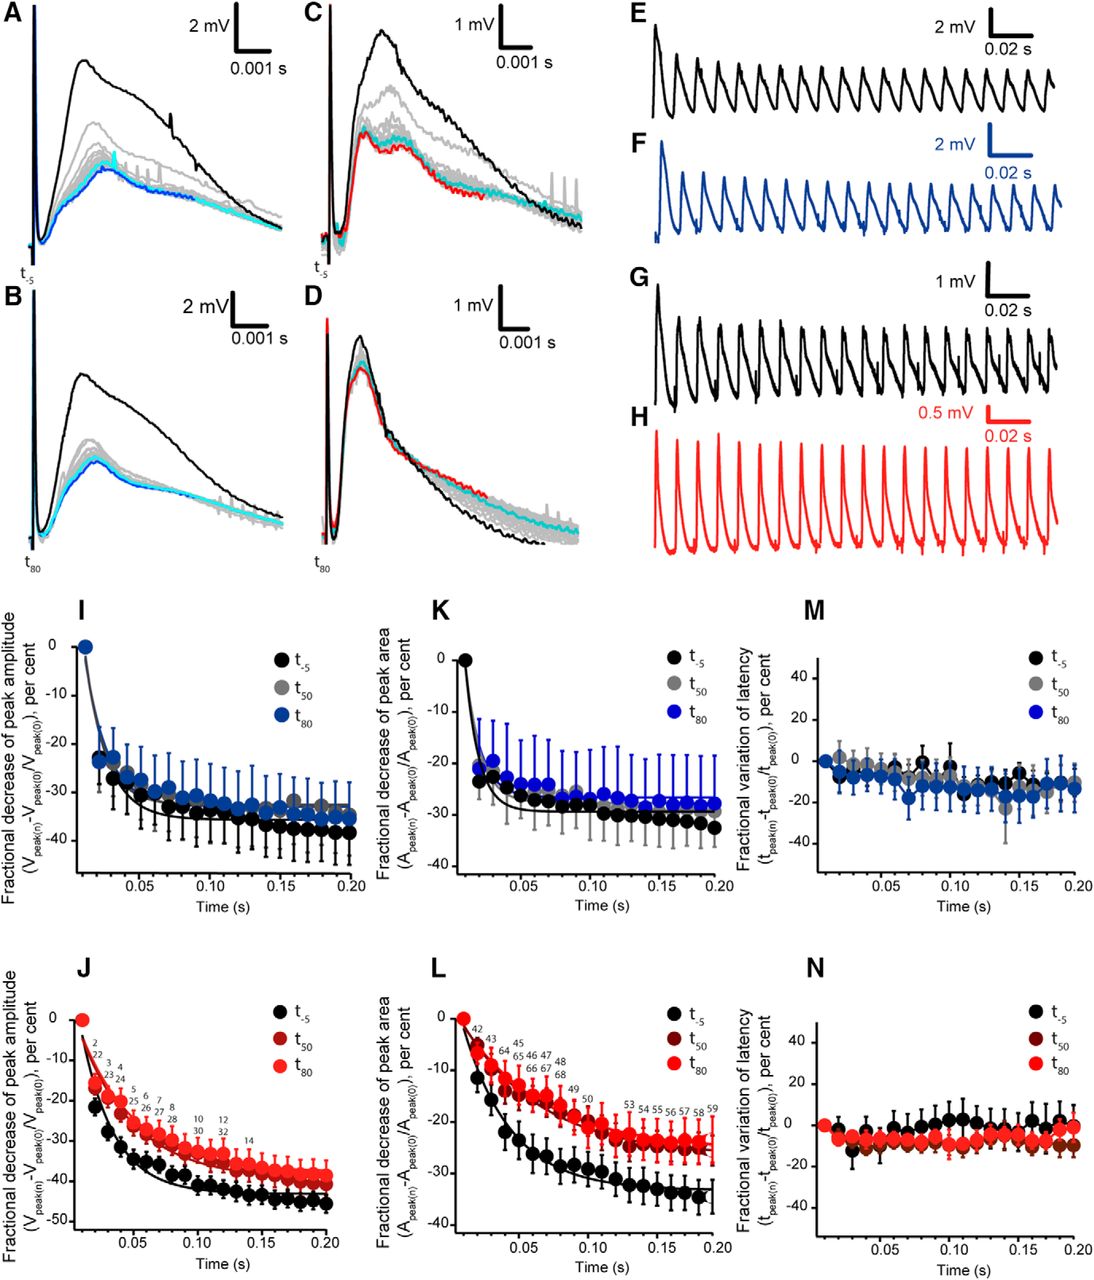
Analysis of CAPs elicited at high frequency (100 Hz). A–D, The individual CAPs activated during the 200 ms train were synchronized at the time of delivering the stimulus pulse, showing an overall decrease. Representation of the CAP at the beginning of the train (black) to intermediate stages (light blue) and at the end of the train (dark blue) in control conditions at -5 min (t-5; A) and at 80 min (t80; B); gray traces correspond to the rest of CAPs. C, D, Trains before (t-5) and after adding (t80) the ε-toxin. Red traces correspond to the last CAP recorded in the train. In some traces, small transient spikes were recorded and are related to the interference of the peristaltic pump used for perfusion. Stimulus artifact was not removed. E–H, Overall representation of the CAPs elicited by the 100 Hz stimulation in control conditions, to which only vehicle was added, at (E) t-5 and (F) t80. CAPs elicited by the 100 Hz stimulation in ε-toxin conditions at t-5 (G) and t80 (H) after the adding the ε-toxin. Stimulus artifact was eliminated in E–H. I, J, Fractional decrease of peak amplitude in control conditions and with the treatment of ε-toxin at the three different train stimulations: t-5, t50, and t80. I, Control conditions. J, ε-toxin condition. Fractional decrease of the amplitude reflects the change of the amplitude of each of the 20 CAPs with respect to the first peak recorded when starting the train. Statistical significances are indicated by a number on the significance Table 1. K, L, Fractional decrease of peak area in control conditions and with the treatment of ε-toxin at the three different train stimulations: -5, 50, and 80 min. K, Control condition. L, ε-Toxin condition. Statistical significances are indicated by a number on the significance Table 2. M, N, Fractional variation of latency in control conditions and with the treatment of ε-toxin at the three different train stimulations t-5, t50, and t80. M, Control conditions. N, ε-Toxin condition. I–N, Data are presented as mean values ± SEM; control (n = 7) and ε-toxin (n = 11).
- Figure 5.
Computer simulation on a single myelinated fiber with the dimensions of the mouse optic nerve. A, Equivalent circuit of the model corpus callosum axon, which has been adapted from existing models (Richardson et al., 2000; Devaux and Gow, 2008; Kolaric et al., 2013). The axon is divided into two regions, the node and internodal (INR). Nodal membrane potential is represented by Ex and intermodal potential by Epas. The nodal region expresses voltage-dependent conductances, as well as leak current (gax) and capacitance (Cax). The axolemma underlying the myelin also has these properties (gax and Cax), but the myelin contributes an additional resistive (gmyl) and capacitative barrier (Cmyl). The passive current across the membrane is the sum of gmyl and gax. Axon resistance (Ra) is constant throughout the model. Effect of the increasing gmyl on simulated action potentials during 100 Hz train. B, Nineteen action potentials elicited in a 2 nA pulses train stimulation of 200 ms as represented above. In black, are action potentials of control conditions, with normal conductance (2 × 10⁻⁵ S/cm2) and in red, an increase of magnitude by 10 in conductance (2 × 10⁻⁴ S/cm2). C, Representation of the fractional decrease of the peak amplitude of the 2-nA 100 Hz train stimuli at a different myelin conductance. Control conditions, 2 × 10⁻⁵ S/cm2 (black), 2.2 × 10⁻⁵ S/cm2 (gray), 2.5 × 10⁻⁵ S/cm2(purple), 3 × 10⁻⁵ S/cm2 (yellow), 4 × 10⁻⁵ S/cm2 (fuchsia), 5 × 10⁻⁵ S/cm2 (blue), and 2 × 10⁻⁴ S/cm2 (red). D, Linear relationship between the increase of conductance of a single internode and the estimated number of molecules of the ε-toxin per internode. Few tens of molecules would increase the myelin conductance with a dramatic consequence on the amplitude decay as shown in C. E, Action potential triggered by a sustained 250 ms pulse of 2 nA, as shown above, at a control condition with a conductance, 2 × 10⁻⁵ S/cm2. F, In blue, action potentials triggered at a conduction of 5 × 10⁻⁵ S/cm2, the frequency of firing is decreased. G, In red, action potentials triggered at a conduction of 2 × 10⁻⁴ S/cm2, the frequency decreases until no action potentials can be elicited. H, Plot of the calculated number of action potentials triggered versus myelin conductance. Code color as C, D. As the conductance of myelin increases, the number of action potentials elicited is decreased.
- Figure 6.
Electron microscopy of compact myelin from optic nerves. Electron microscopy images of myelin in (A) control conditions and (B) toxin conditions. Scale bar is represented in every panel. C, Magnification over myelin layers to quantify distance on major lines. Contrast and brightness were modified to enhance the dense line of the myelin. Yellow bar (20 nm) represents the line through which the gray intensity was measured. D, Graphic representation of gray intensity (black line) measured in C. A sinusoidal function was fitted to calculate the distance between peaks (red dashed line); the distance between the dense lines was estimated after applying a Fourier transform. E, The mean distance between major lines in control (blue; 30 images analyzed, n = 2 mice) and toxin (red; 30 images analyzed, n = 3 mice) conditions. No significant difference was found between the both means (p = 0.9062). Mean values ± SEM represented.


Tables
Point Data structure Type of test Power Significance t-5 vs t50 1 Normal Paired two-tailed t test 0 2 Normal Paired two-tailed t test 0.0405 * 3 Normal Paired two-tailed t test 0.0107 ** 4 Normal Paired two-tailed t test 0.0072 ** 5 Normal Paired two-tailed t test 0.0094 ** 6 Normal Paired two-tailed t test 0.0155 * 7 Normal Paired two-tailed t test 0.0304 * 8 Normal Paired two-tailed t test 0.0097 ** 9 Normal Paired two-tailed t test 0.0824 10 Normal Paired two-tailed t test 0.0103 * 11 Normal Paired two-tailed t test 0.0571 12 Normal Paired two-tailed t test 0.0209 * 13 Normal Paired two-tailed t test 0.0744 14 Normal Paired two-tailed t test 0.0279 * t-5 vs t80 21 Normal Paired two-tailed t test 0 22 Normal Paired two-tailed t test 0.0188 * 23 Normal Paired two-tailed t test 0.007 ** 24 Normal Paired two-tailed t test 0.0064 ** 25 Normal Paired two-tailed t test 0.0202 * 26 Normal Paired two-tailed t test 0.0306 * 27 Normal Paired two-tailed t test 0.0322 * 28 Normal Paired two-tailed t test 0.0284 * 29 Normal Paired two-tailed t test 0.0673 30 Normal Paired two-tailed t test 0.0418 * 31 Normal Paired two-tailed t test 0.0522 32 Normal Paired two-tailed t test 0.0457 * 33 Normal Paired two-tailed t test 0.0693 34 Normal Paired two-tailed t test 0.0551 35 Normal Paired two-tailed t test 0.0866 36 Normal Paired two-tailed t test 0.0682 37 Normal Paired two-tailed t test 0.084 38 Normal Paired two-tailed t test 0.0872 39 Normal Paired two-tailed t test 0.0927 Significance power of statistical analysis of paired two-tailed t test of the peak amplitude, comparing the first peak of the 100-Hz train stimulation to the rest 18 peaks. *p < 0.05; **p < 0.01. (N = 7 control, 11 toxin).
Point Data structure Type of test Power Significance t-5 vs t50 41 Normal Paired two-tailed t test 0 42 Normal Paired two-tailed t test 0.0123 * 43 Normal Paired two-tailed t test 0.0482 * 44 Normal Paired two-tailed t test 0.0518 45 Normal Paired two-tailed t test 0.0304 * 46 Normal Paired two-tailed t test 0.014 * 47 Normal Paired two-tailed t test 0.0142 * 48 Normal Paired two-tailed t test 0.0187 * 49 Normal Paired two-tailed t test 0.0207 * 50 Normal Paired two-tailed t test 0.0293 * 51 Normal Paired two-tailed t test 0.0921 52 Normal Paired two-tailed t test 0.1104 53 Normal Paired two-tailed t test 0.0437 * 54 Normal Paired two-tailed t test 0.0442 * 55 Normal Paired two-tailed t test 0.0275 * 56 Normal Paired two-tailed t test 0.0309 * 57 Normal Paired two-tailed t test 0.0327 * 58 Normal Paired two-tailed t test 0.0254 * 59 Normal Paired two-tailed t test 0.0304 * t-5 vs t80 61 Normal Paired two-tailed t test 0 62 Normal Paired two-tailed t test 0.055 63 Normal Paired two-tailed t test 0.0579 64 Normal Paired two-tailed t test 0.0435 * 65 Normal Paired two-tailed t test 0.0276 * 66 Normal Paired two-tailed t test 0.0223 * 67 Normal Paired two-tailed t test 0.0348 * 68 Normal Paired two-tailed t test 0.0362 * Significance power of statistical analysis of paired two-tailed t test of the peak area, comparing the first peak of the 100 Hz train stimulation to the rest 18 peaks. *p < 0.05. (N = 7 control, 11 toxin).
In this issue


