

Article Figures & Data
- Figure 1.
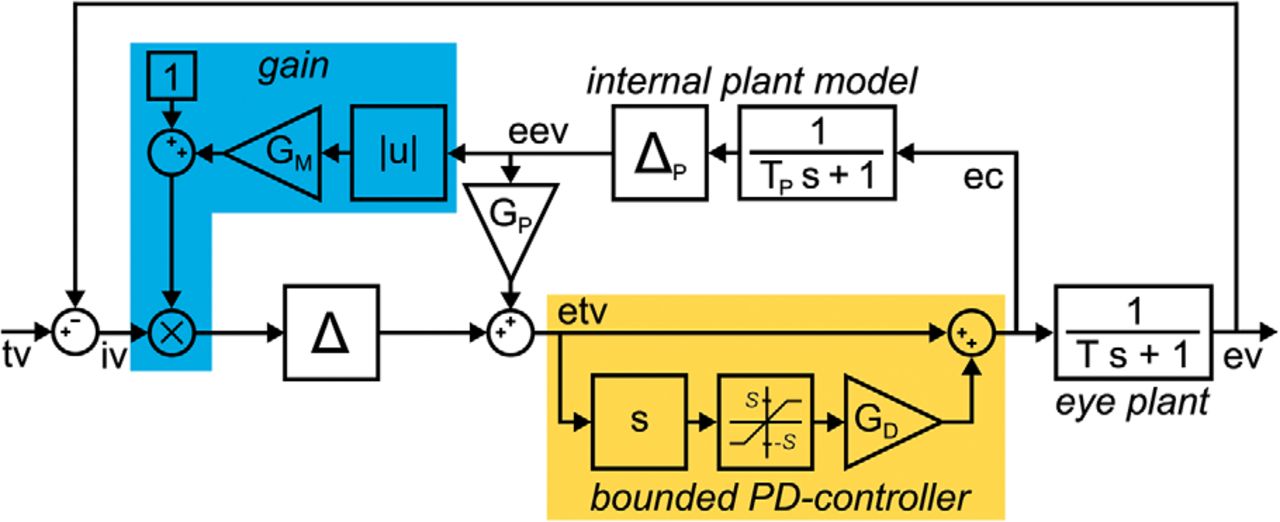
A, Smooth pursuit control circuit adapted from the study by Nuding et al. (2008). The model is based on the standard “internal feedback” model by Robinson et al. (1986), extended by a basic gain control mechanism (blue). Hereby, the retinal image velocity signal is modulated by an internal estimate of gaze velocity (Carey and Lisberger, 2004; Bayer et al., 2008; Lee et al., 2013). The retinal image velocity (iv) is the difference between target velocity (tv) and eye velocity (ev). The eye plant was modeled by a first-order low pass with time constant T = 200 ms. An efference copy (ec) of the motor command is projected to an internal model of the eye plant (with a time constant TP = T), yielding an estimate of the eye velocity signal (eev). This signal is used to transform iv into an estimate of target velocity (etv). For a steady-state pursuit gain of ∼0.9, GP was set 0.9. The gain control mechanism increases pursuit gain for higher velocities by multiplying iv with the factor
 . The delay elements Δ and ΔP represent the processing latencies and were set to 150 ms. B, Perturbation responses increase with eye velocity. Single-cycle high-frequency perturbations were imposed on target velocity (gray) during fixation, as well as pursuit with constant velocities of 10 and 20°/s. Green traces show the model responses with GM = 0.05 for the three different conditions.
 - Figure 2.
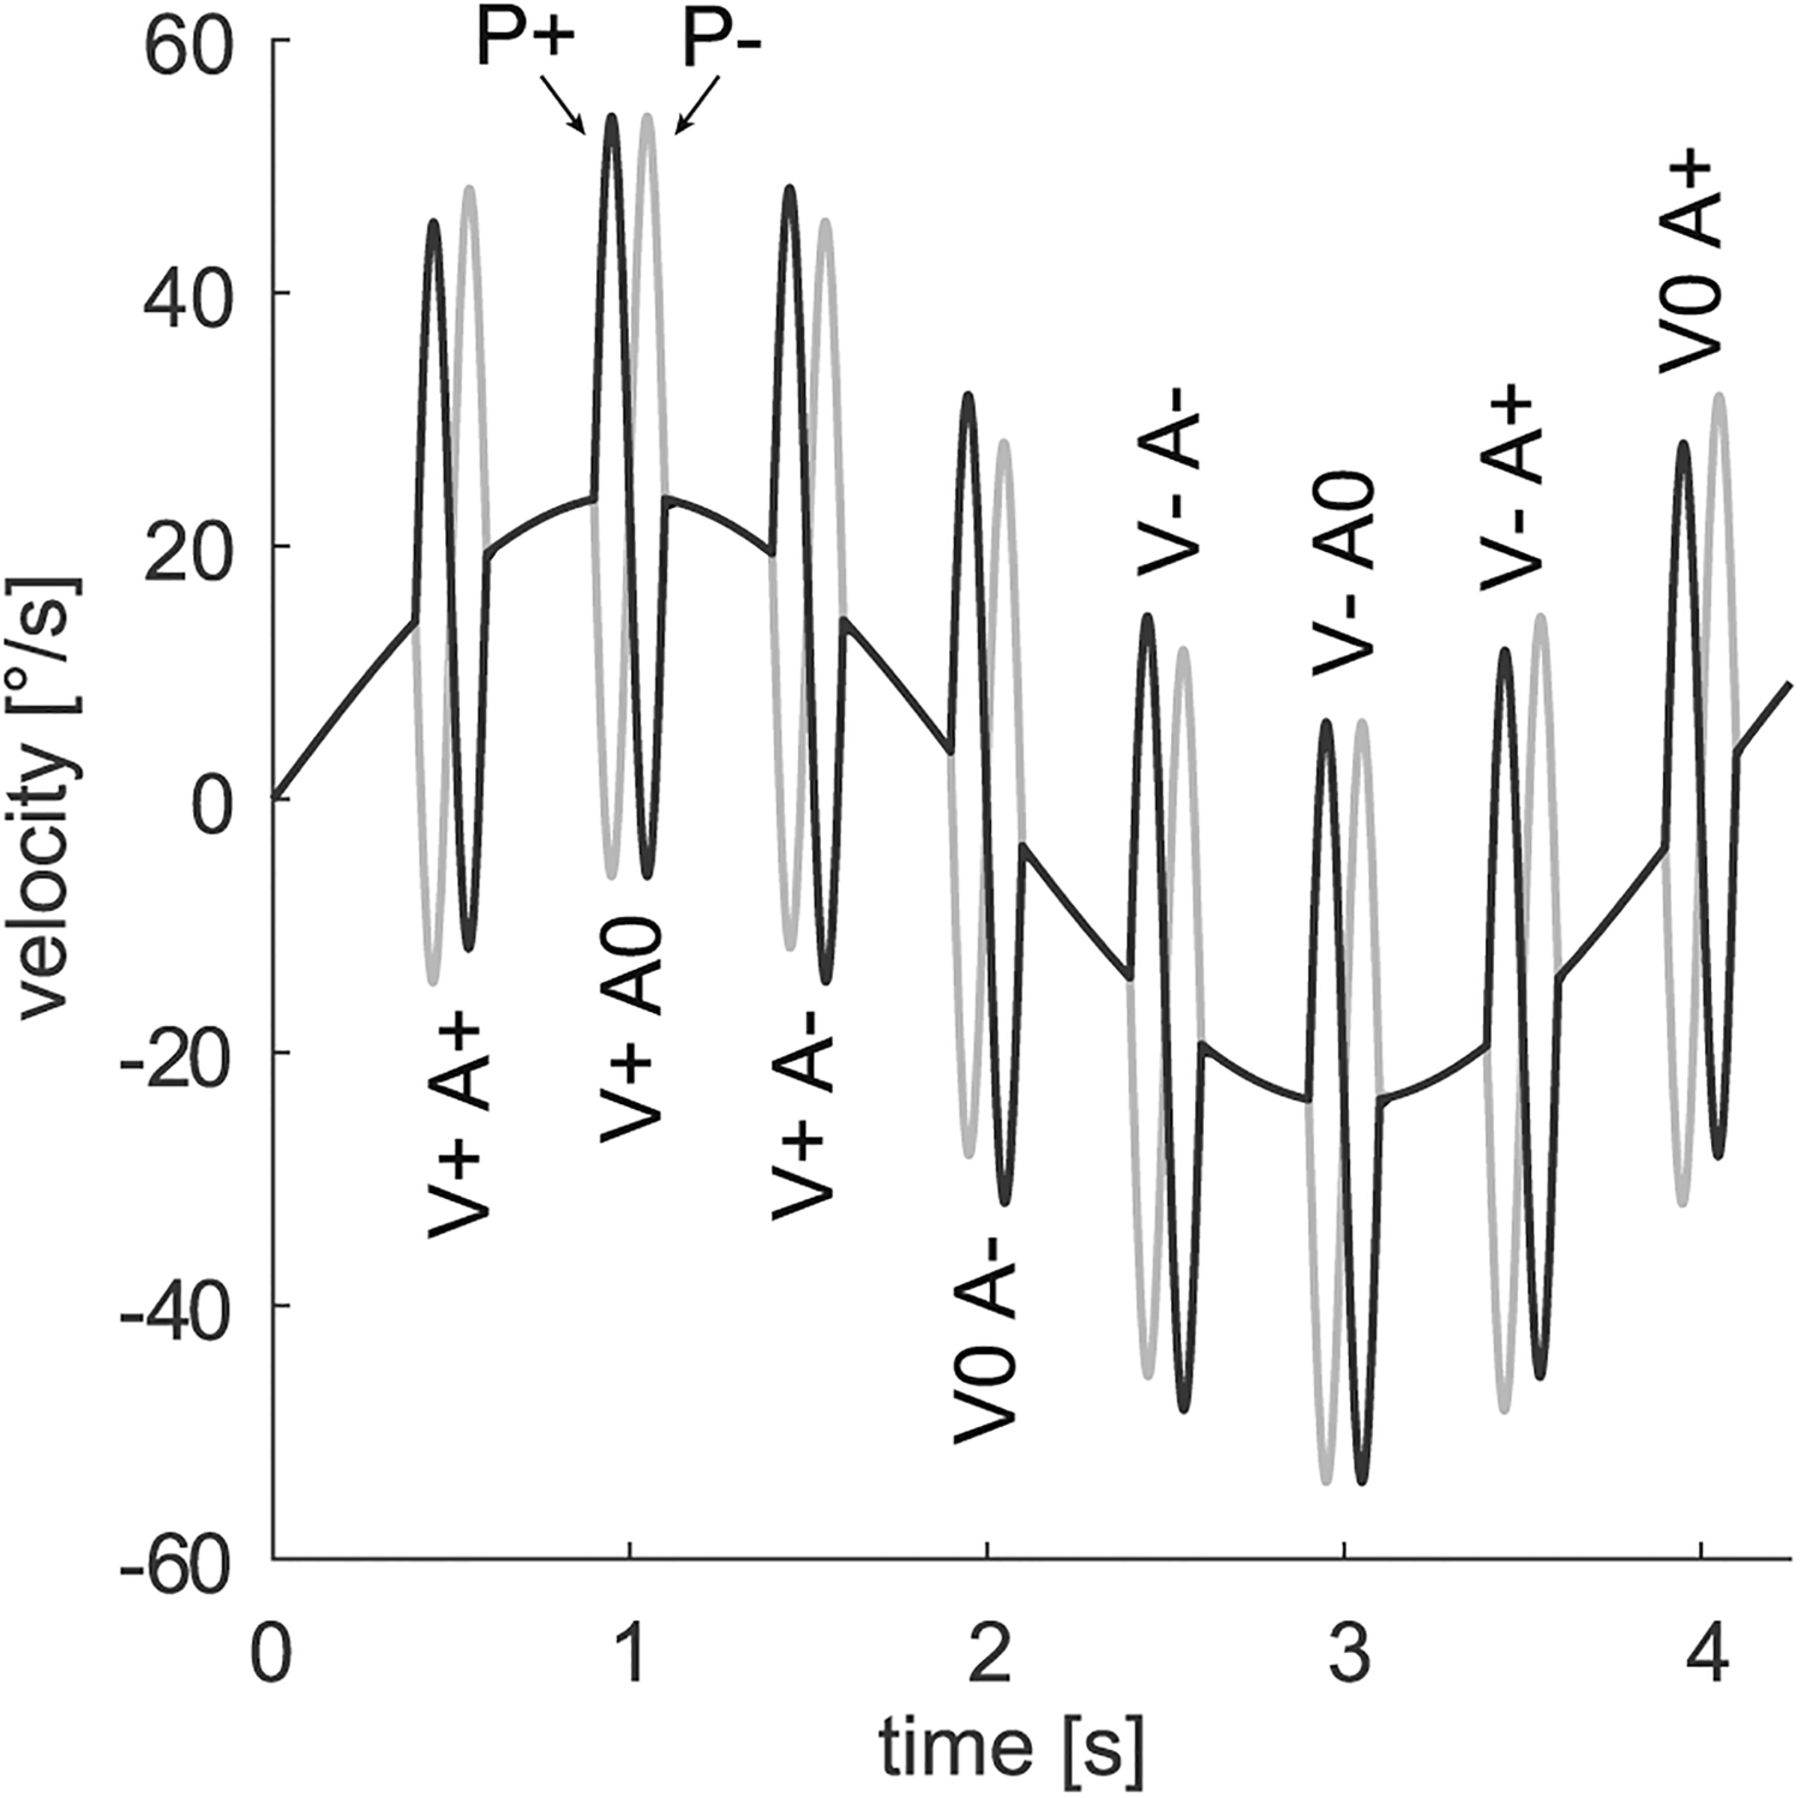
Possible forms of perturbation occurrence during sinusoidal pursuit. Initial perturbation acceleration was either to the right (P+) or to the left (P−). Perturbations occurred randomly at one of eight carrier phases. These were classified by the direction of carrier velocity V and the direction of carrier acceleration A, which was either rightward (+), leftward (−), or indefinable (0).
- Figure 3.
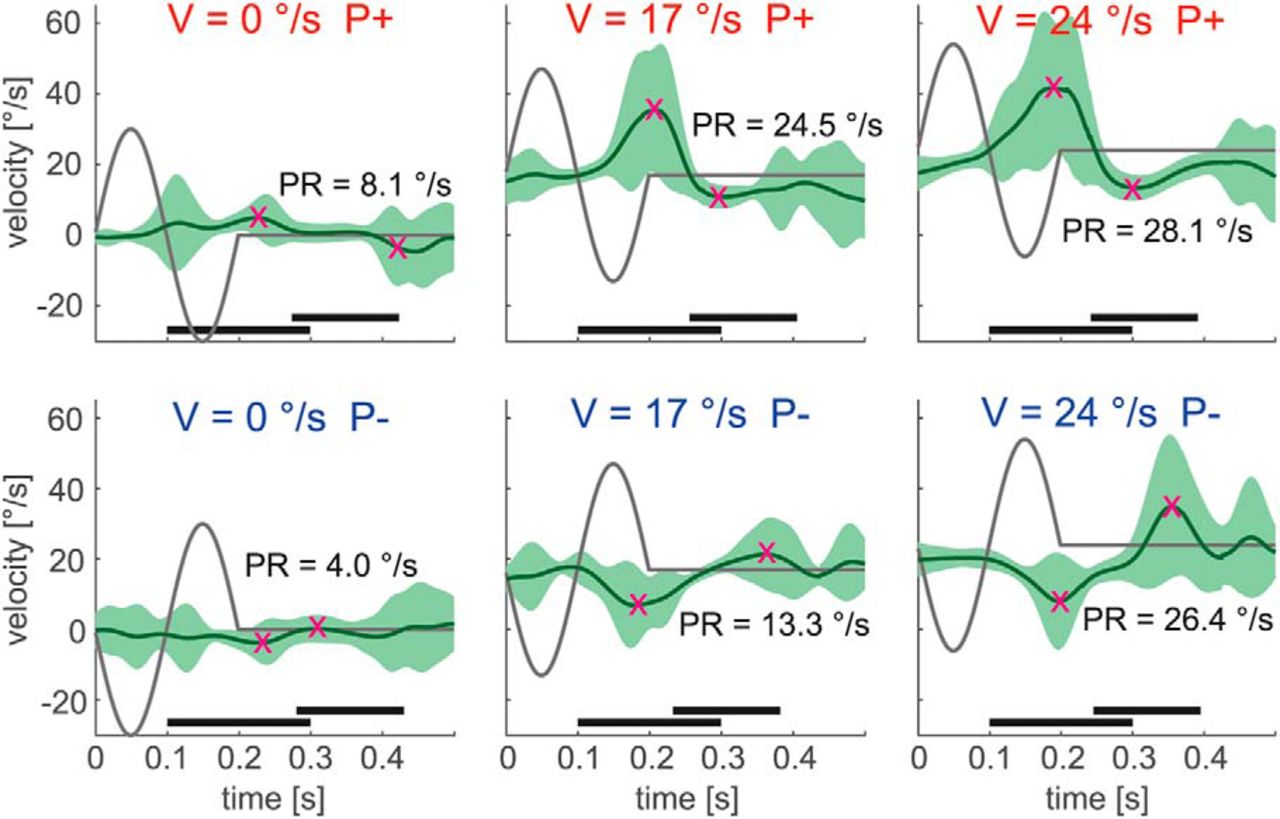
Responses to high-frequency perturbations in an example subject during fixation (V = 0°/s) and step-ramp smooth pursuit (V = 17 and 24°/s). Initial perturbation acceleration was either to the right (P+) or to the left (P−). Green traces show the average eye velocity, with the SD marked light green. Dark gray traces show target velocity. Magenta crosses mark peaks and troughs of the PR. For P+ perturbations, the maximum eye velocity was detected in the time interval of 100–300 ms (bottom black bar) after perturbation onset (t = 0 s). The minimum was detected in the time interval of 50–200 ms (top black bar) after the maximum. In the P− case, time intervals for maximum and minimum were transposed accordingly.
- Figure 4.
Responses to high-frequency perturbations in an example subject during sinusoidal pursuit. All 16 conditions, as described in Figure 2, are illustrated. Green traces show the averaged eye velocity, with the SD marked light. Dark gray traces show target velocity. Magenta crosses mark peaks and troughs of the PR. For PR determination the carrier was subtracted. The labels for ipsidirectional perturbations are colored red, the labels for contradirectional perturbations are colored blue.
- Figure 5.
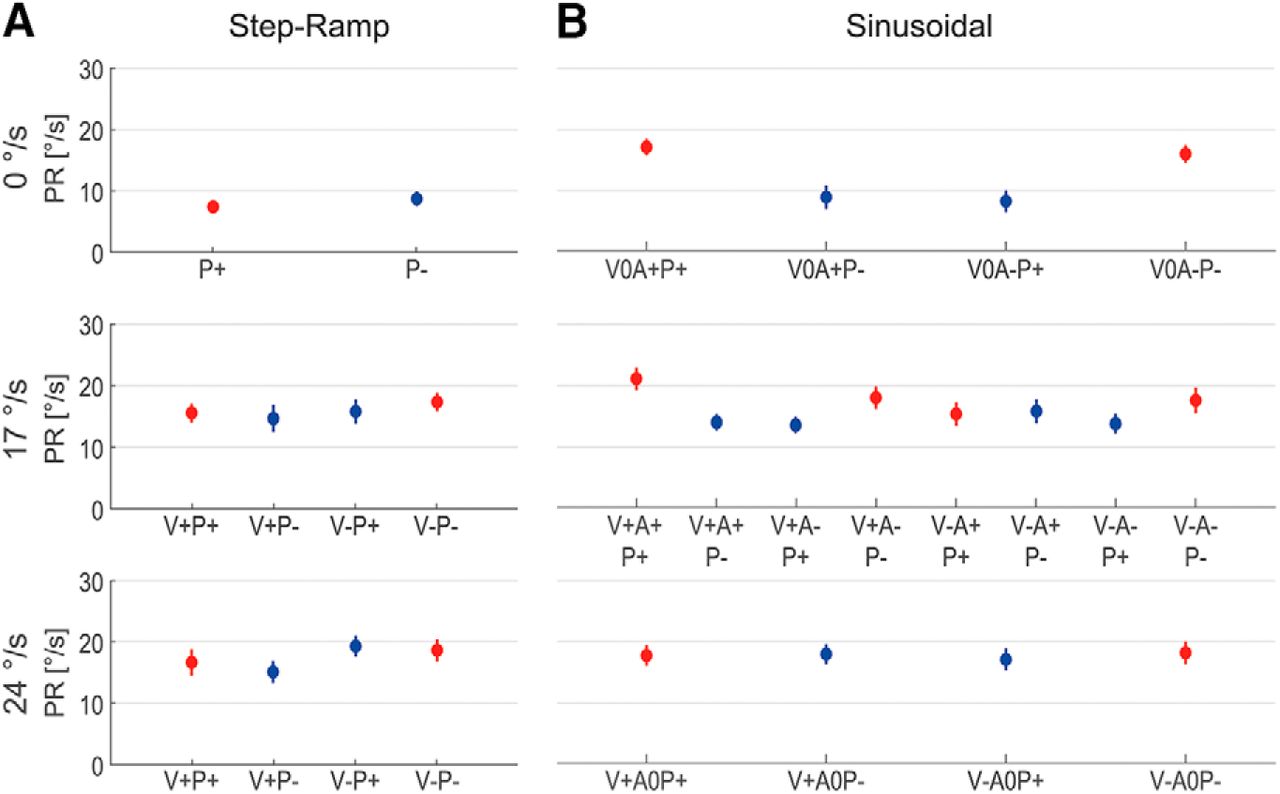
A, B, PR during step-ramp (A) and sinusoidal pursuit (B). Conditions are labeled according to the initial perturbation direction (P+, rightward; P−, leftward) and the directions of carrier velocity (V+, rightward; V−, leftward) and acceleration (A+, rightward; A−, leftward). Sinusoidal 0 and 24°/s conditions correspond to the turning points and the center points of the carrier movement, respectively. Peak-first (A) and ipsidirectional (B) perturbations are colored red, and peak-last and contradirectional perturbations are colored blue. Vertical lines mark SEs. Note the difference between ipsidirectional and contradirectional PRs in the sinusoidal 0 and 17°/s conditions.
- Figure 6.
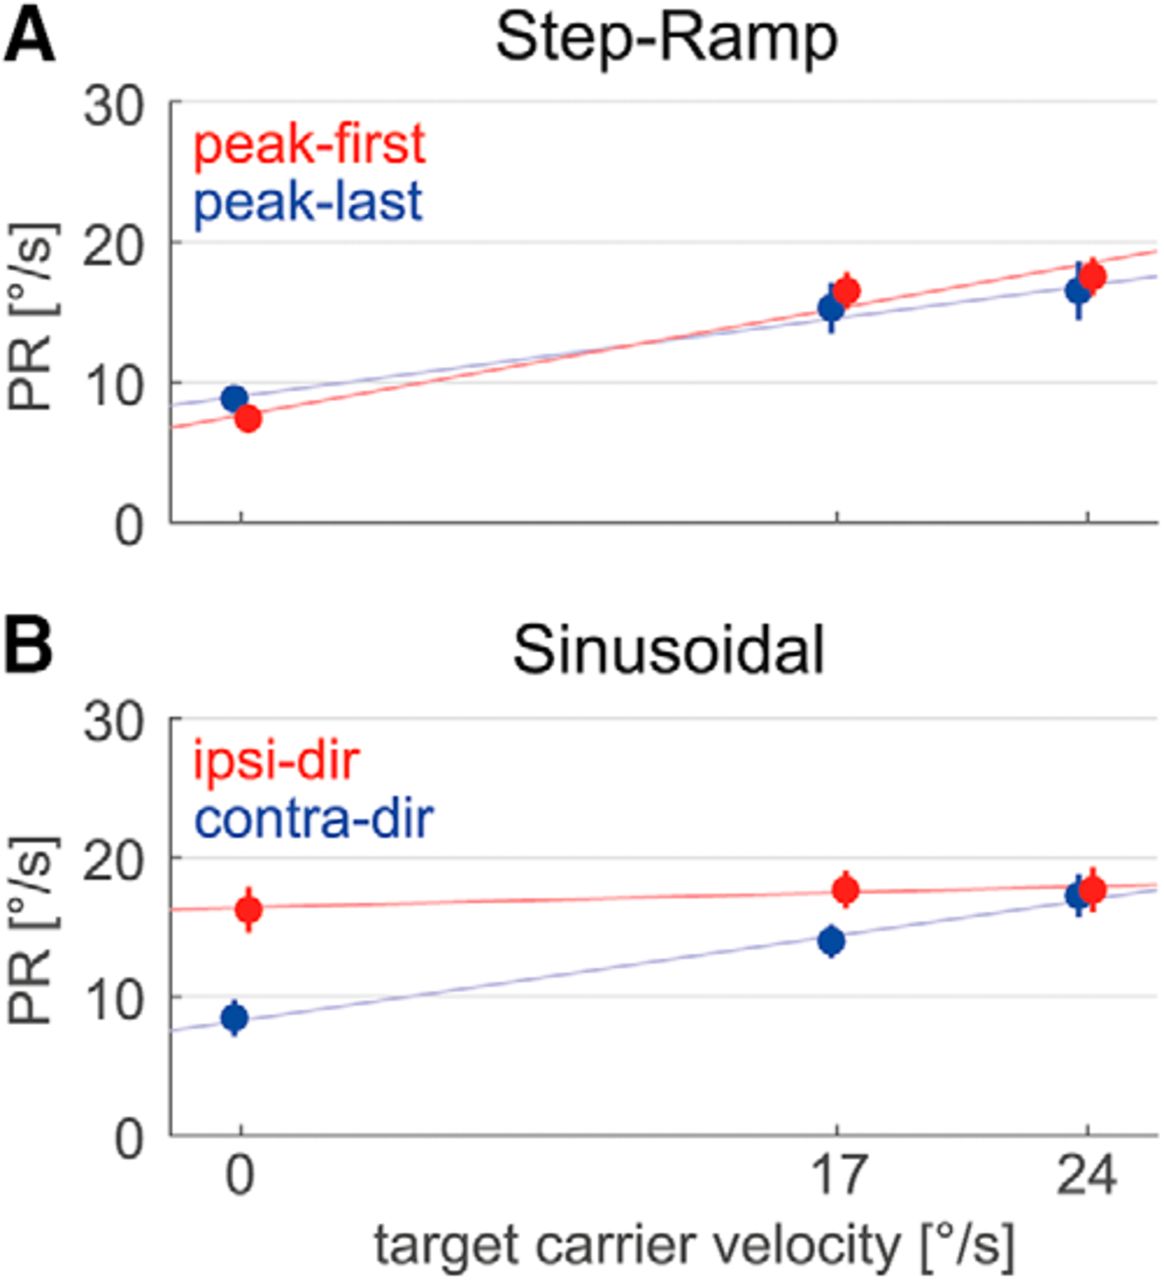
Dependence of mean PRs on the three different carrier velocities and the perturbation phase. A, B, In step-ramp (A), perturbations were either peak-first (red) or peak-last (blue). During sinusoidal pursuit (B), perturbations were classified as ipsidirectional (red) or as contradirectional (blue). Thin colored lines illustrate the results from linear regression analysis. Vertical lines mark SEs.
- Figure 7.
A bounded PD-controller model of smooth pursuit. This control circuit is an extension of the basic gain control model from Figure 1. The block labeled “s” represents the derivative element of the bounded PD-controller. The derivative of the estimated target velocity signal etv is bounded by a saturating element (with thresholds −S and S) and amplified by GD. By summation with etv the motor command is generated.
- Figure 8.
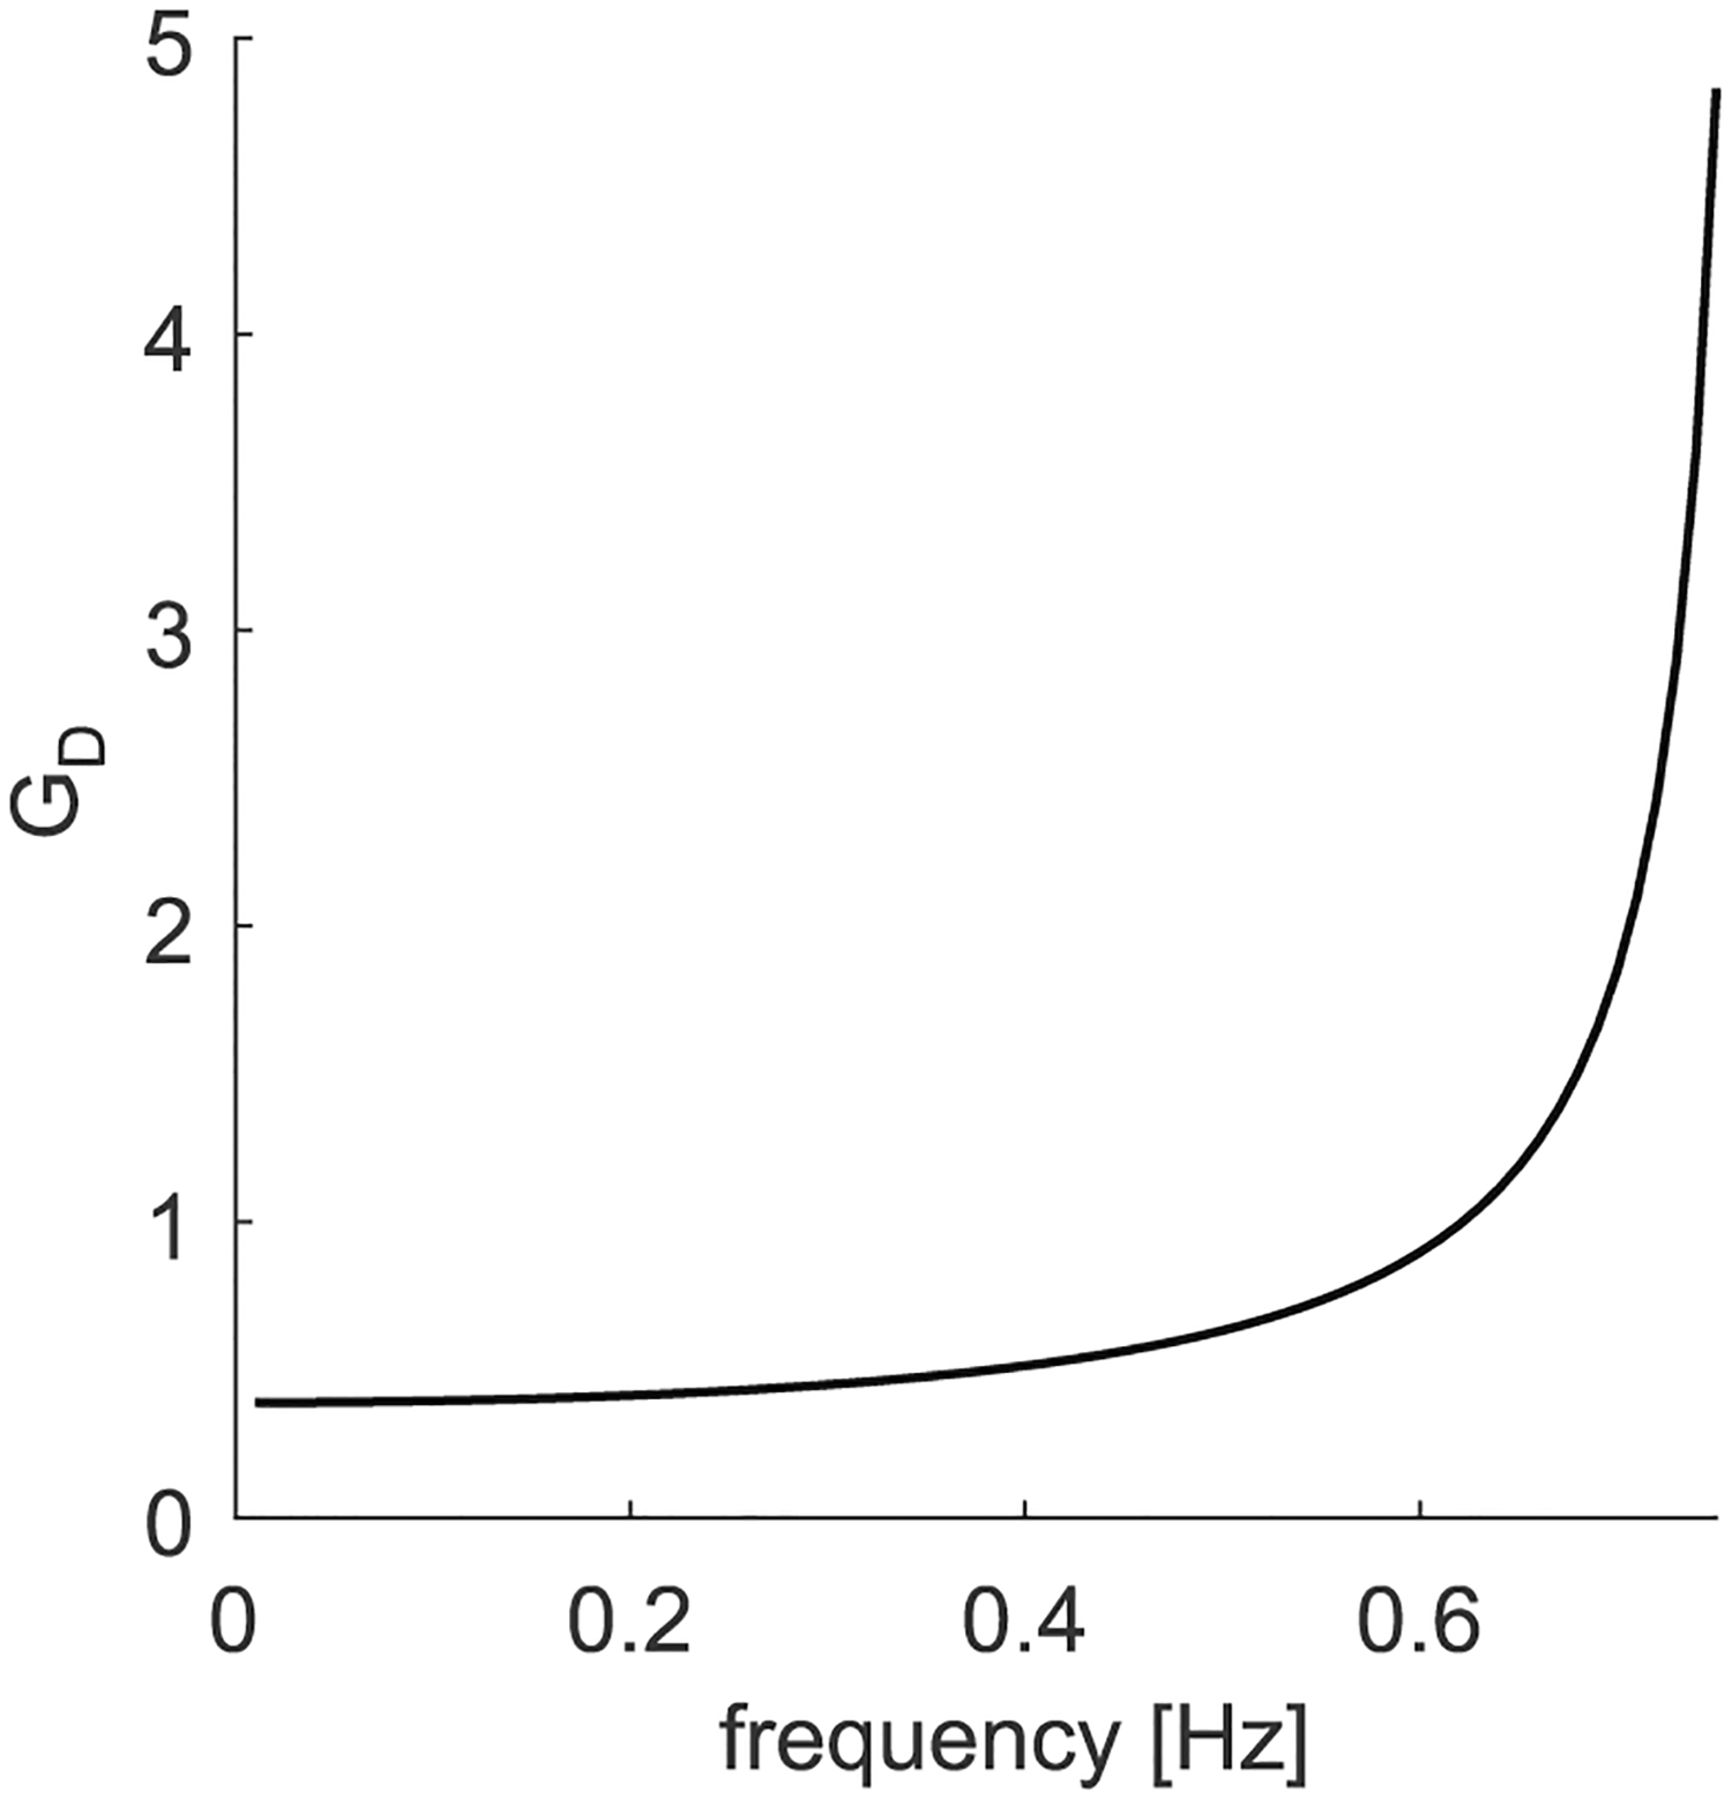
The gain of the derivative signal GD as a function of target carrier frequency.
- Figure 9.
PRs for the bounded PD-controller model. A, In step-ramp, perturbations were either peak-first (red) or peak-last (blue). B, During sinusoidal pursuit, perturbations were classified as ipsidirectional (red) or contradirectional (blue). Regression lines from Figure 6 are shown for comparison.
- Figure 10.
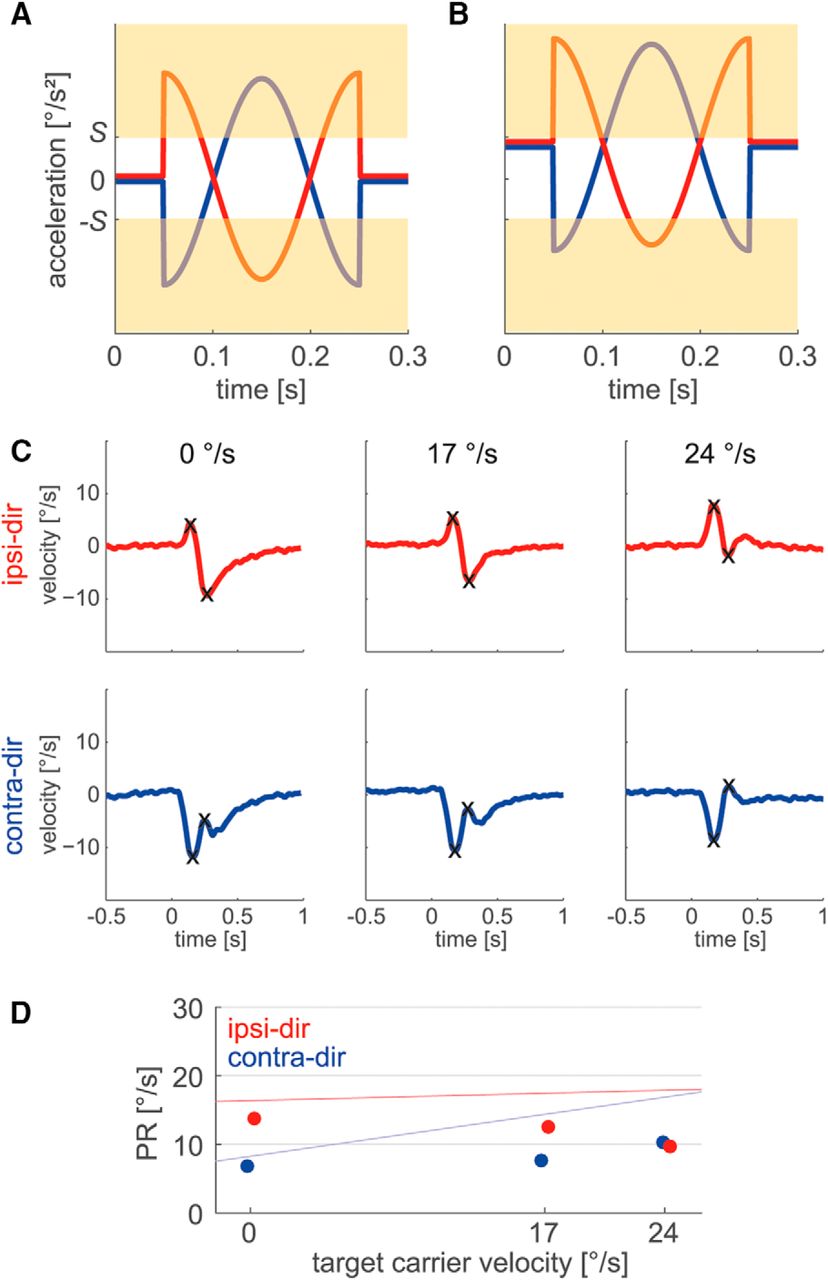
A, B, Derivative signal during perturbation occurrence. Signal components exceeding thresholds S or −S are bounded by the saturating element (as indicated by the beige area). A, B, For a carrier acceleration of 0°/s2 (A), ipsi-dir (red) and contra-dir (blue) perturbations are affected similarly. For maximal carrier acceleration (B), ipsi-dir and contra-dir perturbations are affected asymmetrically by the signal saturation. C, Responses to ipsi-dir (red) and contra-dir (blue) perturbations of the bounded PD-controller model with GM = 0 for three different carrier velocities during sinusoidal pursuit. For better illustration, the sinusoidal carrier has been subtracted. At 17°/s condition V+A+ is shown (Fig. 2). Black crosses mark peaks and troughs of the PR. D, PRs for the bounded PD-controller model with GM = 0 during sinusoidal pursuit. Regression lines from Figure 6 are shown for comparison.


- Table 1.
Parameter values of the bounded PD-controller model after fitting the data from both the sinusoidal and the step-ramp conditions, the sinusoidal condition only, and the step-ramp condition only
SIN + STEP SIN only STEP only Δ, ΔP 140 ms T, TP 279 ms 245 (±59) ms 285 (±51) ms GP 0.9 GM 0.040 0.029 (±0.018) 0.042 (±0.014) GD 0.467 0.424 0.475 GS 1.46 1.62 (±0.88) 1.19 (±0.49) Note that Δ, ΔP, and GP were not fitted, as well as GD (see Results). The values in parentheses denote the 95% confidence interval. SIN, Sinusoidal; STEP, step-ramp.
- Movie 1.
Basic demonstration of the sinusoidal pursuit paradigm. The lower graph shows an example target velocity trace where high-frequency perturbations (P+ and P−) were imposed at four different carrier phases on the sinusoidal carrier. The green dot marks the current velocity of the red target spot in the top graph.
- Movie 2.
Basic demonstration of the step-ramp paradigm. The bottom graph shows a target velocity trace for rightward pursuit with an imposed P+ perturbation. The green dot marks the current velocity of the red target spot in the top graph.
In this issue


