

Article Figures & Data
Figures
- Figure 1.
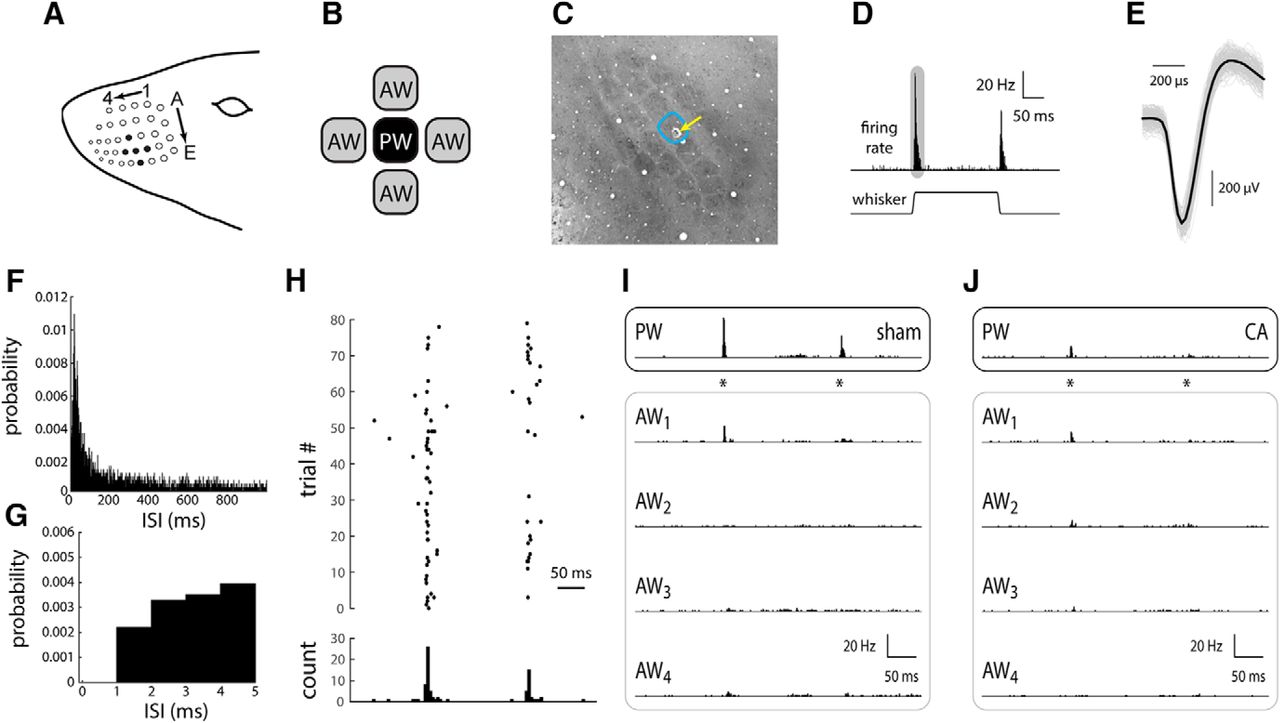
Response of L4 single RSUs in whisker/barrel cortex of sham and CA rats. A, The rat whisker pad consists of an ordered array of order whiskers; as an example, filled black circles indicate whisker D3 as the PW (see Materials and Methods), whiskers D2 and D4 as AWs in the same row, and whiskers C3 and E3 as AWs in the same column. B, To characterize spatial receptive field properties (relative responses across the whisker array), we recorded from neurons while stimulating the PW and two to four AWs, individually, in either the same column or same row as the PW. C, An example tangential section of the L4 barrel field stained for CO (see Materials and Methods), illustrating an electrolytic lesion to confirm the location of the primary whisker. D, In response to a 1-mm ramp-and-hold whisker deflection (see Materials and Methods), an L4 RSU responds with a robust, transient increase in firing rate. After the whisker deflection offset, the unit responds with a similar, albeit smaller, transient increase in firing rate. The shaded area schematically represents the time window for computing the ON response. E, A representative wave form of a single-unit RS neuron recording. All recorded waveforms are shown in gray. The average wave form is shown in black. F, ISI histogram for all recorded units in sham rats. The ISI histogram in CA rats is essentially identical (not shown). Bin width, 1 ms. G, The first 5 ms of the ISI histogram in F. Note absence of recorded spikes in the absolute refractory period of 1 ms. H, The set of spike time responses of an example sham neuron, presented as a spike time raster plot, illustrates the sparseness of spontaneous activity and relative robustness of whisker evoked responses. I, The peristimulus time histogram (PSTH) of a representative RSU from a sham rat in response to PW deflection (asterisks indicate onset and offset times) indicates a robust, temporally precise response (top). The responses to the four AWs are smaller in amplitude, and in at least one case (AW2), there is no appreciable response. J, An L4 RSU from a CA rat displays a small PW-evoked response similar in magnitude to those evoked by some of the AWs (AW1 and AW2).
- Figure 2.
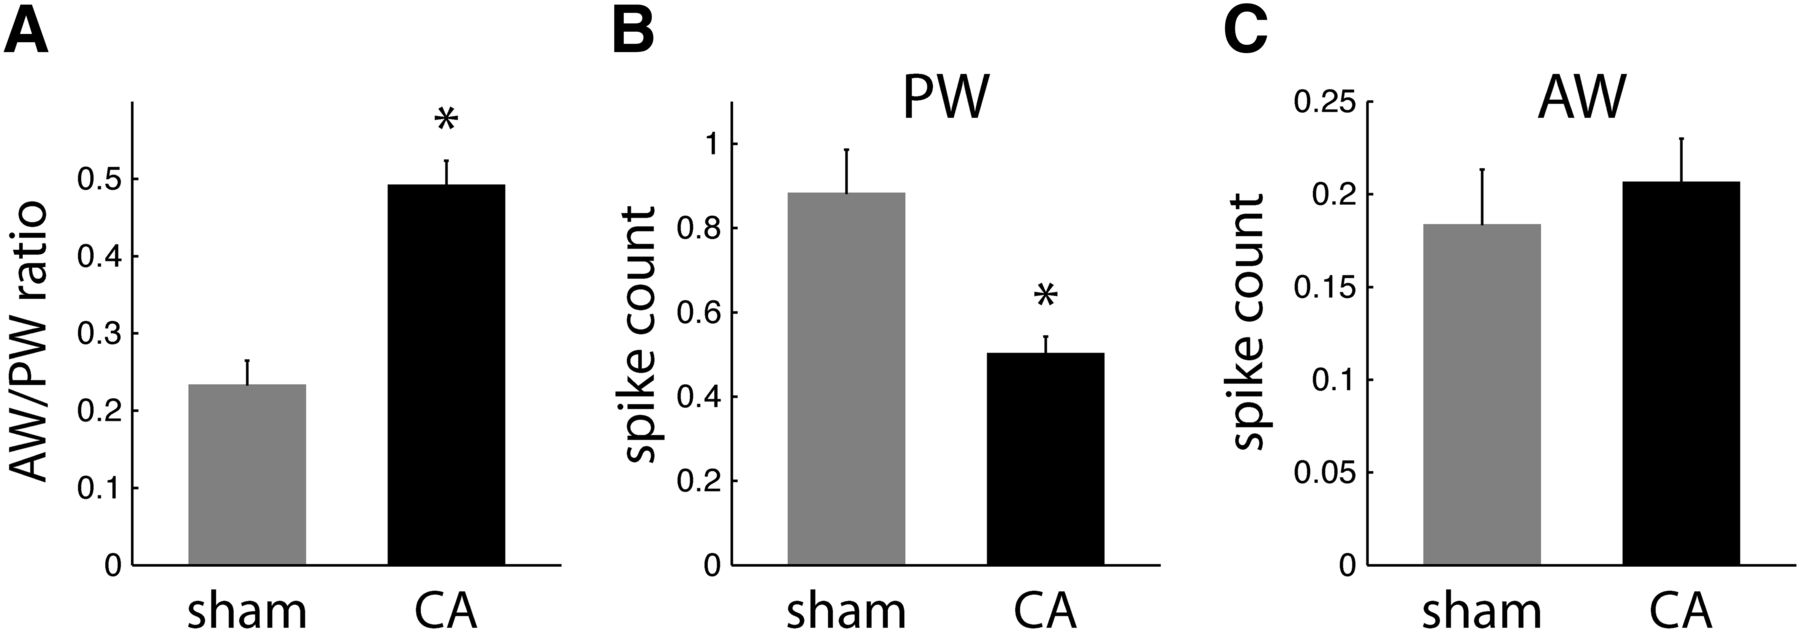
Receptive field properties of regular spike neurons in L4. A, AW/PW response ratios are larger in CA neurons (0.49 ± 0.03; n = 57) than in sham neurons (0.23 ± 0.03; n = 34; WRST, p = 0.0002). B, Mean spike counts (observed in a 25-ms window after whisker deflection) in response to PW deflections are larger for sham neurons (0.89 ± 0.11) than for CA neurons (0.50 ± 0.04; WRST, p = 0.0002). C, Sham and CA neurons have similar AW-evoked spike count responses (sham, 0.18 ± 0.03; CA, 0.21 ± 0.02; WRST, p = 0.6846).
- Figure 3.
Barrel and cortical laminar cytoarchitecture in sham and CA rats. A, CO histology reveals a well-ordered somatotopic map of the whisker array in L4 primary somatosensory cortex in sham rats. B, No apparent gross abnormalities were observed in the barrel cytoarchitecture in CA animals. C, D, Normal gross brain morphology in CA rats (D) compared with sham rats (C). Nissl stain. Scale bar, 1 mm. E, F, Preserved cortical laminar structure in CA rats (F) compared with sham rats (E). Images enlarged from D and C, respectively. Scale bar, 0.5 mm. Notice neuronal loss in the CA1 region of the hippocampus.
- Figure 4.
Subthreshold membrane and spiking properties of sham and CA model neurons. A, When spiking threshold is removed, the mean voltage of the sham model (gray) increases with increases in input firing rate. The mean voltage for the CA model (black) starts at higher levels but increases more slowly with increasing input rate. The reduced gain of membrane voltage arises from a higher level of balanced background excitatory and inhibitory fluctuating conductances. The higher conductance shunts a higher proportion of the feedforward inputs. B, Consistent with increased shunting observed for the mean depolarization, the integration of single synaptic inputs is smaller for the CA model (black) than for the sham model (gray). C, Sham (left) and CA (right) models fire at comparable rates when driven with input rates corresponding to spontaneous levels (top row). Similarly, input firing rates corresponding to AW-evoked thalamic inputs result in comparable output rates in both models (middle row). However, a high level of input firing, corresponding to PW-evoked thalamic inputs (bottom row), effectively drives the sham model (left) but fails to drive the CA model to high levels (right).
- Figure 5.
Input–output relations and AW/PW responses of L4 sham and CA model neurons. Static F-I curves for the sham model (gray) and CA model (black) neurons are calculated as a function of the firing rate of the feedforward input pathway. The lower traces show the range of instantaneous firing rates spanned by the simulated PW (solid line) and AW (dashed line) feedforward inputs in the dynamic models. At the level of spontaneous input firing rates, the output F-I curves have similar values for both sham and CA models. For peak AW input firing rates, the F-I curves for sham and CA models also have similar stationary output firing rates; the sham AW response is slightly higher than the CA AW response. In contrast, the F-I curve for the sham model is much higher at the level of peak PW input rates than the F-I curve for the CA model.
- Figure 6.
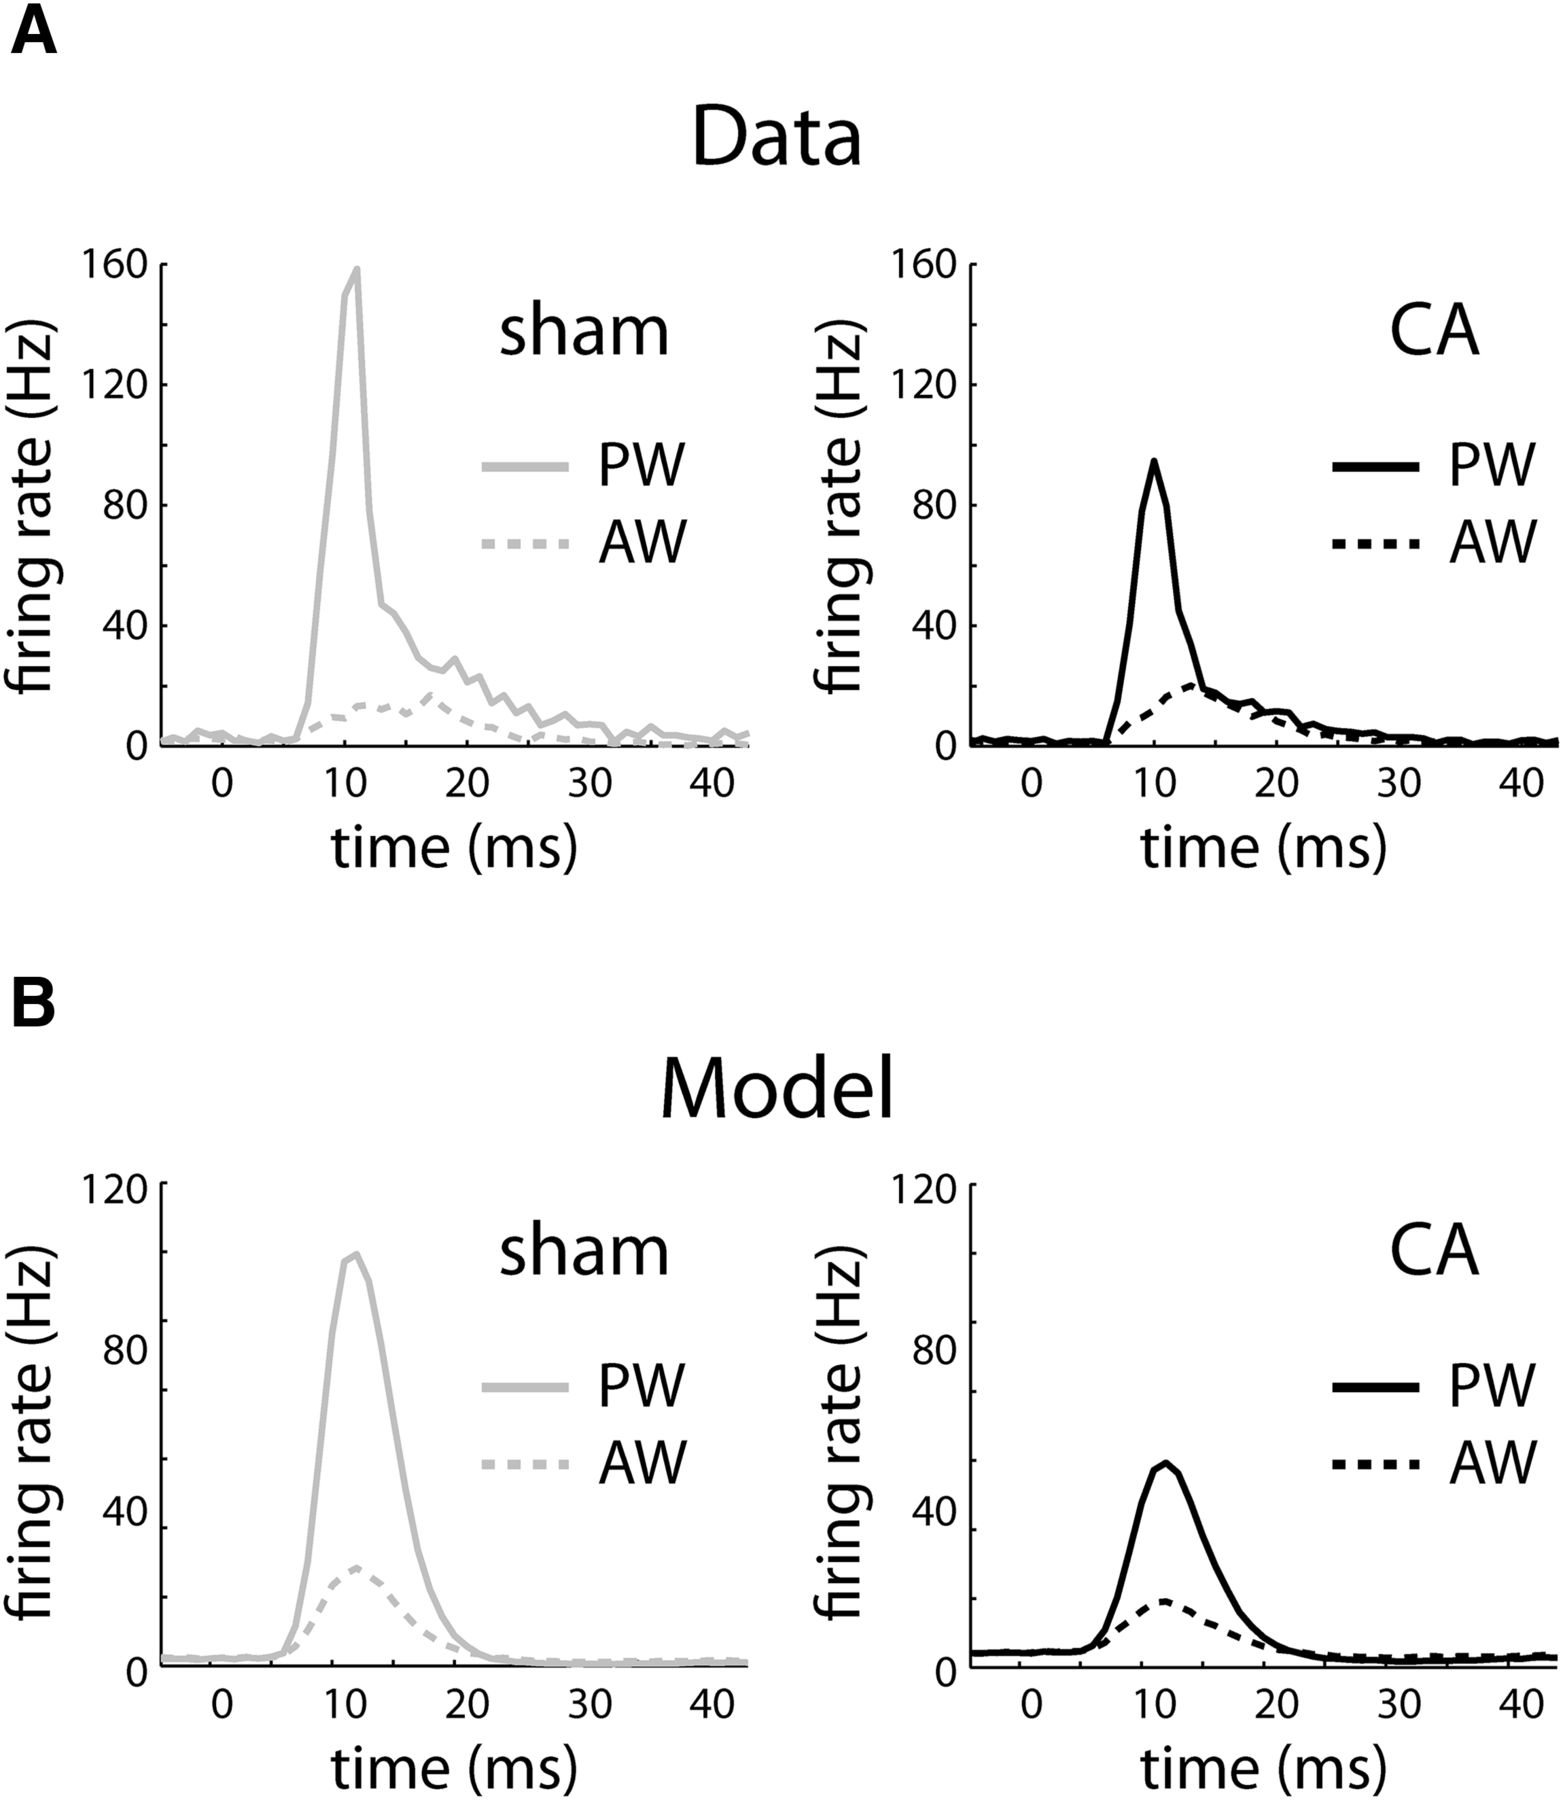
Peristimulus time histograms (PSTHs) of real and model neurons in response to PW and AW whisker deflections. A, Average PSTH of L4 neurons from sham rats in response to a whisker deflection beginning at 0 ms. The PW PSTH rapidly increases to high instantaneous firing rates and then relaxes more slowly to spontaneous rates (solid gray), whereas the AW PSTH peaks at smaller values (dashed gray). In contrast, the average PW PSTH peaks at a smaller rate (solid black), relative to sham neurons, whereas the AW PSTH (dashed black) peaks at similar values to the sham neurons. PSTHs are calculated using 1-ms bins. Instantaneous firing rates are calculated by dividing the observed counts by 1 ms. B, Sham and CA model neurons reproduce the relative PW and AW PSTH responses. The sham PW PSTH (solid gray) peaks at a higher instantaneous firing rate relative to the CA model (solid black), whereas the sham (dashed gray) and CA (dashed black) AW PSTHs peak at similar values.
- Figure 7.
Pairwise correlation structure in sham and CA L4 RSUs. A, The average joint peristimulus time histogram (jPSTH) of pairs of L4 excitatory neurons reveals a robust coactivation in response to whisker deflection in sham neurons (left). CA neuron coincident firing is smaller, as revealed by a lower-magnitude jPSTH (right). Comparing the projections of the jPSTHs along the diagonal gives the temporal profile of the cross-correlation at lag zero. B, Shuffle-corrected jPSTHs (see Materials and Methods) reveal higher levels of coincident firing in CA versus sham RSUs. C, Normalizing the cross-correlation from the shuffle-corrected jPSTHs by the peak value of the raw jPSTHs (see Materials and Methods) reveals a larger relative correlation for L4 RSU in CA rats.
- Figure 8.
Pairwise correlation structure in sham and CA model L4 RSUs. A, The average jPSTH of pairs of L4 model neurons reveals robust coactivation in response to whisker deflection in sham neurons (left). CA neuron coincident firing is smaller in magnitude, as revealed by a lower-magnitude jPSTH (right). Comparing the projections of the jPSTHs along the diagonal gives the temporal profile of the cross-correlation at lag zero. B, Subtracting the shuffle-corrected jPSTHs (see Materials and Methods) reveals more similar sham and CA jPSTH structure. C, The normalized cross-correlation reveals a larger relative correlation for CA model neurons that is qualitatively consistent with the experimental data in Fig. 7.
- Figure 9.
Alternate mechanisms of gain control in CA model neurons. The original sham and CA model from Fig. 5 are shown in solid gray and black curves. The dashed black line shows increased gain of the F-I curve when the maximum amplitude of a unitary background input, instead of the net background conductance event rate as in the original CA model, is increased. The overall firing rate, however, is also increased, which is inconsistent with experimental data. Decreasing the mean bias current slightly shifts the F-I curve (gray dashes) downward to match the data and the original CA model.


Tables
Compared values Data structure Type of test p Value Cohen’s d AW/PW ratio Not normal Wilcoxon rank sum <0.001 0.73 PW ON response Not normal Wilcoxon rank sum <0.002 0.87 AW ON response Not normal Wilcoxon rank sum 0.6846 0.12 Spontaneous firing rate Not normal Wilcoxon rank sum 0.08 0.27 Motor cortex thickness Normal Student’s t test 0.67 0.29 Barrel cortex thickness Normal Student’s t test 0.80 0.33
In this issue


