

Article Figures & Data
Figures
- Figure 1.
Density of Rbp4 ACs and RGCs varies across the retina. A, Photographic montages of a representative retinal wholemount from a Rbp4-Cre;Ai14 mouse showing tdTomato labeling in Cre-expressing cell bodies in the GCL (black dots). Fluorescence image has been inverted and binarized for clarity. D, dorsal; N, nasal; V, ventral; T, temporal. B, Magnified view of retinal region marked by black square in A. tdTomato fluorescence is pseudocolored magenta; focal plane is in the ganglion-cell layer. C, Density of tdTomato-positive cells in the GCL varies topographically and is lowest in the dorsal-nasal retina. Values for each quadrant are mean densities (cells/mm2) derived from counts in four fields, each 256 × 256 μm. D–F, tdTomato-labeled cells of the GCL (D) include RGCs (white circles) identifiable by their RBPMS-immunolabeling (E) and displaced ACs (yellow arrows), which are RBPMS immunonegative. G, Topographic variation in the percentage of tdTomato-positive cells that are RGCs.
- Figure 2.
Morphology of Rbp4-Cre-positive cells of the inner retina. A–C, Rbp4-Cre-positive cell types of the GCL. All images are maximum intensity projections showing the arbors as seen en face. To highlight the structure of the injected cell, images have been masked to hide extraneous fluorescence and pseudocolored to distinguish between processes in the ON sublayer of the IPL (green) from those in the OFF sublayer (purple). All cells were filled by intracellular dye injection after targeted recording of a tdTomato-positive RGC or AC in the Rbp4-Cre-tdTomato mouse. A, Wide-field Rbp4-Cre-labeled displaced AC (RAC), shown to scale with the two RGC types, the RDS-cell and R-cell. B, R-cell. C, RDS-cell. Arrowheads in B, C indicate axons. All scale bars, 50 μm. D, Schematic diagrams illustrating stratification of Rbp4-Cre-labeled ACs (left) and RGCs (right) relative to ipRGCs and starburst ACs (ON and OFF ChAT bands). Polyaxonal displaced ACs (RACs, cyan) restrict their processes to the inner ipRGC plexus (lower green band). Bistratified ACs (purple), which have conventionally placed somas in the INL, stratify within both the outer ipRGC plexus (upper green band; the accessory ON sublayer, locus of ectopic synapses from ON cone BCs) and in the inner ipRGC plexus. R-cells (red), the most abundant Rbp4-Cre-labeled RGC type, deploy an outer arbor between the OFF ChAT band and the outer ipRGC plexus; their inner arbor stratifies near the inner boundary of the ON ChAT band. RDS-cells (blue) deploy their dendrites strictly within the ON and OFF ChAT bands.
- Figure 3.
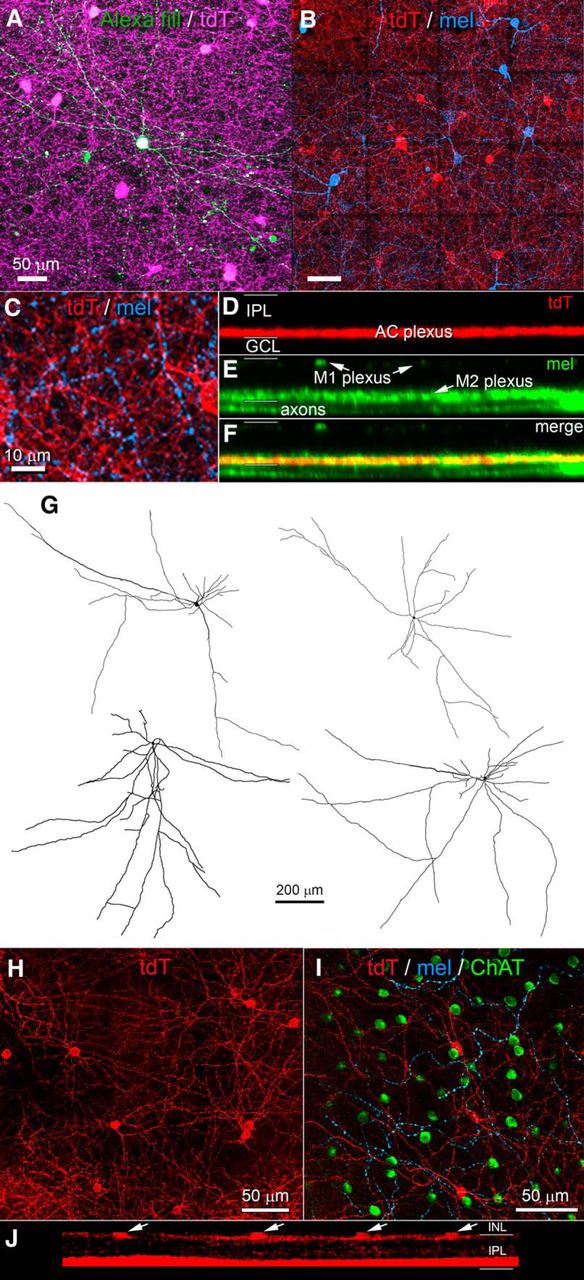
Morphology of ACs labeled in the Rbp4-Cre mouse line. A–G, Morphology of RACs, the Rbp4-Cre-positive wide-field polyaxonal displaced ACs. RAC processes form a dense plexus in the inner ON sublayer intermingled with dendrites of M2 ipRGCs. A, Single intracellularly dye-filled RAC (green) in relation to the dense plexus of fine, horizontally running tdTomato-positive processes in the Rbp4-Cre;Ai14 mouse (magenta). Maximum intensity projection of several optical sections through the GCL and inner ON sublayer of the IPL. B, Relationship of the same plexus of wide-field ACs processes (red, tdTomato reporter for Rbp4-Cre) with the dendritic plexus of M2 ipRGCs (blue, anti-melanopsin). Tiled maximum intensity projection of ∼10 optical sections spanning the plexus and adjacent GCL but entirely proximal to ON ChAT. Scale bar, 50 μm. C, Magnified subregion from B showing numerous points of potential contact between the two cell types. Scale bar, 10 μm. D–F, Orthogonal projections of processes of Cre-positive ACs of the GCL (D), inner and outer ipRGC dendritic plexuses, marked by anti-melanopsin immunofluorescence (E), and a merged view (F) showing costratification of amacrine plexus with that of M2 melanopsin dendrites. G, Drawings of single dye-filled RACs. H–J, Cre-expressing wide-field bistratified ACs of the INL. H, Somata and outer plexus of processes of these cells as shown in maximum intensity projection of a shallow z-stack of confocal optical sections spanning the INL-IPL border. I, Single optical section at the level of this plexus in the most distal IPL showing the processes of tdTomato-labeled AC processes (red) with the dendrites of M1 ipRGCs (cyan), labeled by anti-melanopsin immunofluorescence. Somata of OFF starburst ACs (green) are also visible at this level. J, Orthogonal maximal intensity projection of the z-stack from H, showing the two plexuses of Rbp4-Cre-labeled ACs, an outer one (above) derived from the INL ACs (arrows) and the inner one (below) derived from both these INL ACs and RACs. Scattered labeling between these plexuses comprise connecting dendrites of the INL ACs. Somata in the GCL are not visible because the z-stack spanned only the IPL and proximal INL.
- Figure 4.
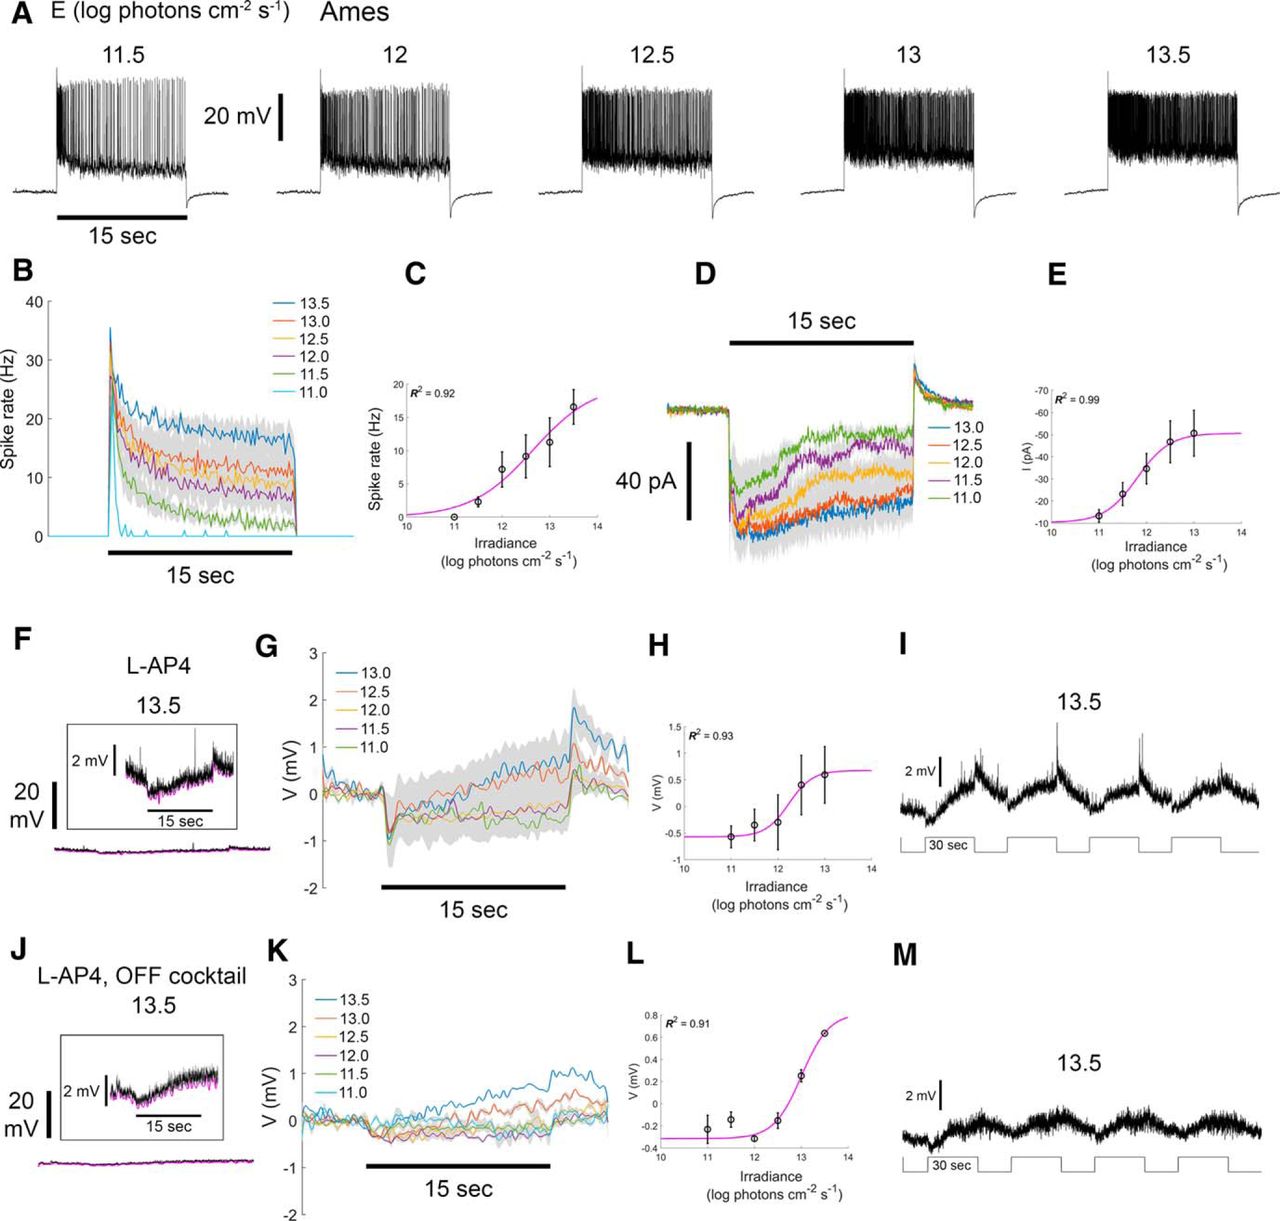
RACs have sustained irradiance-encoding light responses even under blockade of chemical synapses. A, Voltage responses, including spiking, of a single RAC stimulated with a series whole-field light steps of various irradiances under control conditions (Ames’ medium). Whole-cell current-clamp recordings. Irradiance levels in log photons cm−2 s − 1 are indicated above traces. Horizontal black bar below the leftmost trace indicates the timing of the 15-s stimulus (spot diameter, 1200 µm). B, Average PSTHs of spiking evoked by light steps of various irradiances (n = 3 cells; average ± SEM). C, IR curve based on data presented in B. Data points and error bars indicate the average ± SEM of the steady state response, assessed during the last 5 s of the stimulus. Magenta line denotes the fitted sigmoidal Naka-Rushton function. The coefficient of determination (R 2) for the fit is indicated. D, Excitatory inward currents evoked by a series of stimulus irradiance steps under control conditions. Whole-cell recording with voltage clamped at the chloride reversal potential. E, IR curve derived from data in D. F–I, Effect of ON-channel blockade (bath applied L-AP4) on the voltage responses of RACs to light steps. Whole-cell current-clamp recordings. F–I, Voltage responses of a representative RAC during ON-channel blockade. F, Response to the brightest light step tested (black trace; 13.5 log photons cm−2 s − 1). Lower trace is approximately to scale with those in A. Inset, Higher gain display showing transients at onset and offset of the stimulus, plus a slow depolarizing drift of the membrane potential during the stimulus. The lower envelope of the voltage trace is shown in magenta. G, Voltage responses at several irradiances (n = 3 cells; average ± SEM). Lower voltage envelope is shown, rather than raw voltage, to minimize distortion by spikes. H, IR relationship based on data in G. I, Voltage responses to a series of four bright wide-field light steps each 30 s long. Note the gradual depolarization during the stimulus and slow poststimulus decay, which are characteristic of intrinsic melanopsin photoresponses in ipRGCs. J–M, Effects of combined OFF and ON channel blockade on RAC light responses obtained in whole-cell current-clamp configuration (bath applied L-AP4 plus an OFF cocktail that included D-AP5, DNQX, and ACET; n = 3 cells), conventions the same as for matching plots in F–I. Light still drives a slow depolarization, presumably due to persistence of melanopsin-dependent photoresponses in ipRGCs.
- Figure 5.
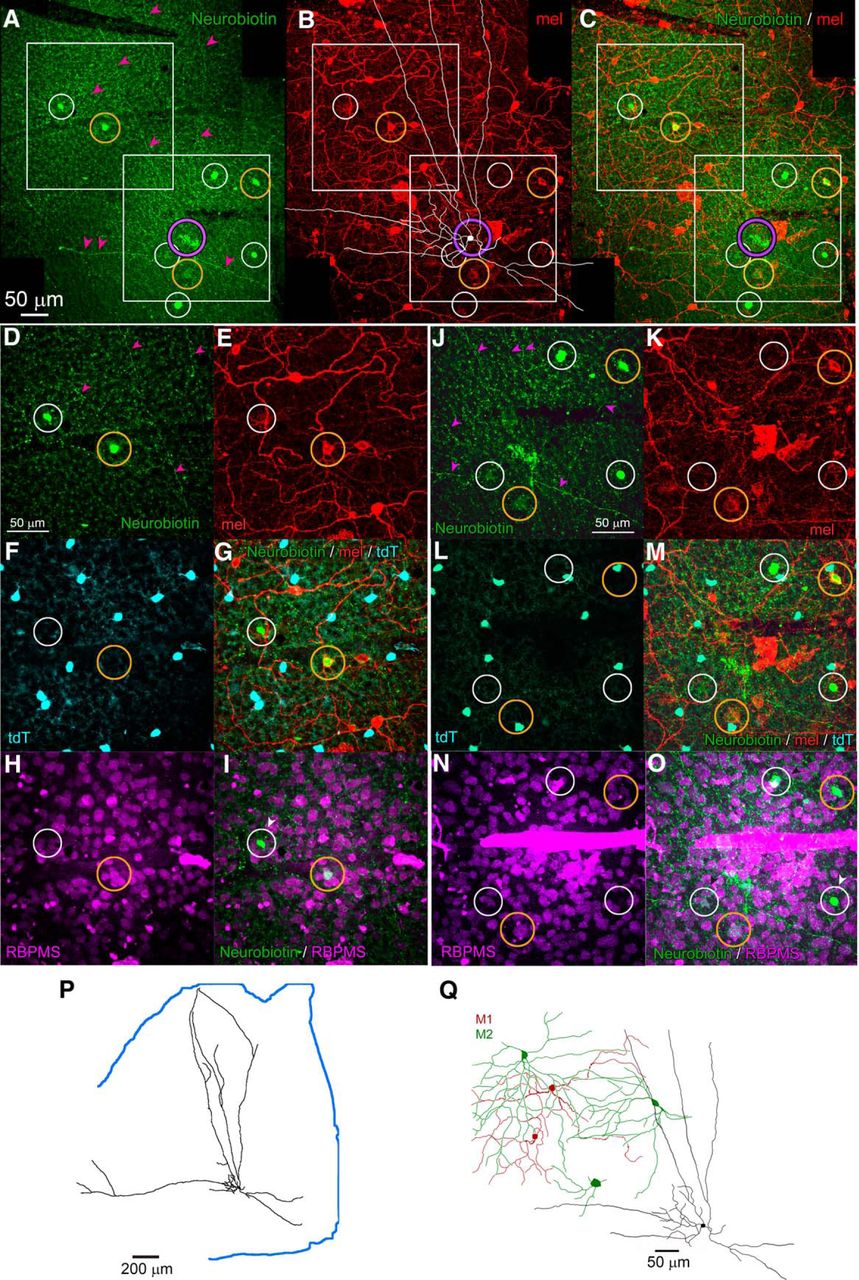
RACs are tracer coupled to M2 ipRGCs and other neurons of the GCL. A–C, Intracellular dye filling and tracer coupling of a Rbp4-Cre displaced AC (RAC) in relation to melanopsin immunoreactivity. Montage of collapsed z-stacks (maximum intensity projections) covering a portion of the RAC’s arbor. A, Fluorescent streptavidin labeling of Neurobiotin-injected RAC (purple circle; partly obscured by artifacts) and in eight cells tracer coupled to it (white and gold circles). Magenta arrowheads indicate the extremely slender processes of the dye-filled RAC. B, Anti-melanopsin immunolabeling. A tracing of the filled RAC is overlaid in white. Circles around tracer-coupled cells are color coded for the melanopsin immunoreactivity of the marked cell: gold for immunopositive cells and white for immunenegative ones. C, Merged view of A, B. D–I, Identity of tracer coupled neurons in region marked by upper white square in A--C. Conventions as in A–C. D, Neurobiotin tracer. E, Anti-melanopsin immunofluorescence. F, Cre-dependent tdTomato labeling. G, Merge of D–F. H, Immunofluorescence for the RGC marker RBPMS. I, Merge of Neurobiotin (D) and RBPMS labeling (H). White arrowhead indicates a tracer-coupled cell that is both RBPMS immunenegative, and thus an AC, and Cre-negative and thus not a RAC. J–O, Same cell as A–I but for the retinal region marked by the lower white square in A–C. P, Tracing of the Neurobiotin-injected RAC, which nearly encompasses this retinal quadrant; retinal margin marked by blue line. Q, Drawings based on dendritic anti-melanopsin immunelabeling of three partially reconstructed M2 ipRGCs (green) that were tracer coupled to the Neurobiotin-filled RAC (black profile). Also traced are two M1 ipRGCs (red) in the same field that were not tracer coupled to the injected RAC.
- Figure 6.
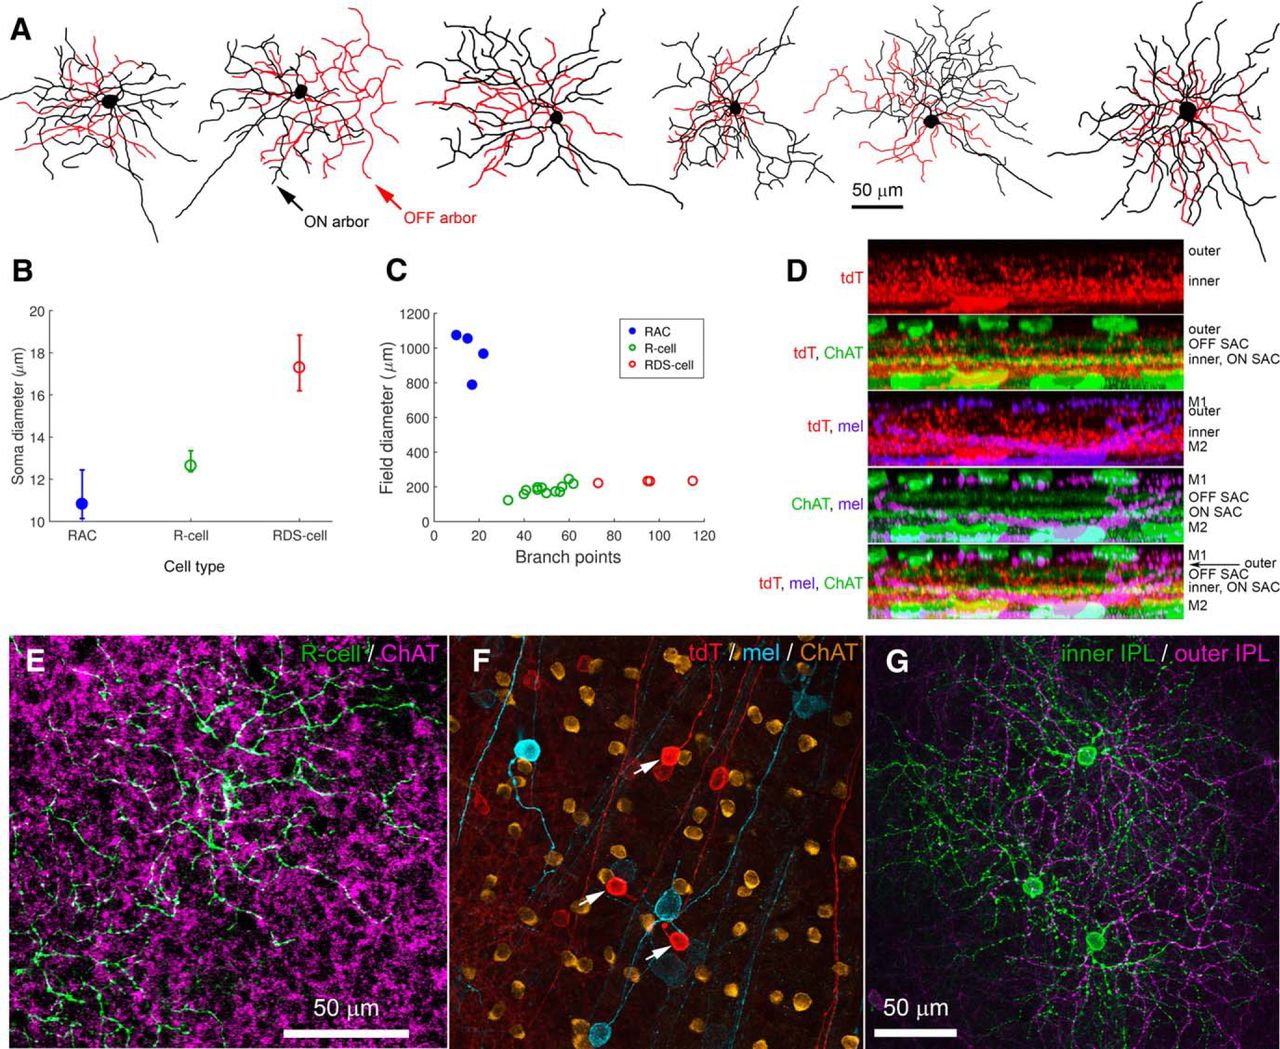
Morphology of the R-cell, a bistratified RGC labeled in the Rbp4-Cre line. A, Examples of the common tdTomato-positive RGCs, R-cell, in the Rbp4-Cre mouse. B, Variation in soma diameter across cell types in the GCL. Soma diameter differed significantly across the three cell types of the GCL [one-way ANOVA, F(2,65) = 90.9, p < 0.001; post hoc pair-wise comparisons revealed that each cell type differed from the other two (p < 0.001)]. C, Dendritic field diameter as a function of number of branch points for RACs, R-cells and RDS-cells. D, Stratification of R-cell processes. Side-view maximum intensity projections of processes in Rbp4-cre cells (red) in relation to processes of M1 and M2 ipRGCs (purple; anti-melanopsin) and to starburst AC (SAC) processes (green; anti-ChAT). The fine Rbp4-cre-positive processes at the level of the inner melanopsin plexus (M2 ipRGC dendrites) are derived from wide-field displaced RACs; the coarse processes are derived mainly from R-cells, and stratify near and within the ON ChAT band and between OFF ChAT and the outer melanopsin plexus (M1 ipRGC dendrites). E, Dendrites of the ON arbor of two virally labeled R-cells (green; flex AAV2-mCherry) tend to cofasciculate with the processes of ON starburst ACs (purple, anti-ChAT), which lie at or very near the same level as the R-cell ON processes. F, Three closely spaced R-cells (red; white arrows) with visible axons, labeled in the Rbp4-Cre-tdTomato mouse. The other red cells are Rbp4-Cre-labeled displaced ACs (RACs). Shown for comparison are the somas and axons of ipRGCs (cyan, anti-melanopsin) and the somas of ON starburst ACs (gold, anti-ChAT). G, The three closely spaced R-cells show a hint of mosaics formed by the dendritic arbors in both the ON (green) and OFF IPL sublayers (purple). Maximum intensity projection of several optical sections centered on the relevant arbor.
- Figure 7.
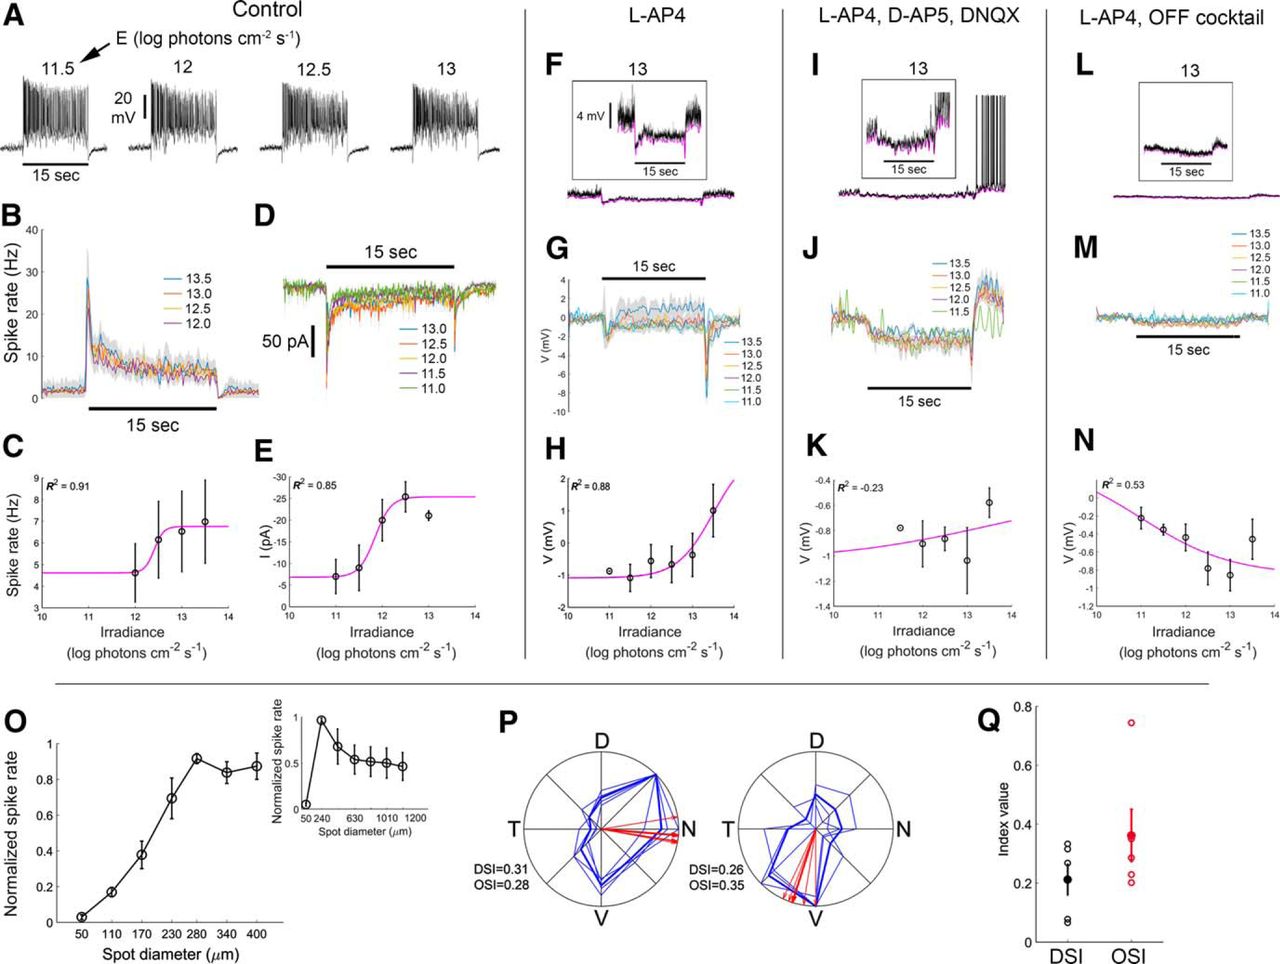
Rbp4 R-cells show sustained irradiance-encoding light-evoked responses. A, Light-evoked firing, obtained in whole-cell current-clamp configuration, to a series of stimulus intensities (irradiance) under control conditions (retina bathed in Ames’ medium only). Irradiances in log photons cm−2 s − 1 are indicated above traces. Horizontal black bar below the leftmost trace indicates the duration of a 15 s wide-field light step from darkness. B, PSTHs averaged across cells (n = 4 cells; average ± SEM) for various irradiance levels. C, IR curve based on data presented in B. Data points and error bars indicate the steady state response (average ± SEM). The coefficient of determination (R 2) of the fit is indicated. D, Light-evoked currents, obtained in whole-cell voltage-clamp configuration, to a series of stimulus irradiance levels under control conditions. The membrane voltage was clamped at the chloride reversal potential. E, IR curve based on data presented in D. F–N, Pharmacological analysis of circuitry underlying R-cell light responses. F–H, RGC responses, obtained in whole-cell current-clamp configuration, while blocking the ON pathway using L-AP4. F, Example of a cell’s light-evoked voltage response (black trace) to the brightest stimulus tested (13 log photons cm−2 s − 1). The lower envelope of the voltage trace is shown in magenta. Inset, Same trace at higher gain showing a sustained hyperpolarization in the voltage response as well as the lower voltage envelope throughout the stimulus duration. G, Voltage envelope (n = 3 cells; average ± SEM) for various irradiance levels. H, IR curve based on data presented in G. I–K, RGC responses (n = 5 cells), obtained in whole-cell current-clamp configuration, while blocking both the ON and OFF pathways using L-AP4, D-AP5, and DNQX. Conventions in individual plots are the same as in F–H. L–N, R-cell responses (n = 4 cells), obtained in whole-cell current-clamp configuration, after more complete synaptic blockade by further addition of the OFF channel blocker ACET to the L-AP4, D-AP5, and DNQX already in the bath. Conventions in individual plots are the same as in F–H. O, Firing rate in response to a series of bright spots on a dark background at varying sizes (main plot, 50-400 μm; inset, 50-1200 μm; n = 3 cells). P, Example of direction and orientation selectivity tuning of two R-cells. Thick blue lines show the average cells’ response to sinusoidal gratings drifting in each of eight different directions, 45° apart. Thin blue lines show data from each of four single trials. N, nasal; D, dorsal; T, temporal; V, ventral. Red lines indicate the preferred direction based on four individual repetitions (thin lines), and their average (thick line). The DSI, OSI, and preferred direction (PD) of the cell are indicated. Q, Average ± SEM DSI and OSI across tested cells (n = 5 cells).
- Figure 8.
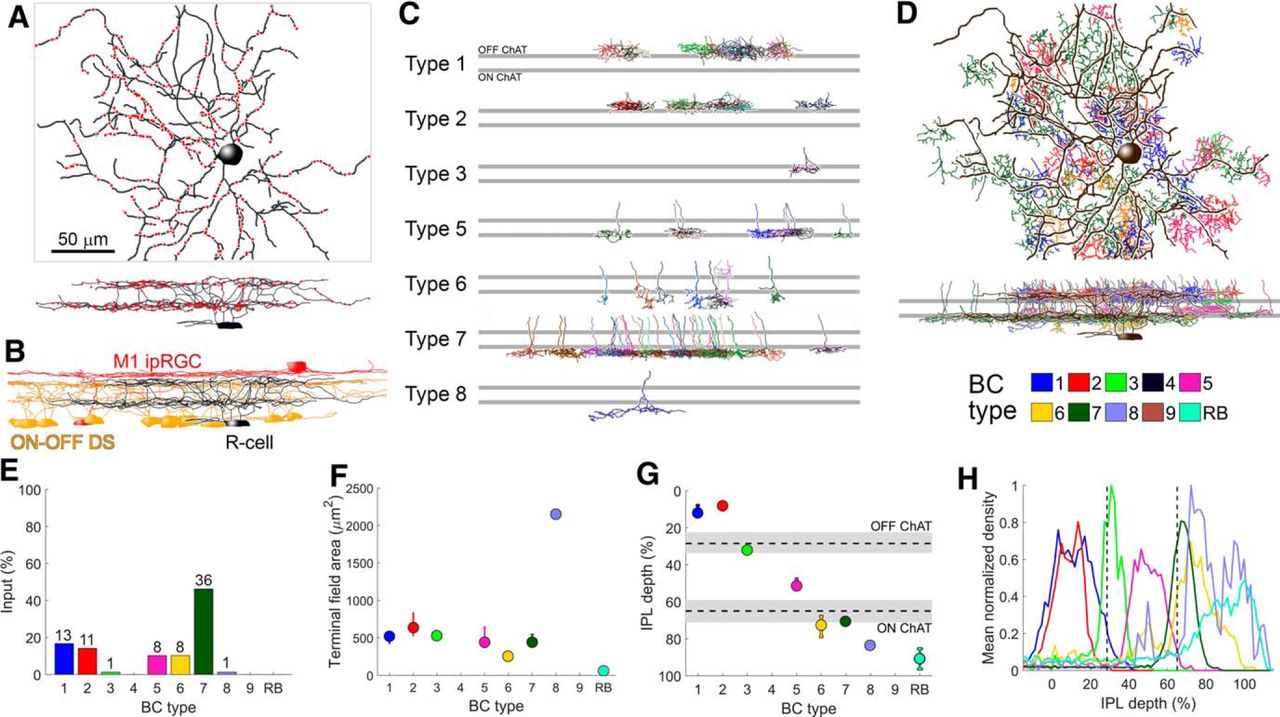
Serial EM reconstruction of an Rbp4 RGC and its synaptic inputs. A, EM reconstruction of a presumptive Rbp4 R-cell (black) along with dyad synapses made onto it (red dots), as viewed en face (top) and in an orthogonal plane (bottom). Scale bar, 50 μm applies to panels A--D. B, Orthogonal view of the presumptive R-cell (black) along with traces of several ON-OFF DS RGCs (yellow) and two M1 ipRGCs (red). The outer dendritic arbor of the presumptive R-cell stratifies below the M1 ipRGC plexus and just above the OFF ChAT band; its inner arbor stratifies just below the ON ChAT band. C, Orthogonal view of BCs making identified ribbon synaptic contacts onto the presumptive R-cell. Top and bottom gray horizontal bars represent the OFF and ON ChAT bands, respectively. D, EM reconstruction of a presumptive R-cell (black) along with BCs that synapse onto it, as viewed en face (top) and in an orthogonal plane (bottom). BC colors follow the scheme indicated in the key below. Note that the presumptive R-cell did not receive input from rod BCs (RB) or cone BCs of types 4 and 9. E, Percentage of all bipolar input to the presumptive R-cell as a function of BC type. OFF input derived mainly through types 1 and 2, and ON input derived mainly through type 7. F, Axon terminal field area (median and first and third quartiles) as a function of BC type. G, IPL depth (median and first and third quartiles) as a function of BC type. H, Mean normalized density of axonal processes as a function depth for each BC type. Although RB cells lacked synaptic contacts onto the presumptive R-cell, they were included in the analysis as a useful benchmark in the assessment of depth of axon-arbor stratification for BC types (see Materials and Methods).
- Figure 9.
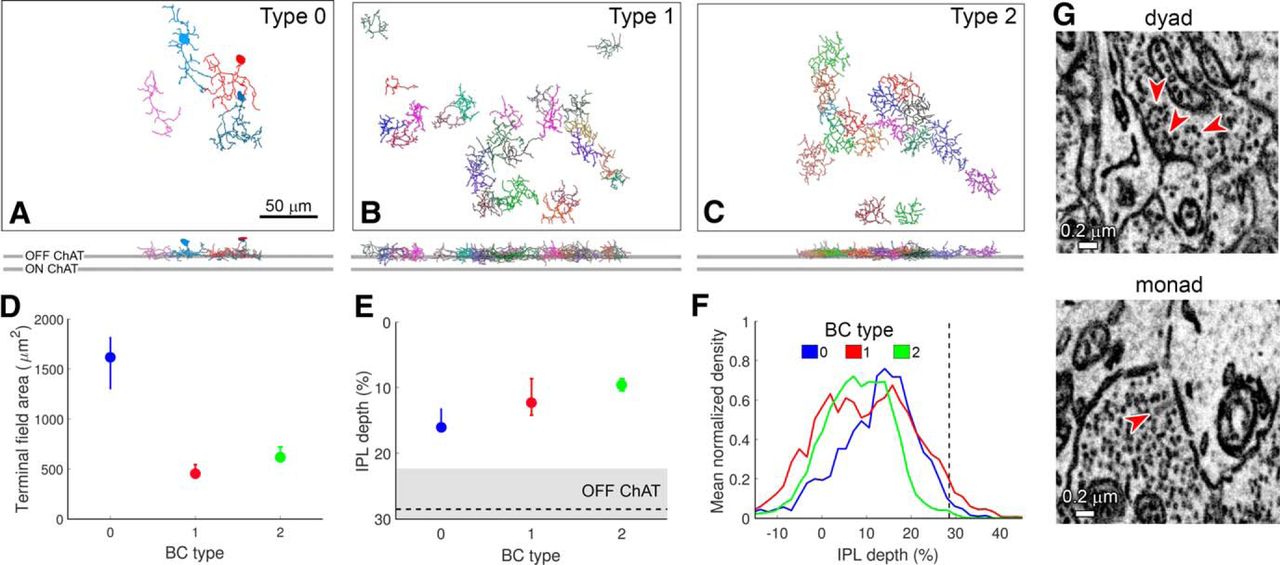
A novel OFF BC, type 0. A–C, Partial mosaics of cone BC types 0, 1, and 2, as viewed en face (top) and in an orthogonal plane (bottom). Top and bottom gray horizontal bars represent the OFF and ON ChAT bands, respectively. Scale bar, 50 μm. The soma of one type 0 was not included in the SBEM volume, perhaps due to slight variation in the orientation of the retina within the SBEM volume. D, Terminal field area (median and first and third quartiles) of type 0 BCs was larger than those of types 1 and 2. E, IPL depth (median and first and third quartiles) of type 0 cells was larger than those of types 1 and 2. Gray horizontal bar represents the OFF ChAT band. F, Mean normalized density of axonal processes of type 0 BCs was slightly more peaked and narrow than types 1 and 2. Vertical dashed line represents the OFF ChAT band. G, Type 0 BCs made both dyad and monad synapses; arrowheads mark ribbons. All contacts onto the presumptive R-cell were dyads; the postsynaptic partners of monads are unknown.
- Figure 10.
Morphology of DS RGCs in the Rbp4-Cre mouse. A, Drawings of three DS RGCs labeled in the Rbp4-Cre mouse (RDS cells). B, Dendritic stratification of an RDS cell. Five views of the same rotated orthographic maximum intensity projection derived from z-stacks taken in the vicinity of a single labeled RDS cell are shown. Views (top to bottom) show the individual tdTomato in the Rbp4:Cre;Ai14 mouse (tdT), tdTomato and anti-ChAT labeling (tdT/ChAT), tdTomato and anti-melanopsin labeling (tdT/mel), anti-ChAT and anti-melanopsin labeling (mel/ChAT), and tdT/mel/ChAT labeling. RDS dendrites with Rbp4-Cre-dependent viral labeling (red) match the depth of the ON and OFF ChAT bands [ON and OFF starburst AC (SAC) arbors, blue]. Both Rbp4 (red) and ChAT (green) labeling appear below the outer M1 ipRGC plexus and above the inner M2 ipRGC plexus (purple). C, Dendrites of the inner arbor of a virally labeled RDS cell (green) cofasciculate with the processes of ON starburst ACs (anti-ChAT) which lie at or very near the same levels as the RDS-cell inner processes. Scale bar, 50 μm. D, Voltage responses of a representative RDS cell to sinusoidal contrast gratings drifting in eight directions at 45° intervals. Polar plot shows response amplitude as a function of stimulus direction (normalized to maximum response). Red vector shows preferred direction in retinal coordinates (N, nasal; D, dorsal; T, temporal; V, ventral). E, Voltage traces for the same representative RDS cell, illustrating the ON and OFF responses to the leading and trailing edges of a drifting bright bar. F, A polar plot summarizing the direction preference (vector angle) and DSI (vector length). RDS cells preferred ventral motion on the retina. G, A polar plot summarizing the direction of dendritic arbor asymmetry (vector angle) and asymmetry index (AI, vector length), for the inner (blue) and outer (green) arbors. H, I, Both types of Rbp4-cre RGCs (R-cells and RDS cells) are CART immunoreactive. Triple labeling in the GCL for Rbp4-Cre-tdTomato (red), CART (green; an immunomarker for ON-OFF DS RGCs), and RBPMS (magenta; an immunomarker for RGCs). Cre-positive ganglion cells are indicated by white markers. Most are R-cells (hollow white arrowheads), but two are RDS cells (filled white arrows). All of these are also immunopositive for RBPMS and CART (I). Cre-positive displaced ACs (RACs), indicated by blue markers, are identifiable from their RBPMS immunonegativity (I). Virtually all of these lack CART immunolabeling (hollow blue arrowheads), but one RAC appeared to be CART-immunopositive (solid blue arrow). Scale bar, 50 μm.
- Figure 11.
Brain projections of Rbp4 RGCs, and R-cells alone. A–D, Axon terminal labeling following injection of a Cre-dependent viral reporter. A, Labeling was evident in the LGN (A, C) and NOT (A, B). C, Two coronal sections, consecutive along the rostral-caudal axis. Labeling was evident in the dorsal and ventral divisions of the LGN (dLGN, vLGN), but not in the intergeniculate leaflet (IGL). Labeling was restricted to a narrow band along the lateral margin of the vLGN. D, Intense labeling was evident also in the superficial layers of the SC. E, Axon terminal labeling following sparse labeling of Cre-expressing neurons. Only three RGCs were detectably labeled in this retina, and all were bistratified R-cells. Axon terminal labeling was detected only in the dLGN (at the boundary between core and shell regions), in the vLGN (left), and in the most superficial layers of the SC (right).


Tables
- Table 1.
Summary (average ± SD) of morphologic properties of RGCs and ACs in the GCL of Rbp4-Cre mouse
R-cell (n = 13) R-cell EM (n = 1) RDS (n = 4) RAC (n = 4) Soma diameter (μm) 12.9 ± 1.0 (n = 16) 16.1 17.5 ± 2.0 (n = 4) 11.2 ± 1.4 (n = 46) ON dendritic field diameter (μm) 178 ± 35 192 177 ± 15 970 ± 130 OFF dendritic field diameter (μm) 138 ± 36 189 194 ± 27 Global dendritic field diameter (μm) 186 ± 33 218 229 ± 6 Total dendrite length (μm) 2912 ± 1076 3883 4965 ± 981 6765 ± 1595 Branch points 53 ± 15 47 95 ± 11 16 ± 5 Primary dendrites 5 ± 2 3 4 ± 1 5 ± 1 ON/OFF ratio of dendritic field diameter 1.3 ± 0.2 1 0.9 ± 0.1 % of total branch points in inner IPL 61 ± 8 55 42 ± 3 % of total dendritic length in inner IPL 62 ± 7 58 34 ± 6 Soma diameters were estimated from photomicrographs of whole-mounted Rbp4-Cre;Ai14 retinas with exposures optimized for crisp definition of somatic profiles, thus avoiding overestimates from “bloom” of intense somatic fluorescence. Global dendritic field diameter represents the diameter of a circle that has the same area as a convex polygon minimally enclosing both inner and outer arbors.
In this issue


