

Article Figures & Data
Figures
- Figure 1.
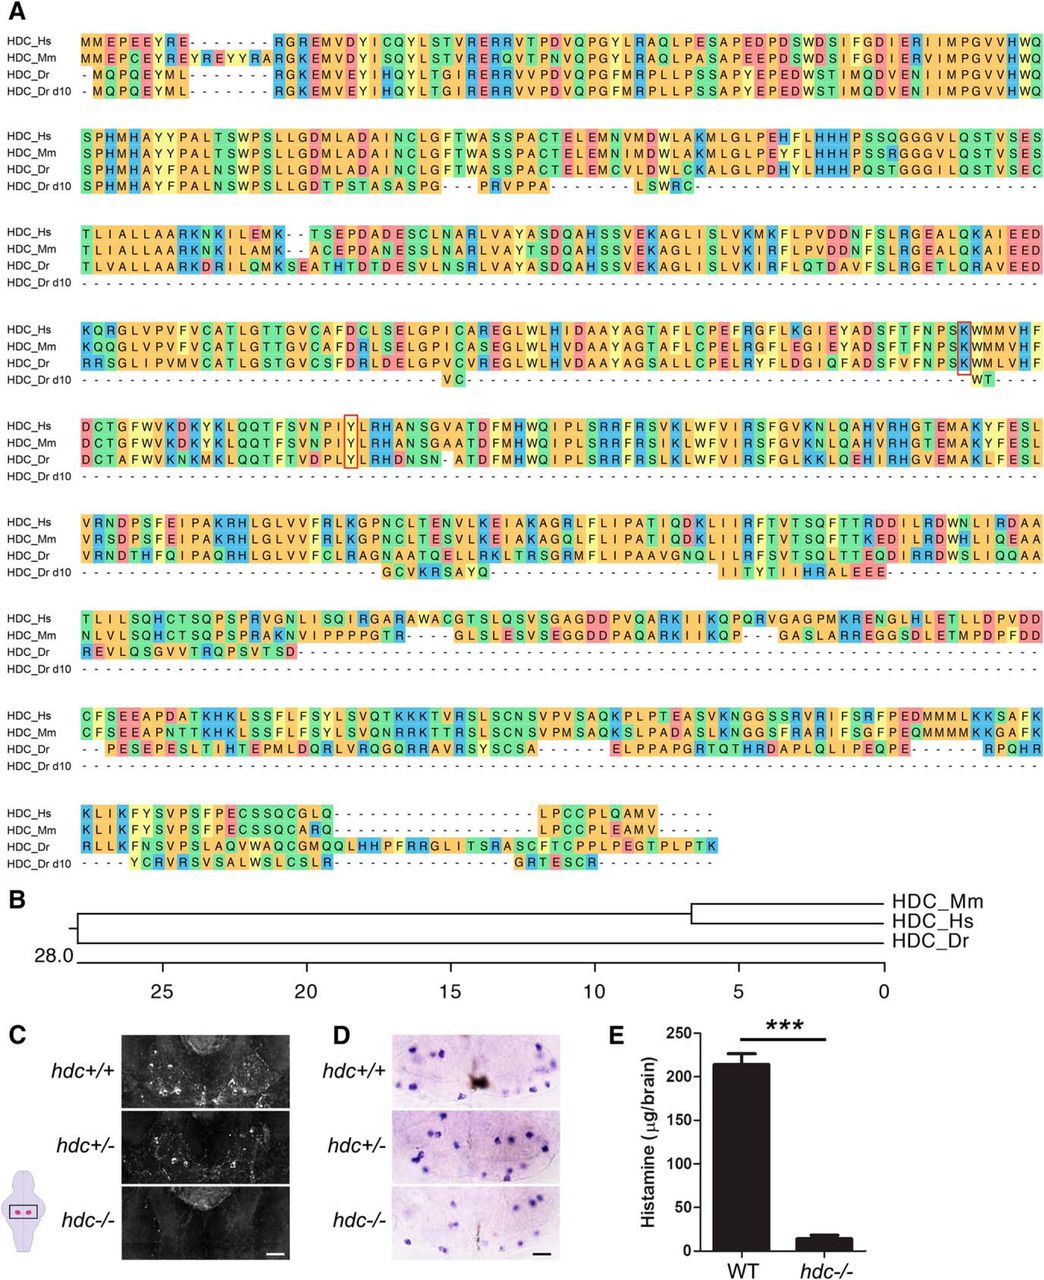
Characterization of hdc−/− zebrafish. A, Alignment of Hdc protein sequences from human (Hs, ENSG00000140287), mouse (Mm, ENSMUSG00000027360), zebrafish WT (Dr, ENSDARG00000075454), and zebrafish 10-bp deletion mutant (Dr d10). The red box indicates an amino acid required for the activity of human Hdc (Komori et al., 2012a). Amino acids are colored to indicate residues with similar properties. B, Phylogenetic tree of human, mouse, and zebrafish Hdc. Values indicate the number of amino acid substitutions per 100 residues. C, D, Ventral views of 5 dpf larval brains in which histaminergic neurons are labeled using IHC with a histamine-specific antibody (C) or ISH using an hdc-specific riboprobe (D) are shown for hdc+/+, hdc+/−, and hdc−/− siblings. Histamine is reduced in hdc+/− larvae and undetectable in hdc−/− larvae (C), but the number of hdc-expressing neurons is only slightly reduced in hdc−/− larvae compared with their hdc+/+ and hdc+/− siblings (D). Boxed region in schematic diagram (lower left) indicates region shown in (C, D), with the TMN shaded magenta. Scale bars: 20 µm. E, Histamine concentration assayed by ELISA from WT and hdc−/− adult brains. Little or no histamine was detected in hdc−/− fish. Histamine detected in hdc−/− animals is below the level of assay sensitivity and precision. ***p < 0.001 by Student’s t test.
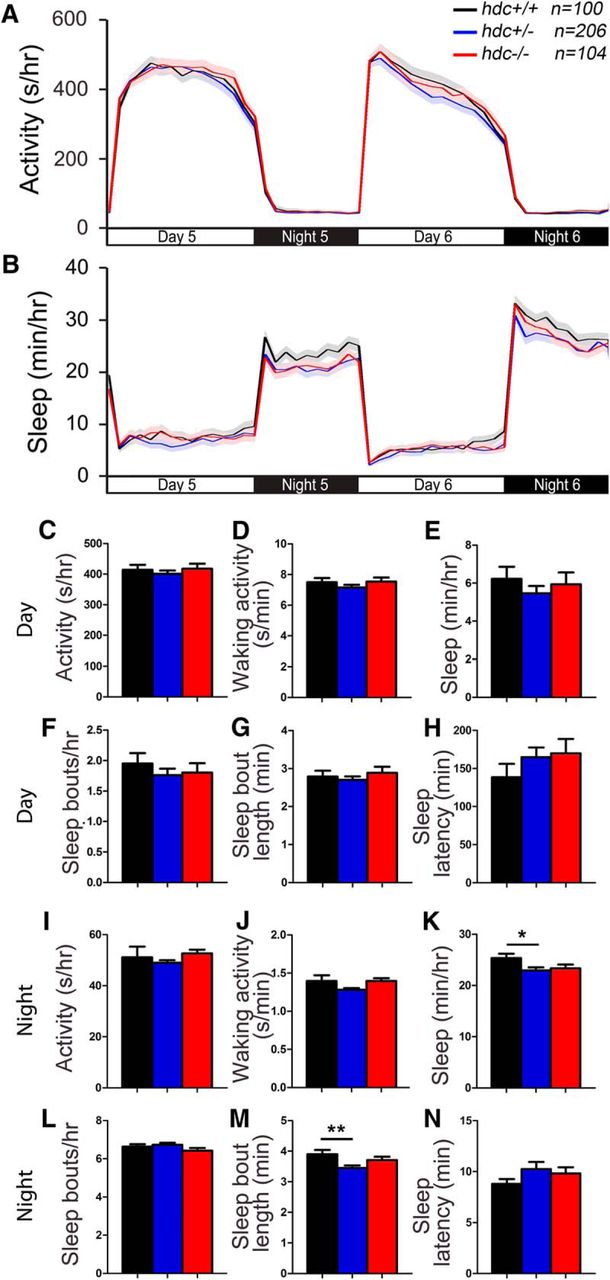
- Figure 2.
hdc mutant larvae exhibit normal sleep/wake behaviors. hdc−/− (red), hdc+/− (blue) and hdc+/+ (black) siblings exhibit similar amounts of all measured parameters, except that hdc+/− larvae sleep slightly less (K) and have slightly shorter sleep bouts (M) at night compared with their hdc+/+ siblings. Line and bar graphs represent the mean ± SEM for five experiments combined; n indicates the number of animals analyzed. *p < 0.05; **p < 0.01 for the indicated comparisons by one-way ANOVA with Tukey’s HSD test.
- Figure 3.
The absence of a larval hdc zygotic mutant behavioral phenotype is not due to rescue by maternal WT hdc. hdc−/− (red) and hdc+/− (blue) larvae that were generated by mating an hdc−/− female to an hdc+/− male fish do not show major changes in measured sleep/wake behaviors, except that hdc−/− larvae have a longer latency to first sleep bout during the day (H). Line and bar graphs represent the mean ± SEM for five experiments combined; n indicates the number of animals analyzed. *p < 0.05 for the indicated comparison by Student’s t test.
- Figure 4.
Alignment of Hrh1. A, Hrh1 protein sequences from human (Hs, ENSG00000196639), mouse (Mm, ENSMUSG00000053004), zebrafish WT (Dr, ENSDARG00000052425), and zebrafish mutant (Dr hu3427). Blue lines indicate predicted transmembrane domains. Amino acids are colored to indicate residues with similar properties. B, Phylogenetic tree of human, mouse, and zebrafish Hrh1. Values indicate the number of amino acid substitutions per 100 residues.
- Figure 5.
hrh1 mutant larvae exhibit largely normal sleep/wake behaviors. hrh1−/− (red), hrh1+/− (blue), and hrh1+/+ (black) siblings exhibit similar amounts of all measured parameters, except that hrh1−/− and hrh1+/− larvae exhibit higher waking activity at night compared with hrh1+/+ siblings (J), and hrh1+/− larvae exhibit higher waking activity during the day (D) and higher activity at night (I) compared with their hrh1+/+ siblings. Line and bar graphs represent the mean ± SEM for four experiments combined; n indicates the number of animals analyzed. *p < 0.05; **p < 0.01; ***p < 0.001 for the indicated comparisons by one-way ANOVA with Tukey’s HSD test.
- Figure 6.
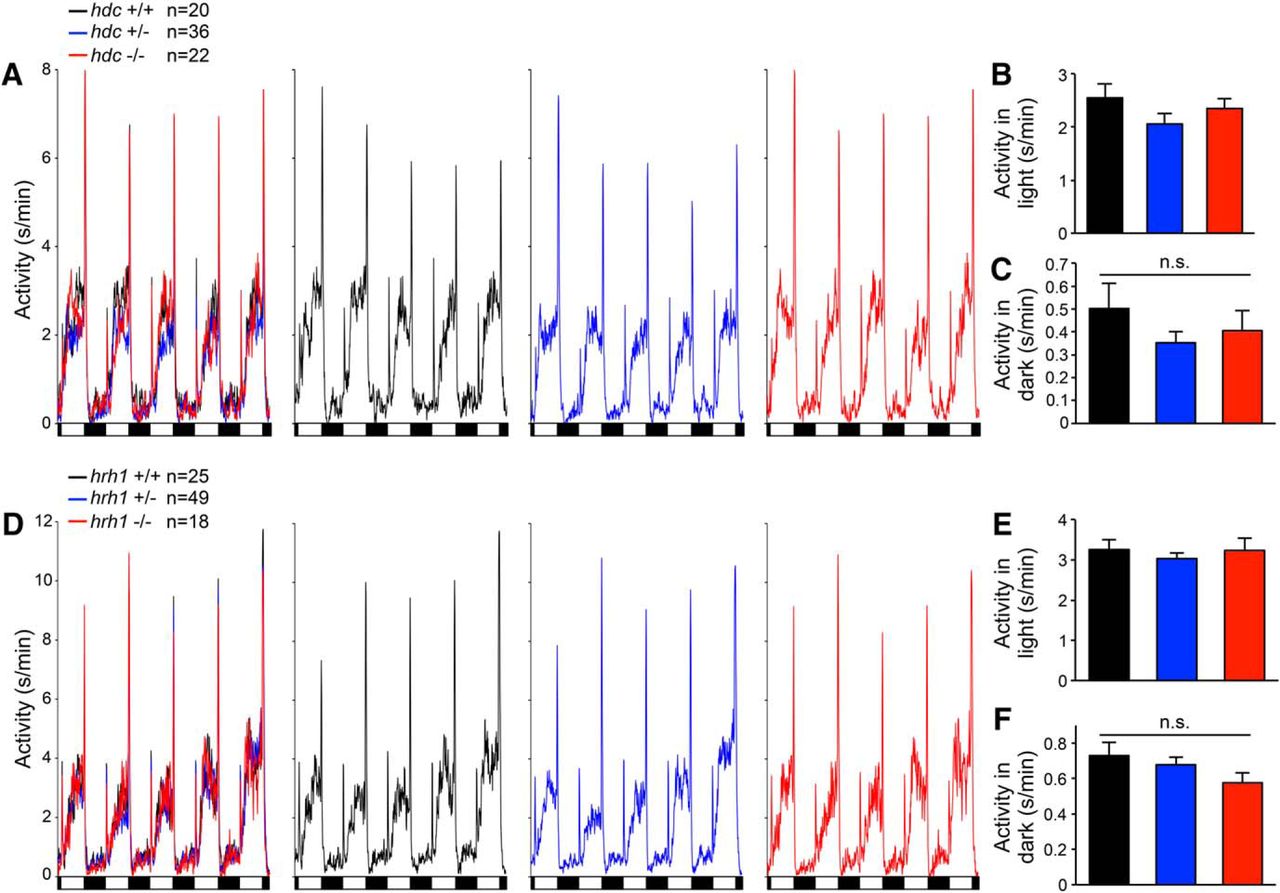
hdc and hrh1 mutants exhibit normal behavioral responses to alternating periods of light and darkness. A, D, Line graphs represent the mean locomotor activity of hdc+/+ (black), hdc+/− (blue), and hdc−/− (red) larvae (A), or hrh1+/+ (black), hrh1+/− (blue), and hrh1−/− (red) larvae (D), plotted in a single graph containing all three genotypes (left) as well as in graphs showing individual genotypes to facilitate comparisons. Similar behavioral responses to light onset and offset are apparent for hdc−/− (A) and hrh1−/− (D) larvae compared with sibling controls. Black and white boxes indicate 1-h periods of light and darkness. B, C, E, F, Bar graphs represent the mean ± SEM locomotor activity during light and dark periods. There is no significant difference in the amount of locomotor activity during either light or dark periods for hdc−/− (B, C) or hrh1−/− (E, F) larvae compared with sibling controls. Data for five light/dark cycles at night is shown, but similar results are obtained when data are averaged over the entire 24-h experiment; n indicates the number of animals analyzed. n.s. = not significant (p > 0.05) for all comparisons by one-way ANOVA with Tukey’s HSD test.
- Figure 7.
hdc and hrh1 mutants exhibit normal behavioral responses to a mechano-acoustic stimulus. hdc+/+, hdc+/−, and hdc−/− larvae have the same response profile during the day (A) and night (B) (p > 0.05, extra sum-of-squares F test), and are equally likely to respond to tapping when asleep (C) (p > 0.05, one-way ANOVA). Similar results were obtained for hrh1+/+, hrh1+/−, and hrh1−/− larvae (D–F). Bar graphs represent the mean ± SEM; n indicates the number of animals analyzed.
- Figure 8.
Alignment of Hrh2. A, Hrh2 protein sequences from human (Hs, ENSG00000113749), mouse (Mm, ENSMUSG00000034987), zebrafish WT (Hrh2a_Dr, NM_001045338; Hrh2b_Dr, ENSDARG00000057479), and zebrafish mutant (Hrh2a_Dr d10; Hrh2b_Dr d8). Blue lines indicate predicted transmembrane domains. Amino acids are colored to indicate residues with similar properties. B, Phylogenetic tree of human, mouse, and zebrafish Hrh2. Values indicate the number of amino acid substitutions per 100 residues.
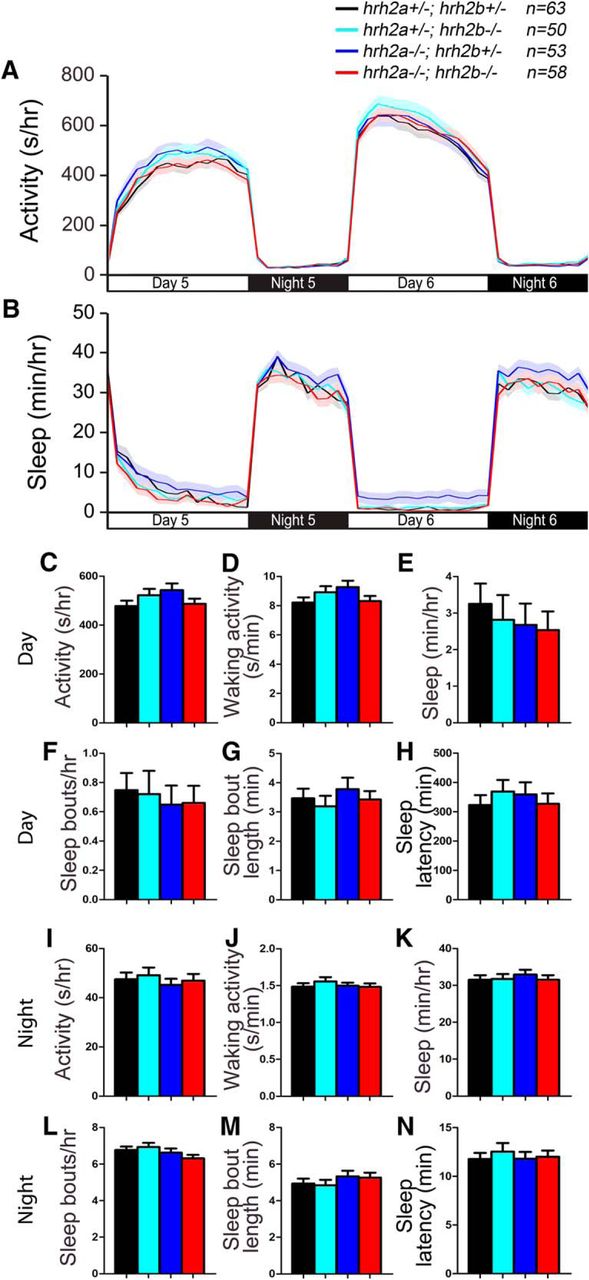
- Figure 9.
hrh2 mutant larvae exhibit normal sleep/wake behaviors. hrh2a−/−; hrh2b−/− (red), hrh2a+/−; hrh2b+/− (black), hrh2a+/−; hrh2b−/− (cyan), and hrh2a−/−; hrh2b+/− (blue) larvae exhibit similar amounts of all measured sleep/wake parameters. Line and bar graphs represent the mean ± SEM for three experiments combined; n indicates the number of animals analyzed. p > 0.05 for all comparisons by one-way ANOVA with Tukey’s HSD test.
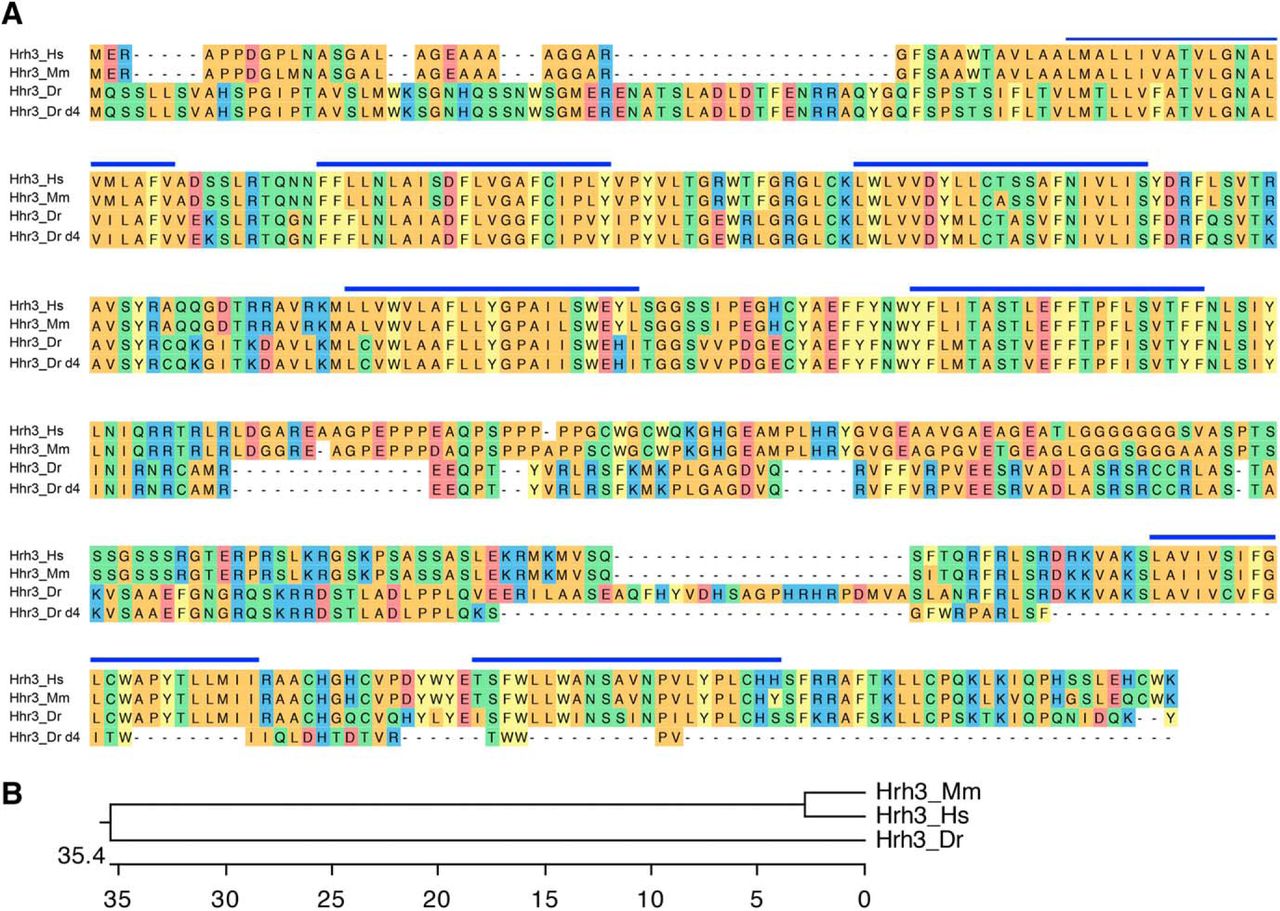
- Figure 10.
Alignment of Hrh3. A, Hrh3 protein sequences from human (Hs, ENSG00000101180), mouse (Mm, ENSMUSG00000039059), zebrafish WT (Dr, ENSDARG00000035942), and zebrafish mutant (Dr d4). Blue lines indicate predicted transmembrane domains. Amino acids are colored to indicate residues with similar properties. B, Phylogenetic tree of human, mouse, and zebrafish Hrh3. Values indicate the number of amino acid substitutions per 100 residues.
- Figure 11.
hrh3 mutant larvae have longer sleep bouts but otherwise exhibit normal sleep/wake behaviors. hrh3−/− (red), hrh3+/− (blue), and hrh3+/+ (black) larvae exhibit similar amounts of all measured parameters, except that hrh3−/− larvae have longer sleep bouts during the day and night compared with hrh3+/+ siblings (G, M), and hrh3+/− larvae exhibit higher waking activity at night compared with hrh3+/+ siblings (J). Line and bar graphs represent the mean ± SEM for six experiments combined; n indicates the number of animals analyzed. *p < 0.05 for the indicated comparisons by one-way ANOVA with Tukey’s HSD test.
- Figure 12.
hrh1; hrh2a; hrh2b; hrh3 quadruple mutant larvae exhibit normal sleep/wake behaviors. hrh1−/−; hrh2a−/−; hrh2b−/−; hrh3−/− (red), hrh1−/−; hrh2a+/−; hrh2b+/−; hrh3−/− (black), hrh1−/−; hrh2a+/−; hrh2b−/−; hrh3−/− (cyan), and hrh1−/−; hrh2a−/−; hrh2b+/−; hrh3−/− (blue) larvae exhibit similar amounts of all measured sleep/wake parameters. Line and bar graphs represent the mean ± SEM for two experiments combined; n indicates the number of animals analyzed. p > 0.05 for all comparisons by one-way ANOVA with Tukey’s HSD test.
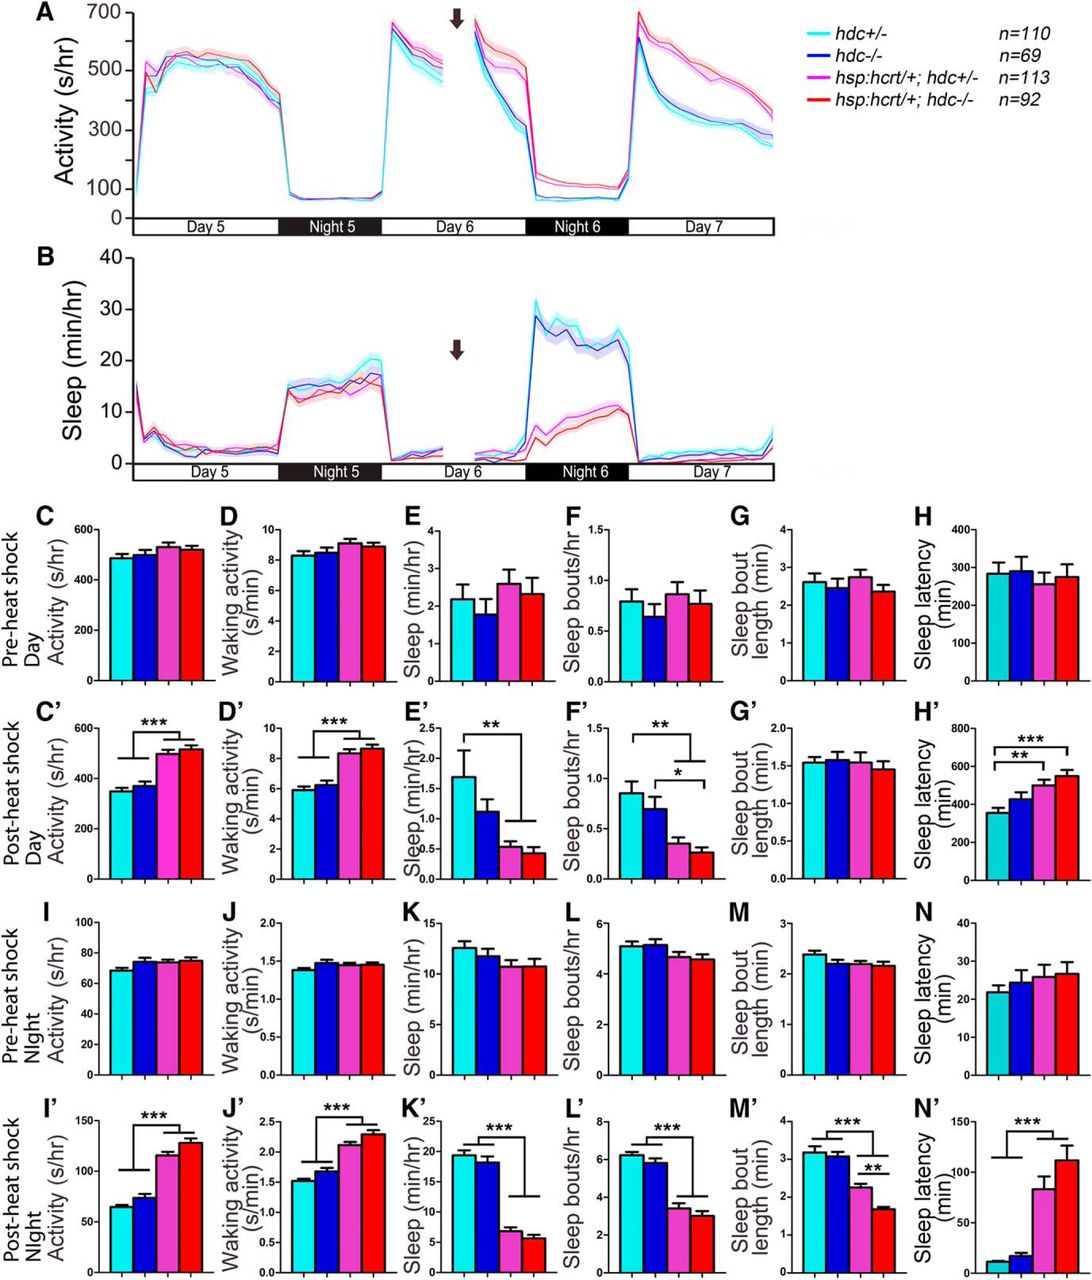
- Figure 13.
Hcrt overexpression-induced hyperactivity and reduced sleep does not require histamine. Before heat shock-induced Hcrt overexpression, there is no difference in all measured sleep/wake parameters between animals of each genotype (A–H, I–N). Following a 1-h heat shock during the afternoon of day 6 (indicated by arrows in line graphs), during both the day and night, both Tg(hsp:hcrt/+); hdc−/− (red) and Tg(hsp:hcrt/+); hdc+/− (magenta) larvae exhibit more activity (A, C’, I’) and waking activity (D’, J’), less sleep (B, E’, K’), fewer sleep bouts (F’, L’), and increased latency to first sleep bout following light transitions (H’, N’) compared with hdc+/− (cyan) and hdc−/− (blue) siblings. There is no significant difference between Tg(hsp:hcrt/+); hdc−/− and Tg(hsp:hcrt/+); hdc+/− larvae, except that Tg(hsp:hcrt/+); hdc−/− larvae have shorter sleep bouts at night than Tg(hsp:hcrt/+); hdc+/− larvae (M’). Line and bar graphs represent the mean ± SEM for four experiments combined; n indicates the number of animals analyzed. *p < 0.05; **p < 0.01; ***p < 0.001 for the indicated comparisons by two-way ANOVA with Tukey’s HSD test.
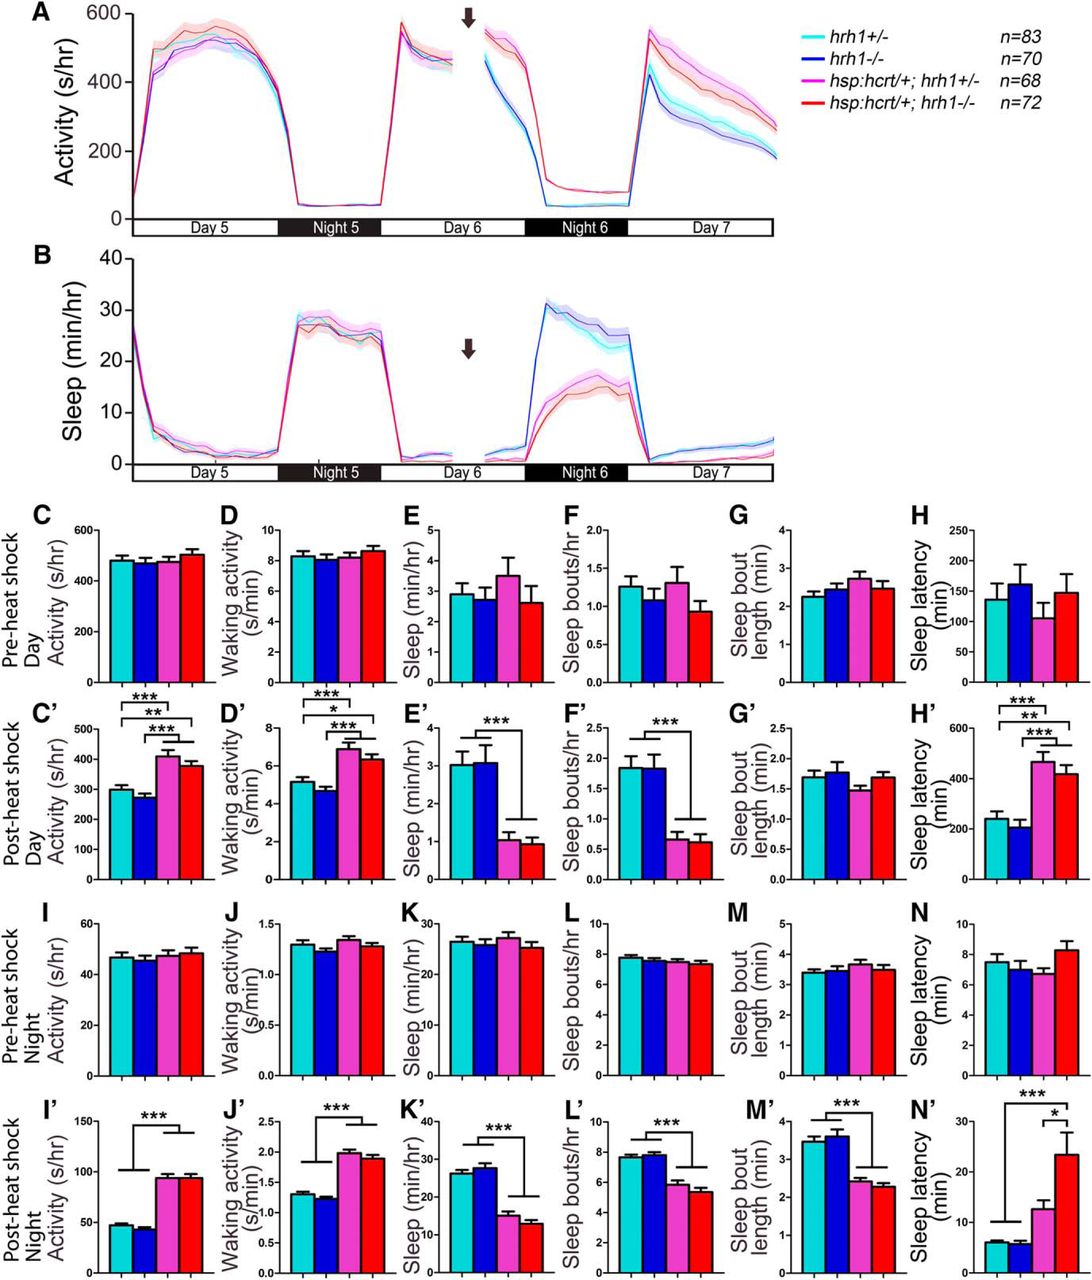
- Figure 14.
Hypocretin overexpression-induced hyperactivity and reduced sleep does not require hrh1. Before heat shock-induced Hcrt overexpression, there is no difference in all measured sleep/wake parameters between animals of each genotype (A–H, I–N). Following a 1-h heat shock during the afternoon of day 6 (indicated by arrows in line graphs), during both the day and night, both Tg(hsp:hcrt/+); hrh1−/− (red) and Tg(hsp:hcrt/+); hrh1+/− (magenta) larvae exhibit more activity (A, C’, I’) and waking activity (D’, J’), less sleep (B, E’, K’), fewer sleep bouts (F’, L’), and increased latency to first sleep bout following light transitions (H’, N’) compared with hrh1+/− (cyan) and hrh1−/− (blue) siblings. There is no significant difference between Tg(hsp:hcrt/+); hrh1−/− and Tg(hsp:hcrt/+); hrh1+/− larvae after heat shock, except that Tg(hsp:hcrt/+); hrh1−/− larvae have a longer latency to first sleep bout at night than their Tg(hsp:hcrt/+); hrh1+/− siblings (N’). Line and bar graphs represent the mean ± SEM for four experiments combined; n indicates the number of animals analyzed. *p < 0.05; **p < 0.01; ***p < 0.001 for the indicated comparisons by two-way ANOVA with Tukey’s HSD test.
- Figure 15.
Optogenetic stimulation of hcrt-expressing neurons promotes locomotor activity in hdc and hrh1 mutant larvae. A, ReaChR-mCitrine is specifically expressed in hcrt-expressing neurons in Tg(hcrt:ReaChR-mCitrine) larvae. IHC using antibodies specific for mCitrine (green) and Hcrt (red) are shown. Asterisks indicate the soma of neurons labeled with the Hcrt-specific antibody. A maximum intensity projection of a ventral view of a 5 dpf larval brain is shown. Scale bar: 20 µm. B, D, Locomotor activity before (white background) and during (blue background) blue light stimulation. C, E, Locomotor activity during blue light stimulation normalized to average prestimulation activity level for each genotype and expressed relative to ReaChR negative siblings for hdc+/− (C) and hrh1+/− (E) larvae. Data are pooled from three (B, C) or four (D, E) experiments and are represented as mean ± SEM; n indicates the number of animals analyzed. *p < 0.05; **p < 0.01; n.s. = not significant (p > 0.05) by one-way ANOVA with Tukey’s HSD test.
- Figure 16.
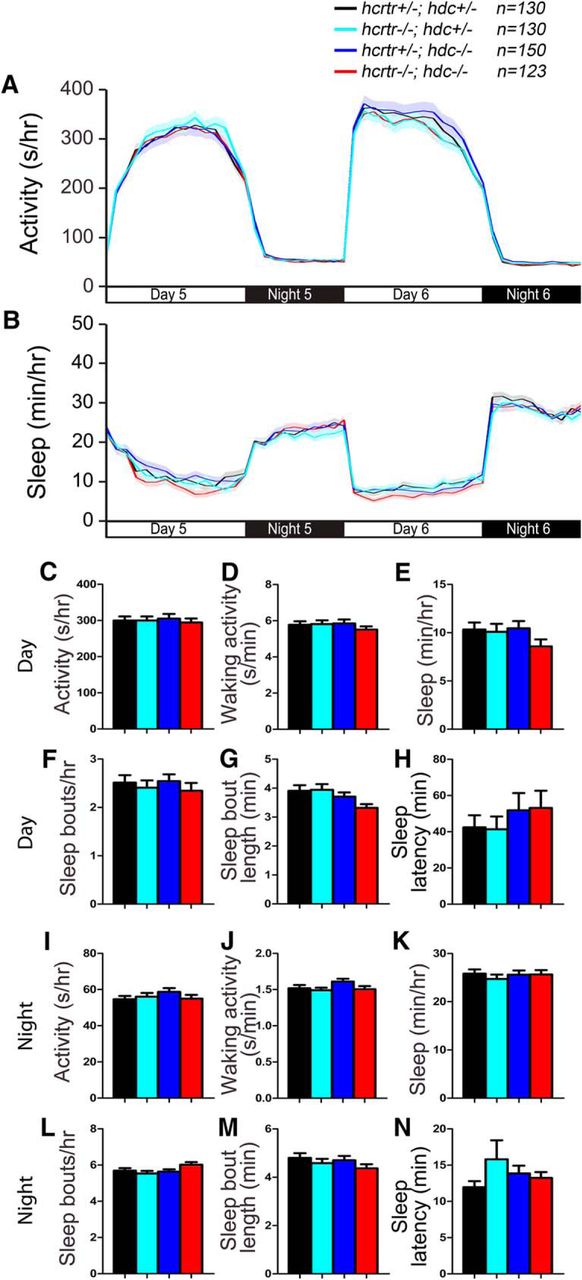
hcrtr; hdc double mutant larvae exhibit normal sleep/wake behaviors. hcrtr−/−; hdc−/− (red), hcrtr+/−; hdc+/− (black), hcrtr−/−; hdc+/− (cyan), and hcrtr+/−; hdc−/− (blue) larvae exhibit similar amounts of all measured sleep/wake parameters. Line and bar graphs represent the mean ± SEM for six experiments combined. Bar graphs show total values for day and night periods; n indicates the number of animals analyzed. p > 0.05 for all comparisons by one-way ANOVA with Tukey’s HSD test.
- Figure 17.
Absence of Hcrt or histamine signaling does not affect the number of histaminergic or Hcrt neurons. A, There is no difference in the number of hdc-expressing neurons between hcrtr+/+, hcrtr+/−, and hcrtr−/− larvae (n = 21, 42, and 27, respectively). B, There is no difference in the number of hcrt-expressing neurons between hdc+/+, +/−, and hdc−/− siblings (n = 13, 17, and 13, respectively). hdc and hcrtr expression was assayed by ISH at 5 dpf. ns = no statistically significant difference (p > 0.05) by one-way ANOVA with Tukey’s HSD test.


In this issue


