

Article Figures & Data
Figures
- Figure 1.
Memory encoding paradigm. A, B, Participants were trained to use two mnemonic encoding strategies: the spatial method of loci (A) and the nonspatial pegword method (B). In both methods, participants have to link internal cues, which are either familiar waypoints or associations of items to numbers, to items presented during the encoding phase. During each encoding phase, lists of 20 words were presented sequentially followed by a distracter task and a free recall phase. C, The whole experiment entailed a training phase the day before and 12 encoding–recall cycles during EEG or fMRI recordings.
- Figure 2.
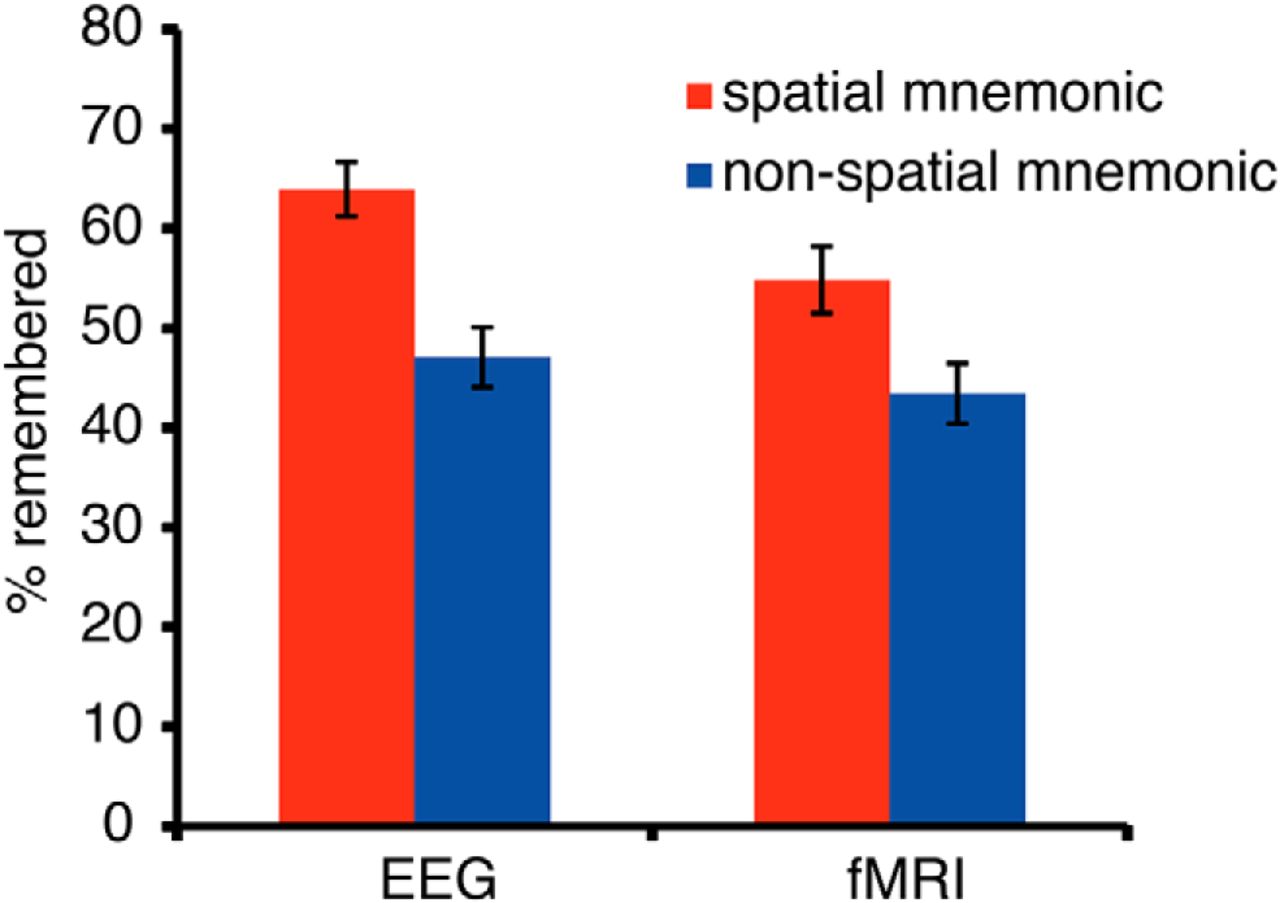
Memory performance: the percentage of recalled words in the spatial and nonspatial encoding condition during the EEG experiment and fMRI experiment. In both datasets, memory performance was higher using the spatial method of loci mnemonic. Error bars show the SEM.
- Figure 3.
EEG sensor level results. A, A cluster permutation statistic restricted to the theta frequency range revealed ongoing decreases in theta oscillatory power for spatial mnemonic processing in contrast with nonspatial processing, and item-related theta power decreases correlating with successful memory formation. The time–frequency plots show the t-sum values across electrodes of the significant clusters at every time–frequency bin to visualize the extent of the three-dimensional clusters. B, Additional increases in alpha/beta power during spatial encoding and memory formation were evident after word presentation. Time–frequency plots here show p values of a sliding cluster statistic (i.e., separately calculated cluster permutation tests of each time–frequency bin). C, Topographies of theta and alpha/beta power effects of a cluster statistic for the average power for time–frequency windows highlighted in B (dashed boxes) are plotted below, circles highlight electrodes belonging to significant clusters. Warm colors indicate increases in power for spatial processing and successfully encoded items, cold colors indicate decreases in power for spatial processing and successfully encoded items in contrast to nonspatial processing and subsequently forgotten items, respectively.
- Figure 4.
fMRI results for spatial vs nonspatial contrasts and memory effects. A, A region of interest analysis was performed for MTL regions, revealing increases in activity for the spatial mnemonic and successful memory formation (p < 0.001, cluster size >10). B, C, An exploratory whole-brain analysis revealed additional effects in typical spatial cortical networks (i.e. retrosplenial cortex, bilateral MTL, B) and memory related regions (i.e., left inferior frontal gyrus, C; p < 0.001, all p < 0.05 FWE cluster level). Warm colors indicate higher BOLD signals for spatial processing and later remembered items; cold colors indicate higher BOLD signals for nonspatial processing and subsequently forgotten items.
- Figure 5.
Theta power changes in MTL. A, MTL region of interest consisting of parahippocampal gyrus and hippocampus, highlighted here in green (right MTL) and yellow (left MTL). Virtual electrodes were placed in the same ROIs as in fMRI ROI analysis (Figs. 4A, 7). B, Theta power effects of virtual electrodes in left and right MTL: theta power decreases were found bilaterally for spatial vs nonspatial processing and left lateralized for successful memory formation. Nonsignificant time–frequency bins are whitened.
- Figure 6.
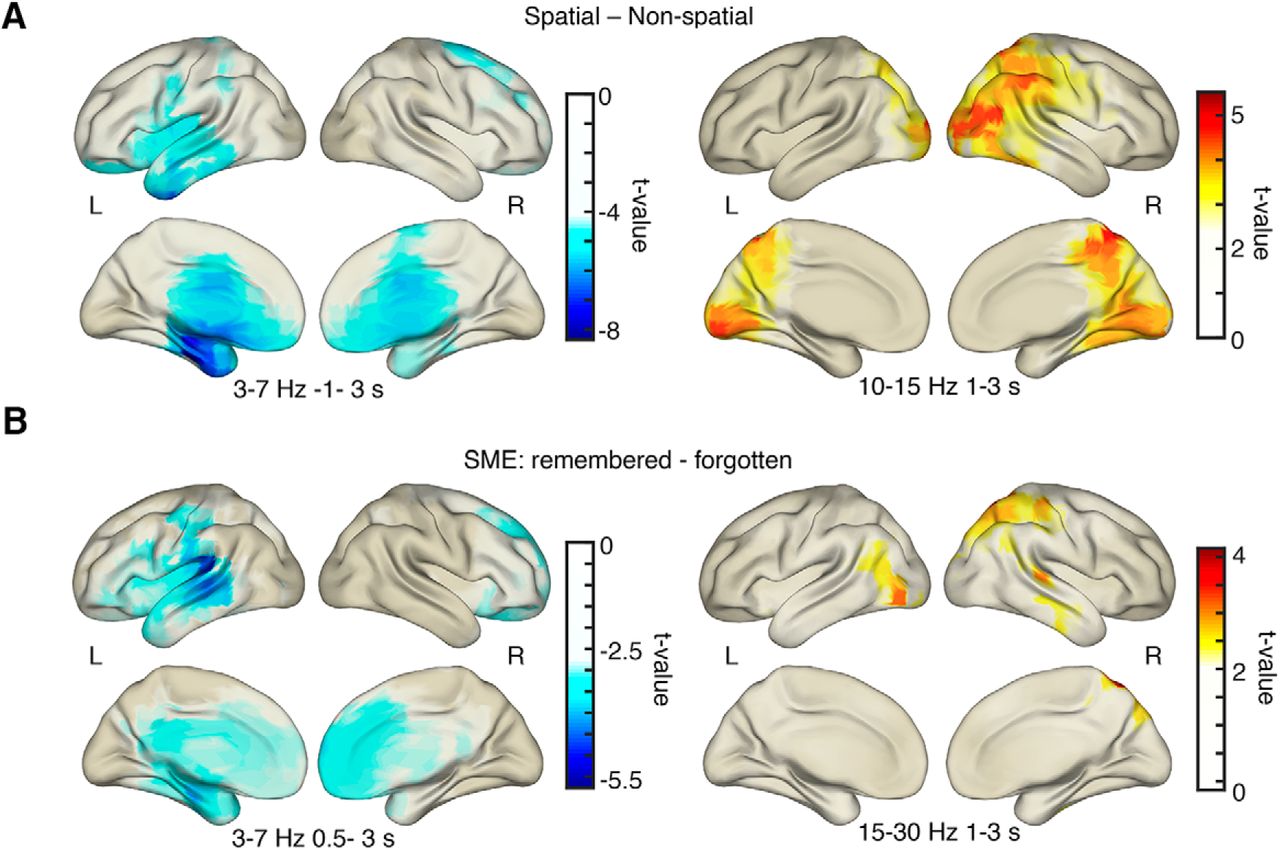
EEG source localization results. A, Decreases in theta power for spatial processing were strongest in anterior MTL areas, Alpha/beta power increases were strongest in occipital–parietal–temporal areas for spatial vs nonspatial processing. B, Theta power decreases during successful memory formation were strongest in left temporal areas. Increases in alpha/beta power during memory formation were found in occipital–parietal areas. All plots are thresholded at half-maximum t value.
- Figure 7.
Theta EEG power and fMRI beta weights of the left MTL ROI. Theta power (3–7 Hz, −1 to 3 s) and beta weights were averaged for each condition for all voxels included in the anatomically defined left MTL ROI. Theta power decreases show the reversed pattern of BOLD increases in left MTL regions. Error bars show the SEM.


Tables
hs BA Size MNI coordinates t x y z Spatial > nonspatial Parahippocampal gyrus L 36 127 −24 −37 −11 9.15 L −24 −31 −20 5.41 Parahippocampal gyrus R 36 112 27 −37 −11 8.32 positive SME: remembered > forgotten Parahippocampal gyrus L 35 16 −21 −34 −11 3.79 L 35 −24 −28 −20 3.38 BA, Brodmann area; hs, hemisphere; L, Left; R, right.
hs BA Size MNI coordinates t x y z Spatial > nonspatial Posterior cingulate L 30 1999 −15 −58 16 12.64 Parahippocampal gyrus L 36 −24 −40 −11 9.67 Posterior cingulate R 30 12 −52 16 9.56 Superior occipital gyrus L 19 186 −36 −76 34 8.78 Superior temporal gyrus L 22 −45 −55 22 3.91 Middle temporal gyrus L 39 −54 −67 22 3.59 Parahippocampal gyrus R 36 206 27 −37 −14 8.54 Middle temporal gyrus R 39 215 42 −73 34 6.89 Superior temporal gyrus R 39 57 −58 22 5.19 Middle temporal gyrus R 39 48 −67 25 4.92 Nonspatial > spatial Middle frontal gyrus R 9 102 30 47 28 4.23 R 9 45 29 22 3.76 Positive SME: remembered > forgotten Insula L 13 608 −30 −7 19 5.77 Caudate body L 21 5 13 5.68 Putamen L −24 −4 1 5.58 Middle frontal gyrus L 6 141 −24 23 52 4.83 L 6 −28 17 58 4.61 L 6 −36 17 46 4.49 Middle temporal gyrus L 22 86 −51 −43 −2 4.56 L 21 −60 −19 −5 4.01 Superior temporal gyrus L 22 −48 −25 −5 3.77 Middle temporal gyrus L 39 114 −42 −73 31 4.44 Superior temporal gyrus L 39 −48 −52 31 4.41 Inferior frontal gyrus L 44 135 −51 14 19 4.37 L 13 −45 32 1 4.36 L −45 47 −5 3.93 Negative SME: forgotten > remembered Lingual gyrus L 18 2237 −12 −70 −2 7.25 Posterior cingulate L 30 −3 −70 16 6.98 Cuneus R 18 9 −73 25 6.67 Inferior parietal lobule R 40 355 42 −46 46 4.94 Superior parietal lobule R 7 33 −52 49 4.41 Supramarginal gyrus R 40 57 −43 37 4.41 Middle frontal gyrus R 10 96 30 62 13 4.36 R 8 39 35 34 4.08 Superior frontal gyrus R 9 27 53 34 3.67 Insula R 13 68 36 26 1 4.36 L, Left; R, right.
Figure/section Description/data structure Test Statistical value p value Behavioral analysis Methods: task design Number of trials remembered out of sequence in EEG: average of out of sequence trials spatial vs nonspatial Paired t test t(20) = 0.4 0.68 Number of trials remembered out of sequence in fMRI average of out of sequence trials spatial vs nonspatial Paired t test t(22) = −0.168 0. 87 Results: Behavioral Performance and Figure 2 Memory performance EEG: relative number of remembered items spatial vs nonspatial Paired t test t(20) = 10.23 0.0001 Memory performance fMRI: relative number of remembered items spatial vs nonspatial Paired t test t(22) = 6.26 0.0001 EEG analysis Results: EEG scalp level and Figure 3A FOI analysis theta band: SME: forgotten vs remembered trials, 1–10 Hz, −1 to 3 s 3D cluster permutation statistic One sig. neg. cluster tsum = −55,635 pcorr = 0.03 FOI analysis Theta band: condition difference, spatial vs Nonspatial, 1–10 Hz, −1 to 3 s 3D cluster permutation statistic One sig. neg. cluster tsum = −287,990 pcorr = 0.002 FOI analysis Theta band: Interaction SME spatial vs SME nonspatial, 1–10 Hz, −1 to 3 s 3D cluster permutation statistic no sig. cluster Min. pcorr = 0.68 FOI analysis theta band: spatial remembered vs nonspatial remembered, 1–10 Hz, −1 to 3 s 3D cluster permutation statistic One sig. neg. cluster Tsum = −158380 pcorr = 0.002 Results: EEG scalp level and Figure 3B SME: forgotten vs remembered trials, 1–30 Hz, −1 to 3 s Sliding cluster permutation statistic Coherent sig. bins in alpha/beta band Condition difference: spatial vs nonspatial, 1–30 Hz, −1 to 3 s Sliding cluster permutation statistic Coherent sig. bins in alpha/beta band Interaction: SME spatial vs SME nonspatial, 1–30 Hz, −1 to 3 s Sliding cluster permutation statistic no coherent sig. bins (min. 3 time × 4 frequency bins) Results: EEG scalp level and Figure 3C Topoplot: SME theta, 3–7 Hz, 0.5–3 s 1D cluster permutation statistic One sig. neg. cluster tsum = −75.85 pcorr = 0.004 Topoplot: SME alpha/beta, 15–30 Hz, 1–3 s 1D cluster permutation statistic Two sig. pos. clusters tsum = 29.60 and 19.34 pcorr = 0.012, pcorr = 0.042 Topoplot: condition difference theta 3–7 Hz, −1 to 3 s 1D cluster permutation statistic One sig. neg. cluster tsum = −239.30 pcorr = 0.002 Topoplot: condition difference alpha/beta, 10–15 Hz, 1–3 s 1D cluster permutation statistic One sig. pos. cluster tsum = 104.43 pcorr = 0.012 Results: EEG source analysis and Figure 5 Virtual electrode statistic: SME theta in right MTL, 2–10 Hz, −1 to 3 s 1D cluster permutation statistic No sig. cluster Min. pcorr = 0.20 Virtual electrode statistic: SME theta in left MTL, 2–10 Hz, −1 to 3 s 1D cluster permutation statistic One sig. neg. cluster tsum = −246.33 pcorr = 0.014 Virtual electrode statistic: condition difference in right MTL, 2–10 Hz, −1 to 3 s 1D cluster permutation statistic Two sig. neg. clusters Tsum = −588.36 and −562.18 pcorr = 0.006, pcorr = 0.006 Virtual electrode statistic: condition difference in left MTL, 2–10 Hz, −1 to 3 s 1D cluster permutation statistic Two sig. neg. clusters tsum = −682.99 and −516.30 pcorr = 0.002, pcorr = 0.004 Results: EEG source analysis and Figure 6 Source statistic: SME theta 1D cluster permutation statistic One sig. neg. cluster tsum = −3140.3 pcorr = 0.003 Sourcestatistic: SME alpha/beta 1D cluster permutation statistic One sig. pos. cluster tsum = 433.72 pcorr = 0.054 Sourcestatistic: condition difference alpha/beta 1D cluster permutation statistic One sig. pos. cluster tsum = 2692.8 pcorr = 0.0034 EEG and fMRI ROI analysis Results: EEG source analysis and Figure 7 SME: forgotten vs remembered, average theta power MTL 3–7 Hz, −1 to 3 s 2 × 2 ANOVA, main effect F(1,20) = 10.08 0.005 condition difference: spatial vs nonspatial, average theta power lMTL 3–7 Hz, −1 to 3 s 2 × 2 ANOVA, main effect F(1,20) = 43.87 <0.0001 Interaction: SME spatial vs SME nonspatial, average theta power lMTL 3–7 Hz, −1 to 3 s 2 × 2 ANOVA, interaction effect F(1,20) = 0.001 0.97 Results: EEG source analysis and Figure 7 SME: forgotten vs remembered, average beta weights MTL 2 × 2 ANOVA, main effect F(1,22) = 10.20 0.004 condition difference: spatial vs nonspatial, average beta weights MTL 2 × 2 ANOVA, main effect F(1,22) = 16.23 0.001 Interaction: SME spatial vs SME nonspatial average beta weights MTL 2 × 2 ANOVA, interaction effect F(1,22) = 2.84 0.13 Min., Minimum; neg., negative; pos., positive; sig., significant.
In this issue


