

Article Figures & Data
Figures
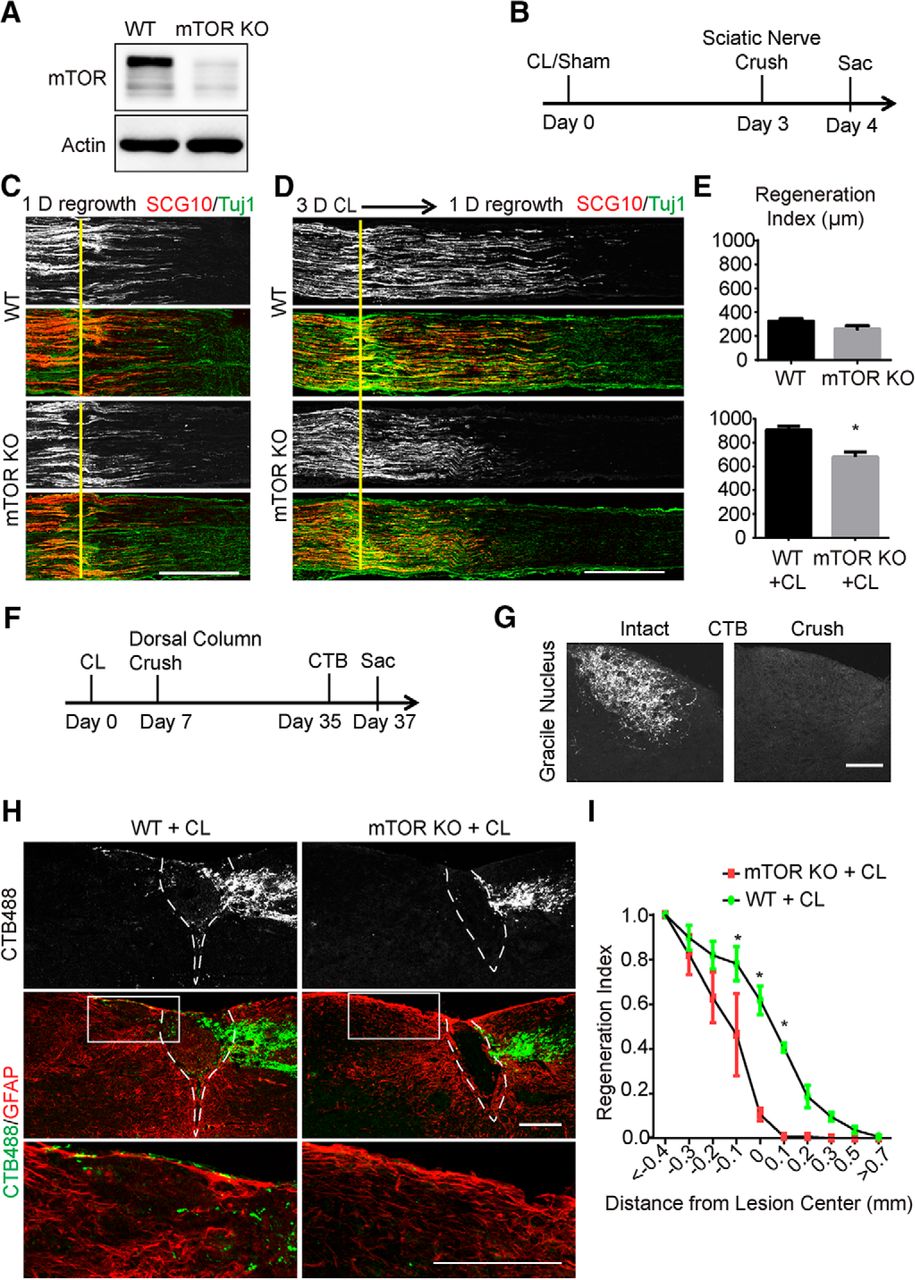
- Figure 1.
Sensory axon regeneration induced by a conditioning lesion is inhibited by mTOR deletion in DRG neurons. A, DRG lysates were analyzed by Western blot to confirm loss of mTOR in conditional knockout mice. B, Diagram of the experimental procedure assessing the peripheral nerve crush. C, D, Sections of sciatic nerves from WT and mTOR KO mice 1 d after crush, with sham (C) or a 3-d CL (D). SCG10 (gray and red) staining was used to label the regenerating sensory axons and Tuj1 (green) staining was used to mark the sciatic nerve. Scale bar, 500 μm. E, Quantifications of peripheral axon regeneration. Student’s t test. *p < 0.05, four to six mice in each group. F, Diagram of the experimental procedure assessing the ascending sensory axon regeneration after CL. G, Sections of gracile nuclei from mice with or without crush to verify the completeness of the dorsal column crush lesion, with ascending sensory axons traced with CTB (gray). Scale bar, 100 μm. H, Sagittal sections of the spinal cord dorsal columns containing CTB-labeled sensory axons from WT and mTOR KO mice 4 weeks after spinal cord injury. CL was performed 1 week before the spinal cord injury. CTB488 (gray and green) was injected into the sciatic nerve to trace the ascending sensory axons from the L4–6 DRGs. White dashed lines mark the margin of the lesion site indicated by GFAP staining (red). The lower panels show the enlarged boxed area. Scale bar, 200 μm. I, Quantification of traced axons at different distances to the lesion center. Two-way ANOVA followed by Bonferroni multiple comparisons test. *p < 0.005, four to eight mice in each group.
- Figure 2.
Sensory axon regeneration induced by CL is inhibited by Raptor deletion. A, DRG lysates were analyzed by Western blot to confirm loss of Raptor in the conditional knockout mice. B, DRG sections of WT and Raptor KO mice with immunostaining by Raptor (red) and Tuj1 (green) antibodies. Scale bar, 100 μm. C, D, Sections of sciatic nerves from WT and Raptor KO mice 1 day after crush, with sham (C) or 3-d CL (D). SCG10 (gray and red) staining was used to label the regenerating sensory axons and Tuj1 (green) staining was used to mark the sciatic nerve. Scale bar, 500 μm. E, Quantifications of peripheral axon regeneration. Student’s t test. *p < 0.05, five to seven mice in each group. F, Sagittal sections of spinal cord dorsal columns containing CTB-labeled sensory axons from WT and Raptor KO mice 4 weeks after spinal cord injury. CL was performed 1 week before spinal cord injury. CTB488 (gray and green) was injected into the sciatic nerve to trace the ascending sensory axons from the L4–6 DRGs. White dashed lines mark the margin of the lesion site indicated by GFAP staining (red). The lower panels show the enlarged boxed area. Scale bar, 200 μm. G, Quantification of ascending sensory axon regeneration. Two-way ANOVA followed by Bonferroni multiple comparisons test. *p < 0.005, seven mice in each group.
- Figure 3.
The effect of Rictor deletion on sensory axon regeneration. A, DRG lysates were analyzed by Western blot to confirm loss of Rictor in the conditional knockout mice. B, C, Sections of sciatic nerves from WT and Rictor KO mice 1 d after crush, with sham (B) or a 3-d CL (C). SCG10 (gray and red) staining was used to label the regenerating sensory axons and Tuj1 (green) staining was used to mark the sciatic nerve. Scale bar, 500 μm. D, Quantifications of peripheral axon regeneration. Student’s t test, four to five mice in each group. E, Sagittal sections of spinal cord dorsal columns containing CTB-labeled sensory axons from WT and Rictor KO mice at 4 weeks after spinal cord injury. CL was performed 1 week before spinal cord injury. CTB488 (gray and green) was injected into the sciatic nerve to trace the ascending sensory axons from the L4–6 DRGs. White dashed lines mark the margin of the lesion site indicated by GFAP staining (red). The lower panels show the enlarged boxed area. Scale bar, 200 μm. F, Quantification of ascending sensory axon regeneration. Two-way ANOVA followed by Bonferroni multiple comparisons test. *p < 0.005, seven mice in each group.
- Figure 4.
Deletion of mTOR, Raptor, or Rictor does not affect the axon retraction of conditioned sensory axons shortly after dorsal column crush. A, Diagram of the experimental procedure assessing the axon retraction at 2 days after spinal cord injury. B, Representative sagittal sections of spinal cord dorsal columns containing CTB-labeled sensory axons from WT, mTOR, Raptor, and Rictor KO mice at 2 d after spinal cord injury. CL was performed 1 week before the spinal cord injury. CTB488 (green) was injected into the sciatic nerve to trace the ascending sensory axons from the L4–6 DRGs. White dashed lines mark the margin of the lesion site indicated by GFAP staining (red). Scale bar, 200 μm. Note that in all groups, some CTB-labeled sensory axons do not retract from the lesion site.
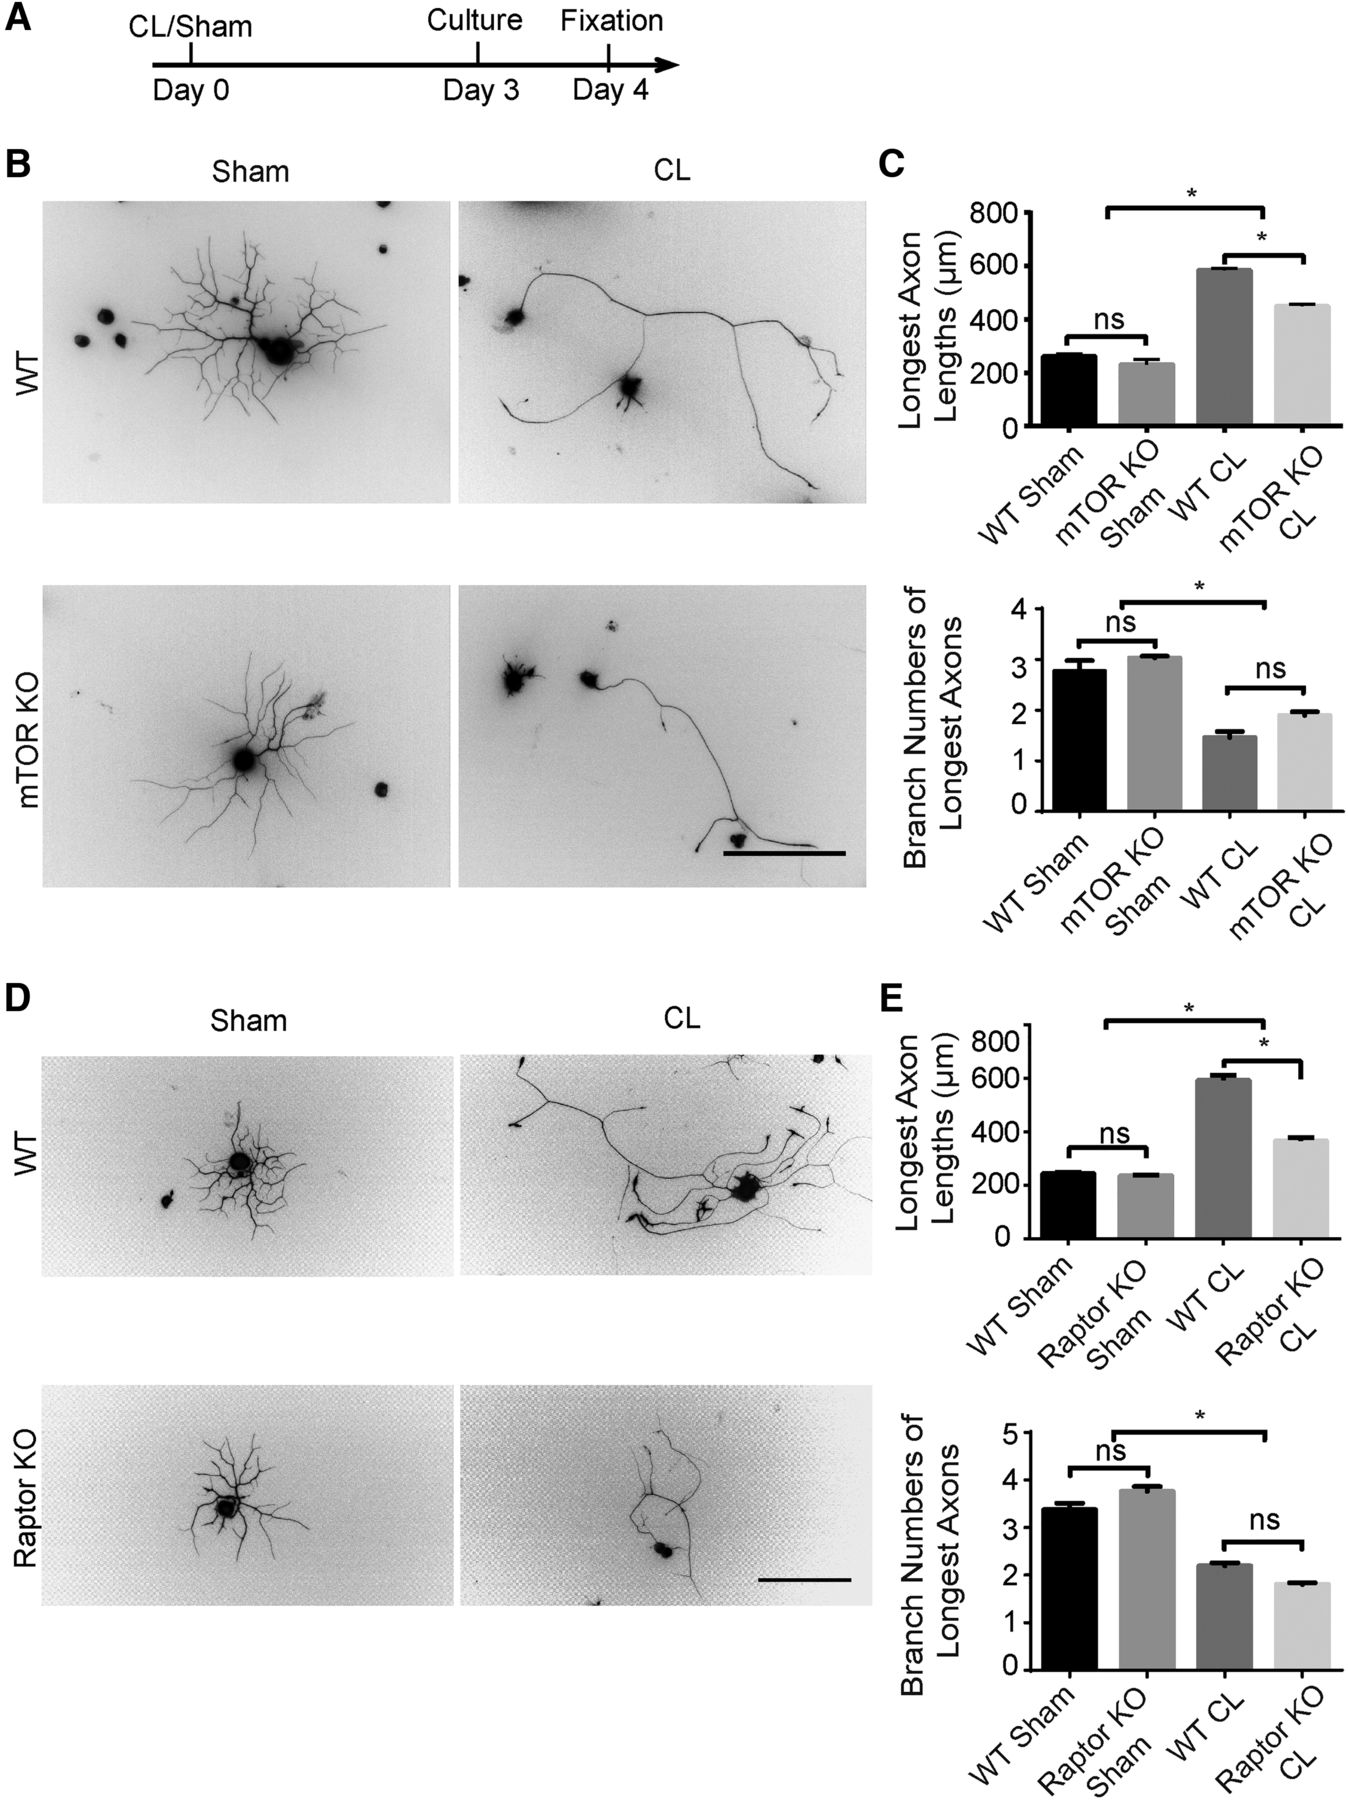
- Figure 5.
mTORC1 inactivation suppresses the conditioning lesion effect in vitro. A, Diagram of the experimental procedure. B, Primary culture of DRG neurons for 24 h with sham or CL in WT and mTOR KO mice. DRG neurons were stained with Tuj1 antibody. Scale bar, 200 μm. C, Quantification of axon lengths and branch numbers. One-way ANOVA followed by Tukey’s test. *p < 0.05, n = 3 mice. D, Primary culture of DRG neurons for 24 h with sham or CL in WT and Raptor KO mice. Scale bar, 200 μm. E, Quantification of axon lengths and branch numbers. One-way ANOVA followed by Tukey’s test. *p < 0.05; ns, not significant; n = 3 mice.
- Figure 6.
mTOR activity in DRGs during development and after injuries. A, Sections of DRGs from WT mice at postnatal day 2 (P2), P7, and adult, stained with p-S6 (green) and Tuj1 (red) antibodies. Scale bar, 200 μm. B, DRG sections of WT mice with sham surgery, dorsal column lesion (DCL), or peripheral CL, with p-S6 (red) and Tuj1 (green) staining. p-S6 signaling was upregulated 3 d after CL but not DCL. Scale bar, 100 μm. C, DRG sections of WT mice with sham surgery, DCL, or CL, with p-4EBP1 (red) and Tuj1 (green) staining. p-4EBP1 signaling was dramatically upregulated 3 d after CL but not DCL. Scale bar, 100 μm. D, Quantification of percentages of the p-4EBP1+ DRGs. One-way ANOVA followed by Tukey’s multiple comparisons test. *p < 0.05; ns, not significant; n = 3.
- Figure 7.
mTOR signaling in DRG neurons of mTOR, Raptor, and Rictor KO mice. A, Sections of DRGs from WT, mTOR, Raptor, and Rictor KO mice, with p-mTOR (red) and Tuj1 (green) staining. Scale bar, 100 μm. B, Sections of DRGs from WT, mTOR, Raptor, and Rictor KO mice with or without CL, with p-mTOR (red) and Tuj1 (green) staining. p-S6 signal was eliminated in mTOR or Raptor KO mice. Scale bar, 100 μm. C, Sections of DRGs from WT and Raptor KO mice with or without CL, with p-4EBP1 (red) and Tuj1 (green) staining. Scale bar, 100 μm. D, Quantification of percentages of p-4EBP1+ DRG neurons in three groups of mice. One-way ANOVA followed by Tukey’s test. *p < 0.05, three mice in each group. E, Sections of DRGs from WT, mTOR, Raptor, and Rictor KO mice, with p-AKT473 (red) and Tuj1 (green) staining. Scale bar, 100 μm.
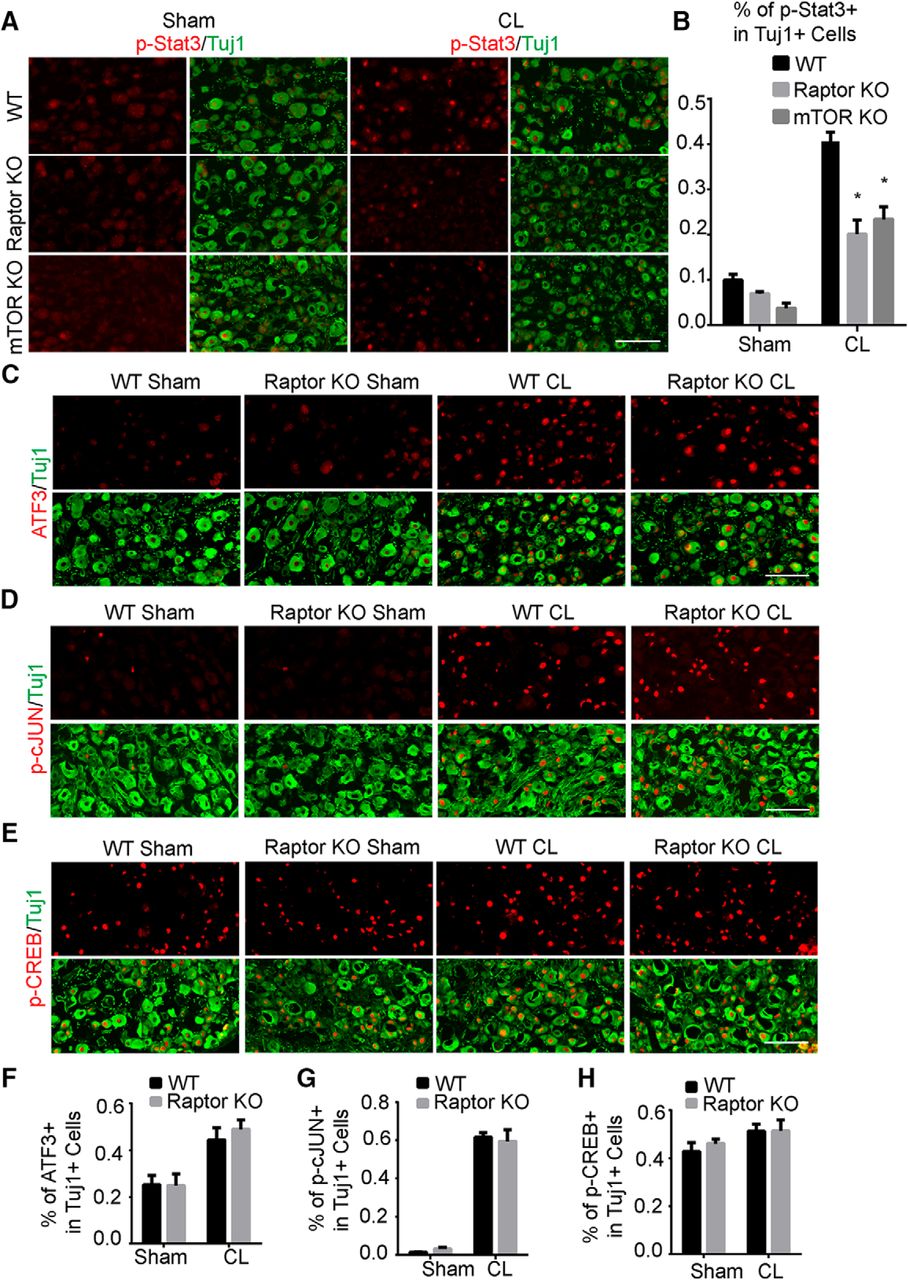
- Figure 8.
mTORC1 inactivation suppresses Stat3 signaling in DRG neurons induced by a conditioning lesion. A, Sections of DRGs from WT, mTOR, and Raptor KO mice with or without CL, with p-Stat3 (red) and Tuj1 (green) staining. mTOR or Raptor deletion inhibited p-Stat3 at 3 d after CL. B, Quantification of percentages of p-Stat3+ DRG neurons in three groups of mice. Two-way ANOVA followed by Tukey’s test. *p < 0.05, three to five mice in each group. C–E, Sections of DRGs from WT and Raptor KO mice with or without CL, with ATF3 (C), p-cJUN (D), and p-CREB (E) staining. Tuj1 staining was used to label DRG neurons. F–H, Quantifications of percentages of ATF3+ (F), p-cJUN+ (G), and p-CREB+ (H) DRG neurons in three groups of mice. Two-way ANOVA followed by Tukey’s test. *p < 0.05, three to five mice in each group. Scale bar, 100 μm.
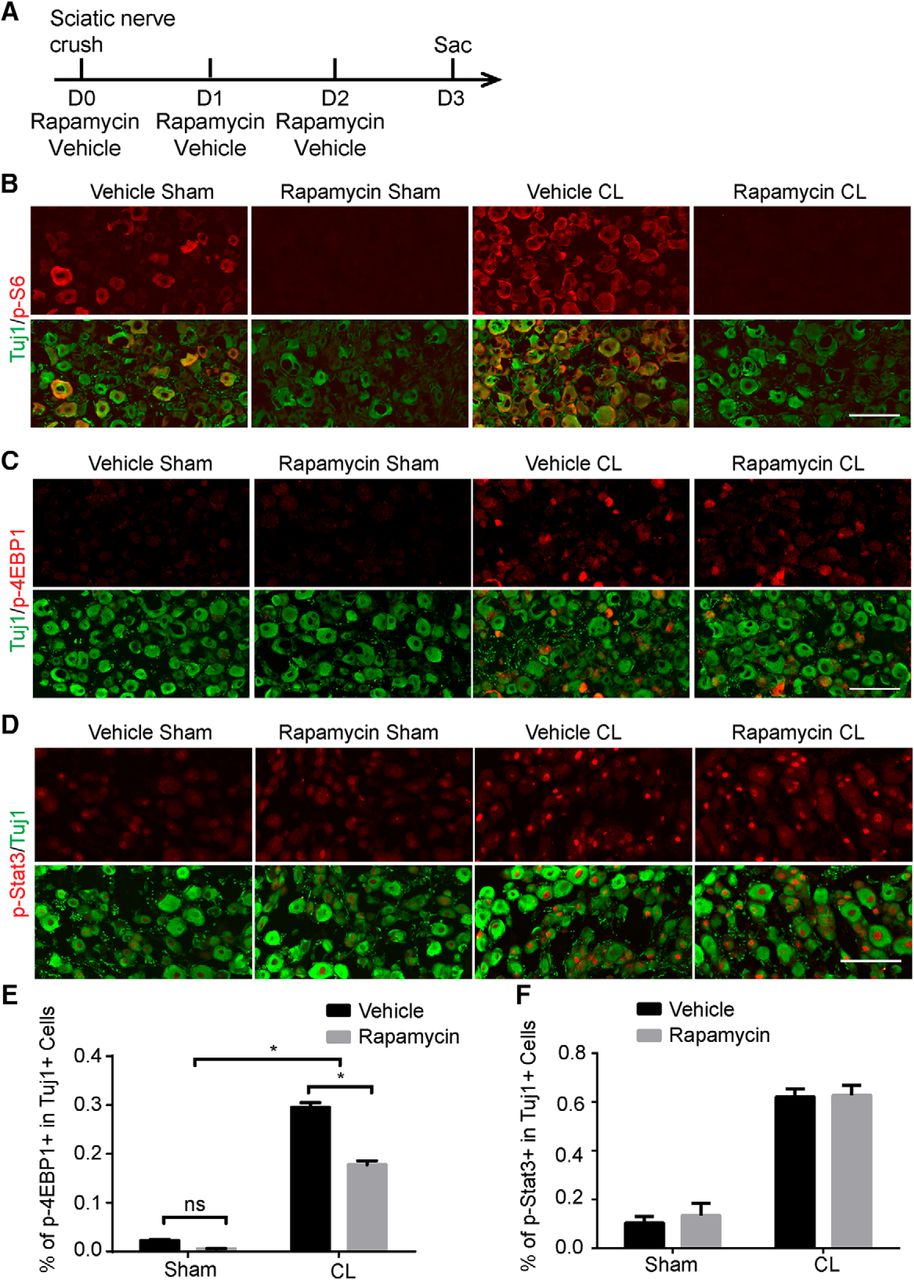
- Figure 9.
Injury-induced Stat3 signaling is not affected by rapamycin. A, Diagram of the experimental procedure. B–D, Sections of DRGs from WT mice with or without CL, with p-S6 (B), p-4EBP1 (C), or p-Stat3 (D) staining (red). Mice were treated with vehicle or rapamycin. Tuj1 staining (green) was used to label DRG neurons. Scale bar, 100 μm. E, F, Quantifications of p-4EBP1+ (E) or p-Stat3+ (F) DRG neurons after vehicle or rapamycin treatment. Two-way ANOVA followed by Tukey’s test. *p < 0.05, n = 5.


In this issue


