

Article Figures & Data
Figures
- Figure 1.
Schematic of experimental design, reinforced presses across the 14 d of self-administration training, and schematic of different metrics of DA release kinetics. A, Points in the release kinetics in relation to the peak DA release (i.e., point of greatest [DA] after stimulation). Half peak is the point at exactly half of peak concentration, Return to baseline (BL) is the point at which the [DA] was within a 95% confidence interval of the baseline, and T20 and T80 reflect 20% and 80% decrease in [DA] from peak, respectively. AUC was estimated by summing the [DA] in each 100-ms bin between stimulation and return to BL. B, Latency measures derived from the points of release and reuptake from A. Latency to peak, FWHH (i.e., latency from stimulation to half peak), and return to BL latency are relative to stimulation, whereas T20 and T80 latencies are relative to peak. C–E, Rates of change relative to points during release. Release velocity is the rate of increase in [DA] from stimulation to peak, Vmax is the rate of uptake between the peak and T20, and slope is the rate of uptake between T20 and T80.
- Figure 2.
Placement of electrodes during recording in controls (top) or cocaine (bottom) rats. Black circles, core; gray circles, shell.
- Figure 3.
Distribution of peak [DA] amplitude from stimulation trials in the NAc core (control, black; cocaine, blue) and NAc shell (control, gray; cocaine, red). Peak [DA] responses for each stimulation were binned by 50-ms epochs from 0 to 1200 nm, while all stimulations that were greater than 1200 nm represented the final bin. Proportion reflected the number of stimulations in that bin as a proportion of all stimulations from that group. **Control core vs. control shell; §control core vs. cocaine core; @control shell vs. cocaine shell; p < 0.001 for relevant χ2.
- Figure 4.
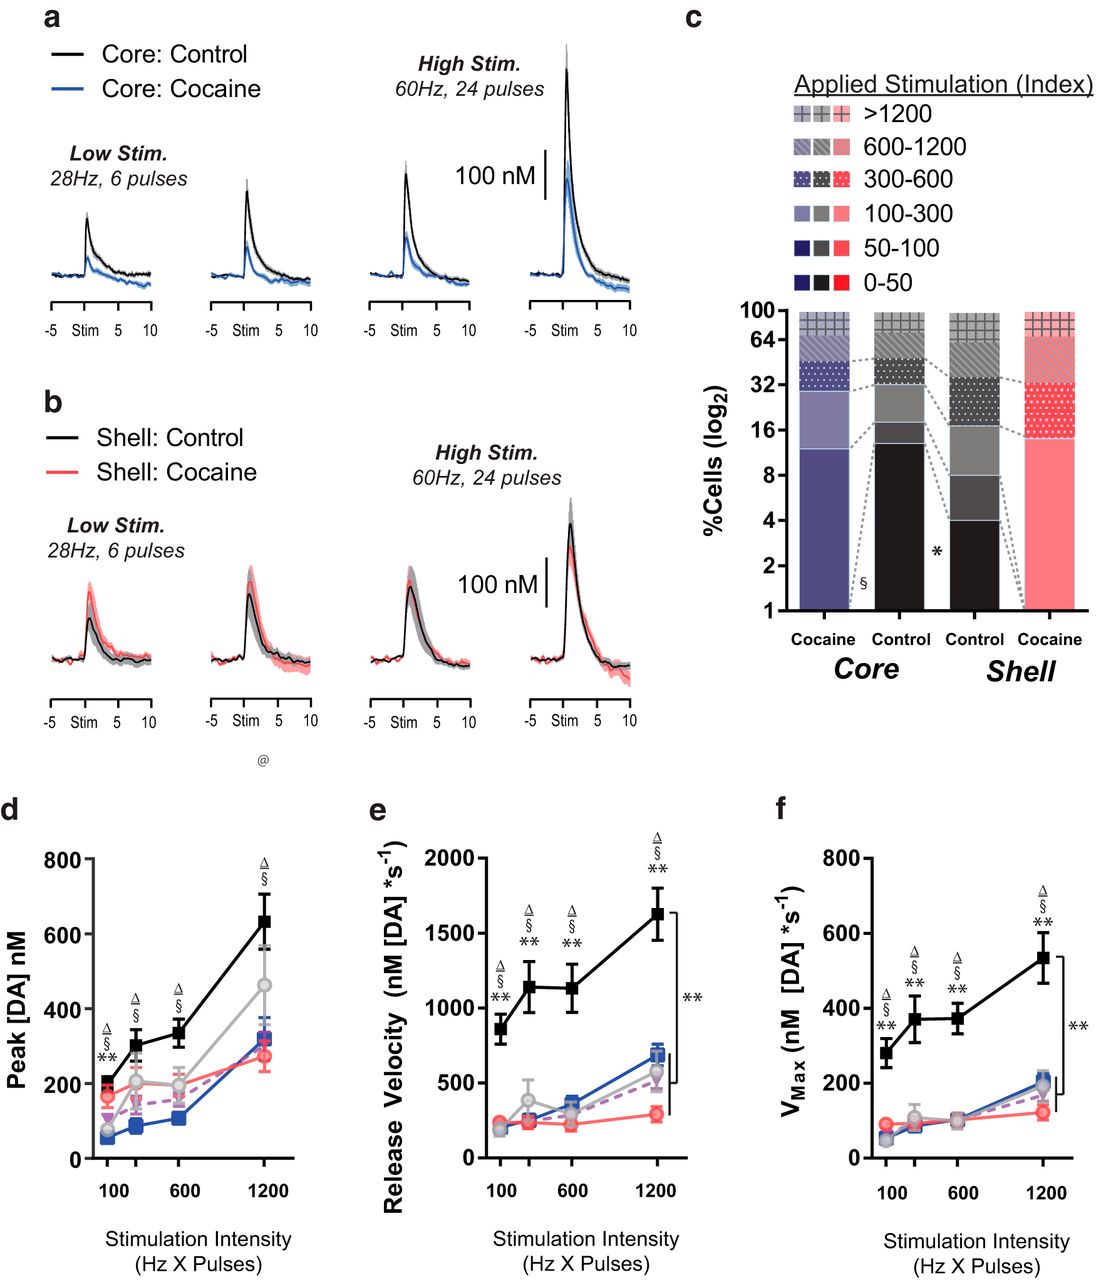
Representative color plots of stimulated DA release in NAc core (A and B) and NAc shell (C and D). E, Overlapped traces of DA elicited by electrical stimulation in core and shell of controls and cocaine-experienced subjects from the representative color plots in A–D.
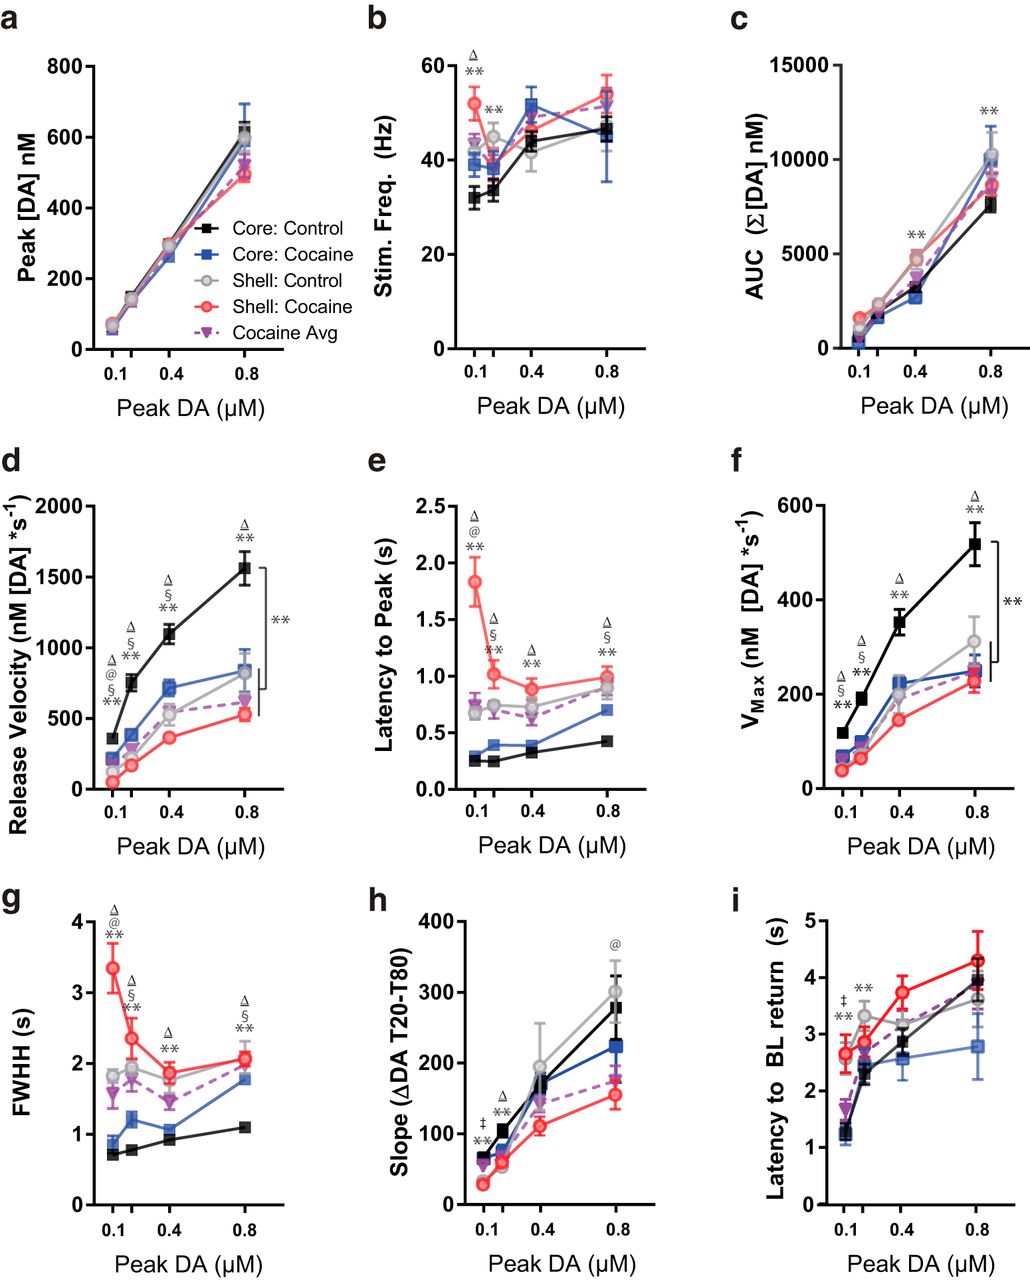
- Figure 5.
Kinetic factors of DA release aligned by peak [DA] in control core (black squares), cocaine core (blue squares), control shell (gray circles), and cocaine shell (red circles) recordings. **Control core vs. control shell; Δcontrol core vs. both cocaines; §control core vs. cocaine core; @control shell vs. cocaine shell; ‡control Shell vs. both cocaines; p < 0.01 (Bonferroni-corrected α for multiple comparisons).
- Figure 6.
Average phasic DA release in the NAc core (A) and shell (B) of controls (black/gray) and cocaine self-administering rats (blue/red) in stimulation index–aligned bins. C, For each drug group and region, the proportion of cells (of all observations) in each stimulation index bin. Note log2 scale used to show the loss specifically of the low stimulation index observations in the cocaine groups. Peak [DA] (D), rise velocity (E), and Vmax (F) for treatment groups across stimulation intensity bins. **Control core vs. control shell; Δcontrol core vs. both cocaines; §control core vs. cocaine core; @control shell vs. cocaine shell; ‡control shell vs. both cocaines; p < 0.01 (Bonferroni-corrected α for multiple comparisons).


Tables
p-values (t test) Core (control) vs. shell (control) Core (control) vs. core (cocaine) Shell (control) vs. shell (cocaine) Peak [DA], µm 0. 1 0.2 0.4 0.8 0.1 0.2 0.4 0.8 0.1 0.2 0.4 0.8 Peak 0.87 0.02 0.97 0.32 0.03 0.001* 0.07 0.66 0.81 0.42 0.94 0.03 Frequency 0.007* 0.001* 0.54 0.91 0.04 0.28 0.10 0.85 0.03 0.20 0.43 0.34 AUC 0.02 0.05 0.001* 0.008* 0.06 0.12 0.11 0.09 0.10 0.52 0.88 0.24 Rise velocity <0.0001* <0.0001* <0.0001* 0.004* 0.002* <0.0001* 0.008* 0.07 0.0004* 0.06 0.06 0.07 Latency peak <0.0001* <0.0001* <0.0001* <0.0001* 0.27 <0.0001* 0.12 0.003* <0.0001* 0.02 0.22 0.53 Vmax <0.0001* <0.0001* <0.0001* 0.01 0.0008* <0.0001* 0.02 0.08 0.63 0.52 0.53 0.36 FWHH <0.0001* <0.0001* <0.0001* <0.0001* 0.28 <0.0001* 0.15 0.003* <0.0001* 0.14 0.67 0.93 Slope (T20–T80) <0.0001* <0.0001* 0.52 0.80 0.84 0.05 0.98 0.98 0.41 0.37 0.21 0.009* Baseline return 0.0002* 0.002* 0.60 0.63 0.84 0.83 0.56 0.34 0.87 0.23 0.34 0.35 T20 latency <0.0001* <0.0001* <0.0001* <0.0001* 0.16 <0.0001* 0.12 <0.0001* <0.0001* 0.07 0.69 0.89 T80 latency <0.0001* <0.0001* 0.02 0.85 0.91 0.10 0.80 0.40 0.0006* 0.87 0.41 0.08 Significance (p-value) of pairwise t tests at each peak bin (low [<0.1 μm DA], medium-low [0.1–0.2 μm DA], medium-high [0.2–0.4 μm DA], and high [0.4–0.8 μm DA]) between core control and shell control (left), core control and core cocaine (middle), and shell control and shell cocaine (right). Bold italics: *p < 0.01 (significant after Bonferroni correction); italics only: p < 0.05 (not significant after Bonferroni correction).
p-values (t test) Core (control) vs. Shell (control) Core (control) vs. both cocaines Shell (control) vs. both cocaines Peak [DA], µm 0. 1 0.2 0.4 0.8 0.1 0.2 0.4 0.8 0.1 0.2 0.4 0.8 Peak 0.87 0.23 0.97 0.32 0.11 <0.0001* 0.28 0.26 0.86 0.24 0.49 0.13 Frequency 0.007* 0.002* 0.54 0.91 0.001* 0.12 0.18 0.34 0.66 0.10 0.13 0.53 AUC 0.02 0.03 0.001* 0.008* 0.98 0.72 0.20 0.07 0.05 0.04 0.07 0.33 Rise velocity <0.0001* <0.0001* <0.0001* 0.004* <0.0001* <0.0001* <0.0001* <0.0001* 0.07 0.08 0.82 0.17 Latency peak <0.0001* <0.0001* <0.0001* <0.0001* 0.0004* <0.0001* <0.0001* <0.0001* 0.67 0.70 0.37 0.96 Vmax <0.0001* <0.0001* <0.0001* 0.01 <0.0001* <0.0001* <0.0001* 0.0008* 0.05 0.20 0.48 0.35 FWHH <0.0001* <0.0001* <0.0001* <0.0001* 0.0004* <0.0001* <0.0001* <0.0001* 0.32 0.47 0.12 0.64 Slope (T20–T80) <0.0001* <0.0001* 0.52 0.80 0.16 0.001* 0.10 0.19 0.003* 0.08 0.27 0.01 Baseline return 0.0002* 0.002* 0.60 0.63 0.16 0.30 0.49 0.87 0.007* 0.05 0.99 0.70 T20 latency <0.0001* <0.0001* <0.0001* <0.0001* 0.0002* <0.0001* <0.0001* <0.0001* 0.62 0.50 0.07 0.71 T80 latency <0.0001* 0.0006* 0.02 0.85 0.0008* 0.0001* 0.007* 0.001* 0.06 0.25 0.27 0.16 Significance (p-value) of pairwise t tests at each peak bin (low [<0.1 μm DA], medium-low [0.1–0.2 μm DA], medium-high [0.2–0.4 μm DA], and high [0.4–0.8 μm DA]) between core control and shell control (left; repeated from Table 1), core control and average of both cocaine groups (core and shell; middle), and shell control average of both cocaine groups (core and shell; right). Bold italics: *p < 0.01 (significant after Bonferroni correction); italics only: p < 0.05 (not significant after Bonferroni correction).
p-values (t test) Core (control) vs. Shell (control) Core (control) vs. Core (cocaine) Shell (control) vs. Shell (cocaine) Stimulation index 100 300 600 1200 100 300 600 1200 100 300 600 1200 Peak [DA] 0.002* 0.96 0.02 0.48 <0.0001* 0.003* 0.0006* 0.009* 0.02 0.96 0.99 0.14 Frequency 0.97 0.002* 0.46 1.00 0.24 0.73 0.87 0.14 0.12 0.37 0.76 1.00 AUC 0.01 0.98 0.21 0.45 0.0006* 0.003* 0.002* 0.02 0.06 0.70 0.83 0.14 Rise velocity 0.0006* 0.006* 0.0003* <0.0001* 0.0002* 0.0002* 0.006* 0.0006* 0.31 0.42 0.49 0.14 Latency peak 0.002* <0.0001* <0.0001* <0.0001* 0.45 0.36 0.61 0.11 0.07 0.002* 0.005* 0.01 Vmax 0.002* 0.003* <0.0001* 0.0003* 0.001* 0.001* 0.0002* 0.004* 0.01* 0.78 0.78 0.16 FWHH <0.0001* <0.0001* <0.0001* <0.0001* 0.15 0.52 0.59 0.09 0.89 0.05 0.003* 0.13 Slope (T20–T80) 0.001* 0.81 0.004* 0.26 0.009* 0.03 0.002* 0.09 0.004* 0.77 0.68 0.10 Baseline return 0.26 0.74 0.96 0.91 0.07 0.01 0.11 0.03 0.56 0.28 0.10 0.88 T20 latency <0.0001* <0.0001* <0.0001* <0.0001* 0.02 0.32 0.09 0.07 0.30 0.10 0.28 0.31 T80 latency 0.006* 0.25 0.02 0.0004* 0.53 0.06 0.56 0.09 0.21 0.72 0.66 0.18 Significance (p-value) of pairwise t tests at each stimulation index bin (low [100–300], medium-low [300–600], medium-high [600–1200], and high [>1200]) between core control and shell control (left), core control and core cocaine (middle), and shell control and shell cocaine (right). Bold italics: *p < 0.01 (significant after Bonferroni correction); italics only: p < 0.05 (not significant after Bonferroni correction).
p-values (t test) Core (control) vs. shell (control) Core (control) vs. both cocaines Shell (control) vs. both cocaines Stimulation index 100 300 600 1200 100 300 600 1200 100 300 600 1200 Peak [DA] 0.002* 0.96 0.02 0.48 0.0008* 0.003* 0.0001* 0.0003* 0.36 0.37 0.41 0.07 Frequency 0.97 0.002* 0.46 1.00 0.06 0.36 0.90 0.26 0.21 0.54 0.55 0.36 AUC 0.01 0.98 0.21 0.45 0.02 0.03 0.007* 0.003* 0.51 0.44 0.31 0.02 Rise velocity 0.0006* 0.006* 0.0003* <0.0001* <0.0001* <0.0001* <0.0001* <0.0001* 0.43 0.27 0.92 0.69 Latency peak 0.002* <0.0001* <0.0001* <0.0001* 0.005* 0.002* 0.0005* <0.0001* 0.92 0.52 0.33 0.10 Vmax 0.002* 0.003* <0.0001* 0.0003* 0.0002* <0.0001* <0.0001* <0.0001* 0.07 0.55 0.79 0.30 FWHH <0.0001* <0.0001* <0.0001* <0.0001* 0.02 0.001* <0.0001* <0.0001* 0.42 0.74 0.79 0.02 Slope (T20–T80) 0.001* 0.81 0.004* 0.26 0.002* 0.006* <0.0001* 0.001* 0.007* 0.59 0.70 0.21 Baseline return 0.26 0.74 0.96 0.91 0.99 0.30 0.60 0.39 0.25 0.28 0.74 0.03 T20 latency <0.0001* <0.0001* <0.0001* <0.0001* 0.0004* 0.0007* <0.0001* <0.0001* 0.09 0.70 0.60 0.0003* T80 latency 0.006* 0.25 0.02 0.0004* 0.83 0.51 0.05 0.23 0.02 0.10 0.75 0.07 Significance (p-value) of pairwise t tests at each stimulation index bin (low [100–300], medium-low [300–600], medium-high [600–1200], and high [>1200]) between core control and shell control (left; repeated from Table 3), core control and average of both cocaine groups (core and shell; middle), and shell control average of both cocaine groups (core and shell; right). Bold italics: *p < 0.01 (significant after Bonferroni correction); italics only: p < 0.05 (not significant after Bonferroni correction).
In this issue


