

Article Figures & Data
Figures
- Figure 1.
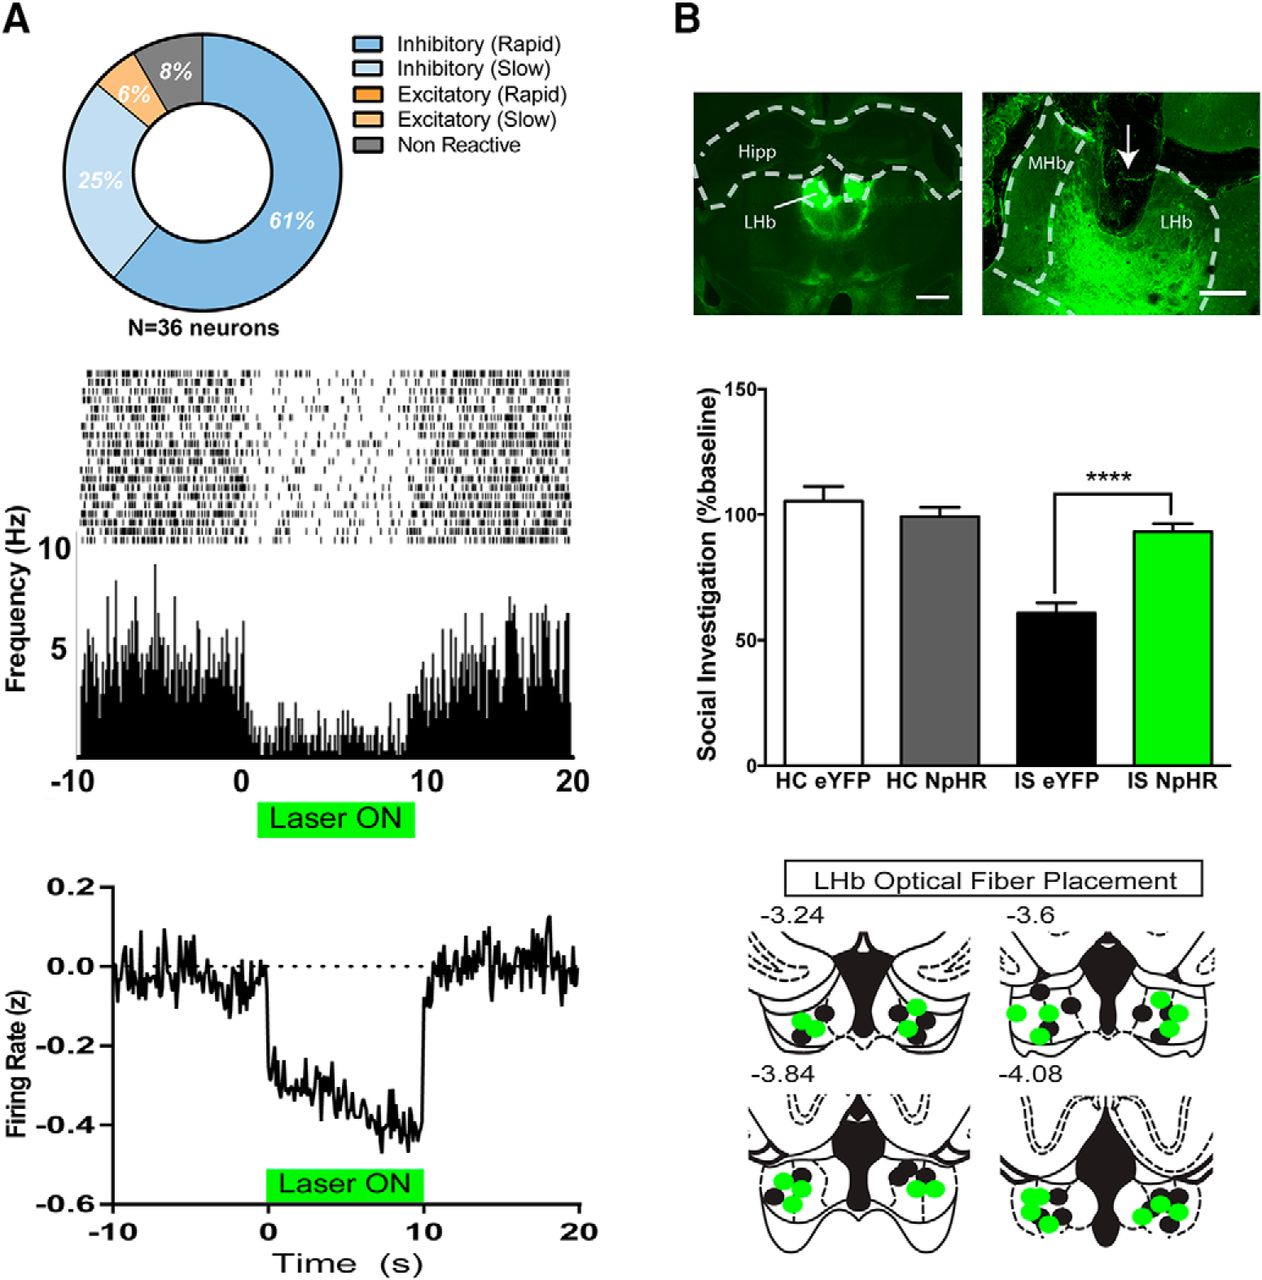
Optical inhibition of the LHb during IS prevents later anxiety-like behavior. A, Top left, Changes in LHb firing rate in response to continuous (10 s) green light illumination of LHb in rats expressing NpHR. Middle, Raster plot and perievent histogram showing the firing rate of a representative LHb neuron in a rat expressing NpHR in the LHb (bin size, 100 ms). Green bar represents continuous laser illumination. Bottom, The z-normalized firing rate of all valid neurons recorded during green light illumination of LHb (n = 36), B, Coronal micrographs demonstrating NpHR expression in the LHb in a rat that received IS plus optical silencing (IS+NpHR). Top left, Bilateral NpHR 3.0-eYFP expression (4× mosaic; scale bar, 1000 μm) and (top right) unilateral NpHR3.0-eYFP expression (inverted arrow indicates tissue damage from optical fiber implant (10×; scale bar, 200 μm). Middle, JSI data expressed as the percentage of baseline for rats previously injected with either eYFP or NpHR and later exposed to IS or HC treatment with green light illumination of the LHb (n = 10-11/group). Bottom, Diagram indicating the location of optical fiber tips in the LHb of rats that received IS plus NpHR 3.0 silencing (green dots) or IS plus eYFP (black dots). Position relative to bregma is denoted above individual images. Hipp, Hippocampus.
- Figure 2.
Optical inhibition of the LHb during IS prevents the neurochemical consequences of the stressor. A, Rats were injected with NpHR or eYFP, and implanted with LHb optical fibers and BLA microdialysis probes 3 weeks later. B, Left, BLA 5-HT levels measured during IS in rats that received IS plus NpHR or IS plus eYFP with green light delivery during tailshocks. Right, Area under the curve for BLA 5-HT levels measured during IS (arbitrary units, relative to average of baseline BLA 5-HT samples). C, Left, BLA 5-HT measured during JSI in rats that previously received IS plus NpHR or IS plus eYFP with green light delivery during tailshocks. Right, Area under the curve for BLA 5-HT measured during JSI (arbitrary units, relative to average of baseline BLA 5-HT samples). D, Left, JSI data for all rats that received IS plus NpHR or IS plus eYFP (n = 7-8/group). Middle, Correlation between BLA 5-HT levels measured during JSI and social investigation. Right, Schematic of BLA microdialysis probes for all rats included in statistical analysis. Position relative to bregma is denoted.
- Figure 3.
Stress, per se, increases Fos-IR in the LHbM. A, Photomicrographs of Fos-IR in the habenula from rats that were killed 2 h after receiving HC (top), IS (middle), or ES (bottom). Images are shown at 10× (left), 20× (middle), and 40× (right) magnification. Scale bars: left, 200 μm; middle, 100 μm; and right, 50 μm. B, Fos-IR was examined in the habenula at 0, 2, and 4 h following HC, IS, or ES (left to right). n = 8/group, two habenula sections/rat at all time points.
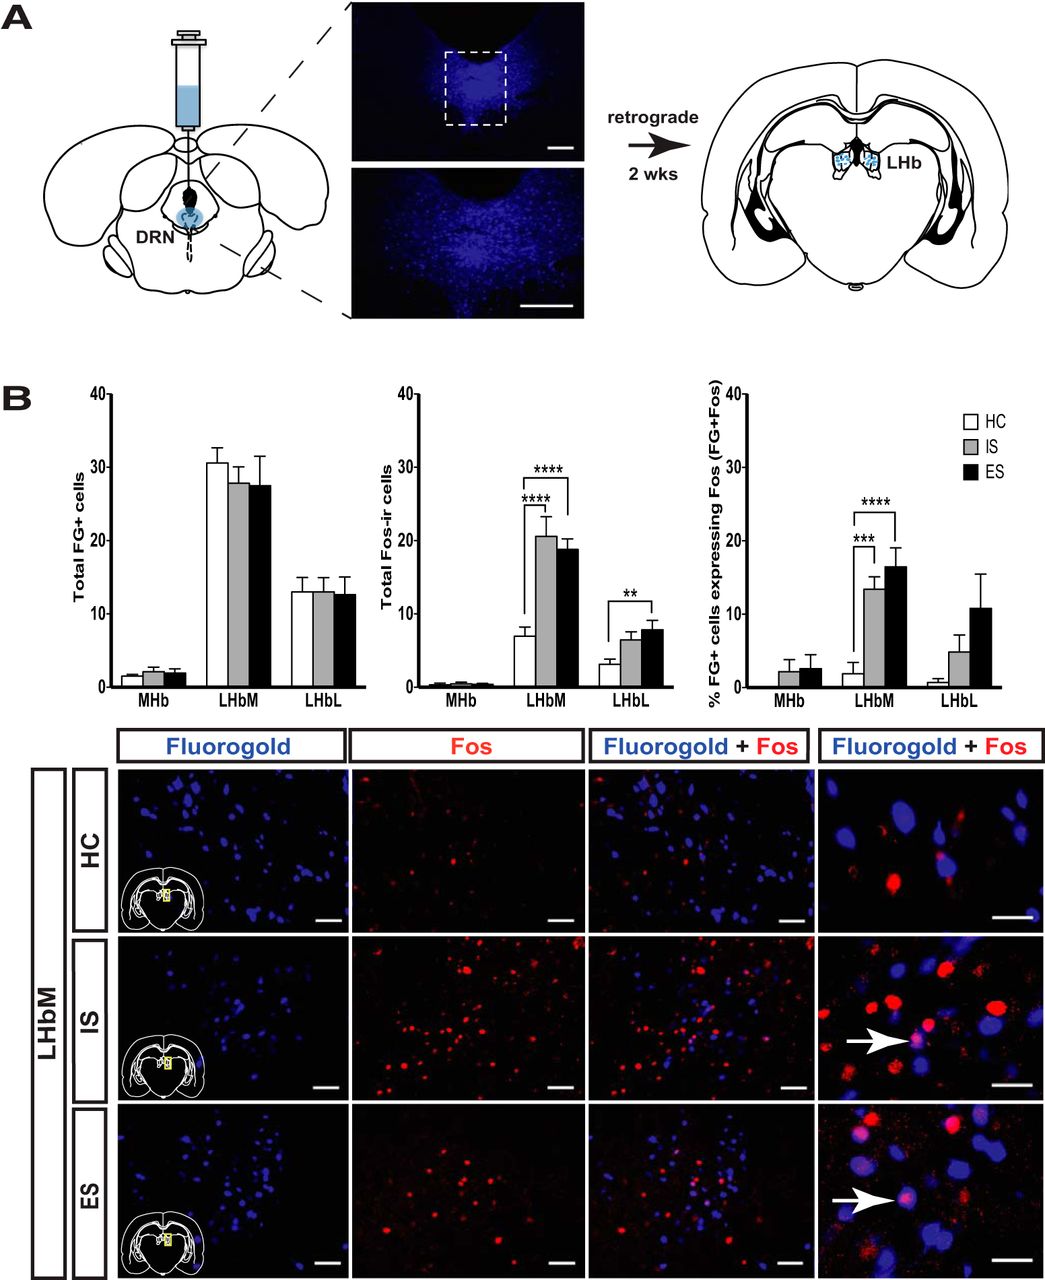
- Figure 4.
Stress, per se, increases Fos-IR in the LHb–DRN pathway. A, Schematic showing FG injected directly into the DRN prior HC, IS, or ES (left). Photomicrographs show the site of injection at 4× (top) and 10× (bottom) magnification. Scale bars, 200 μm. Fluoro-Gold traveled retrogradely to the LHb prior to rats receiving HC, IS, or ES (right). B, Two weeks after Fluoro-Gold injection, rats received HC, IS, or ES and were killed 2 h later. Total FG (left), Fos-IR (middle), and the percentage of FG cells also expressing Fos (FG+Fos; right) were quantified in the MHb, LHbM, and LHbL (top). The total number of FG-labeled cells in each habenula subregion (FG+Fos) did not differ across treatment groups (left). Total Fos-IR was increased in the LHbM and LHbL of rats that received either IS or ES (middle). Similarly, activation of the LHb–DRN pathway (% FG+Fos) was increased in rats that received either IS or ES (right). Photomicrographs (bottom) of representative LHbM tissue samples are shown for rats that received HC (top), IS (middle), or ES (bottom). Images in the first three panels are taken at 20× (scale bar, 50 um) and magnified to 40× at the far right (scale bar, 50 μm). FG reliably labeled cell bodies in the LHbM 2 weeks after injection (left). Increased Fos-IR is evident in rats that received IS or ES, relative to HC (middle). IS and ES also increased LHb–DRN pathway activation relative to HC, as measured by the colocalization of FG and Fos-IR (right). Arrows indicate colocalized FG and Fos-IR (magenta spot). N = 12/group, two habenula sections/rat.


Tables
Figure Data structure Type of test/comparisons p Value 1A See below 1B Normal distribution Two-way ANOVA (stress treatment × virus type) Main effect of virus type: p = 0.0044 Main effect of stress treatment: p < 0.0001 Sidak’s multiple-comparisons test Interaction: p < 0.0001 Home cage–inescapable Stress 95% CI: eYFP 30.24–58.97 NpHR −7.976 to 20.10 2B Normal distribution Two-way repeated-measures ANOVA Main effect virus type: p = 0.0007 Sidak’s multiple comparisons test Main effect time: p < 0.0001 eYFP – NpHR Interaction: p = 0.0002 BL1 95% CI: BL2 −43.11 to 65.40 BL3 −59.67 to 48.84 BL4 −47.73 to 60.78 S1 −66.85 to 41.66 S2 33.82–142.3 S3 −9.440 to 99.07 S4 7.267–115.8 S5 1.613–110.1 PS1 0.8602–109.4 PS2 −5.678 to 102.8 PS3 13.43–121.9 PS4 2.628–111.1 Independent samples t test (AUC) 0.5271–109.0 T, df p = 0.0023 t = 3.859 df = 12.00 2C Normal distribution Independent-samples t test for baseline JSI 5-HT values Maine effect virus type: p = 0.0029 Two-way repeated-measures ANOVA Main effect time: p < 0.0001 Sidak’s multiple-comparisons test Interaction: p < 0.0001 eYFP – NpHR 95% CI: BL1 −31.60 to 60.99 BL2 −32.35 to 60.23 BL3 −67.83 to 24.76 BL4 −41.90 to 50.69 JSI 78.49–171.1 PI1 −9.353 to 83.23 PI2 −34.55 to 58.03 PI3 −25.61 to 66.98 Independent-samples t test (AUC) p = 0.0102 T, df t = 3.580 df = 6.479 2D Normal distribution Independent-samples t test p < 0.0001 T, df t = 6.344 df = 9.716 2D Normal distribution Linear regression p = 0.0125 R2 = 0.3921 R = −0.6257 T, df t = 6.344 df = 9.716 3 Normal distribution Ordinary one-way ANOVA p = 0.0065 Tukey’s post hoc test 95% CI MHb Fos 0 h 0.03556 to 2.589 HC vs ES 0.4731 to 3.027 HC vs IS -0.8394 to 1.714 ES vs IS p < 0.0001 LHbM Fos 0 h −37.59 to −19.54 HC vs ES −34.15 to −16.10 HC vs IS −5.587 to 12.46 ES vs IS p = 0.1416 LHbL Fos 0 h p = 0.3300 MHb Fos 2 h p = 0.0013 LHbM Fos 2 h 95% CI: HC vs ES −38.21 to −8.789 HC vs IS −34.40 to −4.977 ES vs IS −10.90 to 18.52 LHbL Fos 2 h p = 0.1888 MHb Fos 4 h p = 0.8780 LHbM Fos 4 h p = 0.8652 LHbL Fos 4 h p = 0.0348 HC vs ES 95% CI: HC vs IS −3.706 to 0.4562 ES vs IS −4.331 to −0.1688 −2.706 to 1.456 4 Normal distribution Ordinary one-way ANOVA 95% CI: Tukey’s post hoc test p = 0.6651 Total FG MHb p = 0.7163 Total FG LHbM p = 0.5220 Total FG LHbL p = 0.9074 Total Fos-IR MHb p < 0.0001 Total Fos-IR LHbM 95% CI: HC vs ES −16.94 to −6.726 HC vs IS −18.73 to −8.517 ES vs IS −6.899 to 3.316 Total Fos-IR LHbL p = 0.0109 HC vs ES 95% CI: HC vs IS −8.395 to −1.022 ES vs IS −7.020 to 0.3534 Total % double-label MHb −2.312 to 5.062 Total % double-label LHbM p = 0.4152 HC vs ES p < 0.0001 HC vs IS 95% CI: ES vs IS −21.49 to −7.661 Total % double-label LHbL −18.44 to −4.614 −3.866 to 9.960 p = 0.0764 Cell firing rate (Hz) ANOVA BL vs laser BL vs post Laser vs post 31.05 0.68961273 n.s. n.s. n.s. 2.01 0.100469015 0.891754475 0.103118866 0.239922898 1.11 7.62002E-10 0.57315978 0.000124021 0.000124007 4.23 4.98676E-05 0.000171631 0.017046495 0.023234465 22.98 7.71135E-08 0.000149437 0.183615744 0.000150392 19.445 1.55431E-15 0.000124006 0.000187433 0.000124006 18.46 3.07286E-09 0.000124007 0.014428278 0.000139218 19.12 8.43769E-15 0.000124006 0.000355866 0.000124006 1.63 4.95913E-11 0.000124014 0.106283736 0.000124006 6.035 0 0.000124006 0.3640062 0.000124006 8.495 0 0.000124006 0.000124006 0.000124006 7.31 2.77556E-14 0 0.000124007 0 2.315 9.95919E-08 0.000759905 0.012110937 0.000124017 2.005 1.39015E-05 0.000133681 0.298443736 0.001375559 1.975 0.000155928 0.000359192 0.768212169 0.002040156 6.205 0 0.000124331 0.586462726 0.308035137 1.405 3.94043E-09 0.000791913 0.000630968 0.000124007 3.655 0 0.000124006 0.217018108 0.000124006 8.675 0 0.000124006 0.315496719 0.000124006 4.735 1.11022E-16 0.000124006 0.000202196 0.000124006 2.057894737 0 0.000126757 0.722558918 0.000126757 4.163157895 1.0224E-08 0.00014295 0.034134356 0.000126757 9.147368421 2.22045E-16 0.000126757 0.00012686 0.000126757 2.19 1.82944E-08 0.000124183 0.897361366 0.000124035 3.585 2.02568E-10 0.000124183 0.897361366 0.000135351 2.34 0 0.000124006 0.000124006 0.000124006 2.43 7.2915E-12 0.000124007 0.000124006 0.107882478 16.19 1.08128E-05 0.000155138 0.200273849 0.000538695 8.645 6.02274E-12 0.000124006 0.004329425 0.000124034 24.94 7.95227E-08 0.00012406 0.512140855 0.000127955 20.895 1.20682E-10 0.000124006 0.000322419 0.000161763 1.23 0.000437388 0.001932198 0.990424063 0.001355133 2.78 5.77942E-06 0.00176329 0.135744677 0.00012667 7.11 0 0.000124006 0.68520793 0.000124006 1.185 2.26193E-10 0.167593762 0.000124035 0.000124006 2.342105263 7.6863E-10 0.000126957 0.104059273 0.000126757 BL Laser Recovery −9.21485E-17 −0.068442491 −0.034221245 −9.10383E-17 0.019584164 0.090087152 −1.04812E-16 −0.038779231 0.268952733 −9.99201E-18 −0.455220728 −0.233230373 −5.96745E-17 −1.024094554 −0.207156056 −0.132067429 −0.919189306 −0.410609643 −0.102381307 −0.789798657 −0.357359516 −0.100727222 −0.850484148 −0.342746023 −0.015070323 −0.262474797 0.04521097 −0.047670764 −0.632476897 −0.09332727 −0.034264811 0.027295697 0.554625337 −0.077528279 −0.439972986 −0.200927458 −0.009444506 −0.11963041 0.073457269 −0.019688117 −0.189932426 −0.068329348 −0.015790119 −0.205271549 −0.078950596 −3.94129E-17 −0.615002166 0.245870431 1.02141E-16 −0.190553967 0.194579755 3.33067E-17 −0.544864081 0.05771146 −6.55032E-17 −0.690738882 −0.054442473 −1.73195E-16 −0.395196601 0.187793805 −0.017634339 −0.285847671 −0.003923753 −0.032238634 −0.232802881 0.067656299 −0.051458356 −0.367047892 0.193812657 1.11022E−17 −0.201257541 0.013916745 −7.54952E-17 −0.144895939 0.198278654 −0.031527833 0.63160759 0.265884726 4.55191E-17 0.341549335 0.432560984 −1.17684E-16 −0.588112809 −0.160488531 −0.073112074 −0.45375906 −0.18858273 −0.067924124 −0.424629951 −0.145849345 −0.094099006 −0.442713419 −0.259444403 −0.021839826 −0.123759015 −0.004367965 1.29341E-16 −0.137644887 0.072012888 8.46545E-17 −0.391554728 0.022322843 −1.9984E-17 −0.052093519 0.193324838 −0.024702377 −0.245136395 0.047017782
In this issue


