

Article Figures & Data
Figures
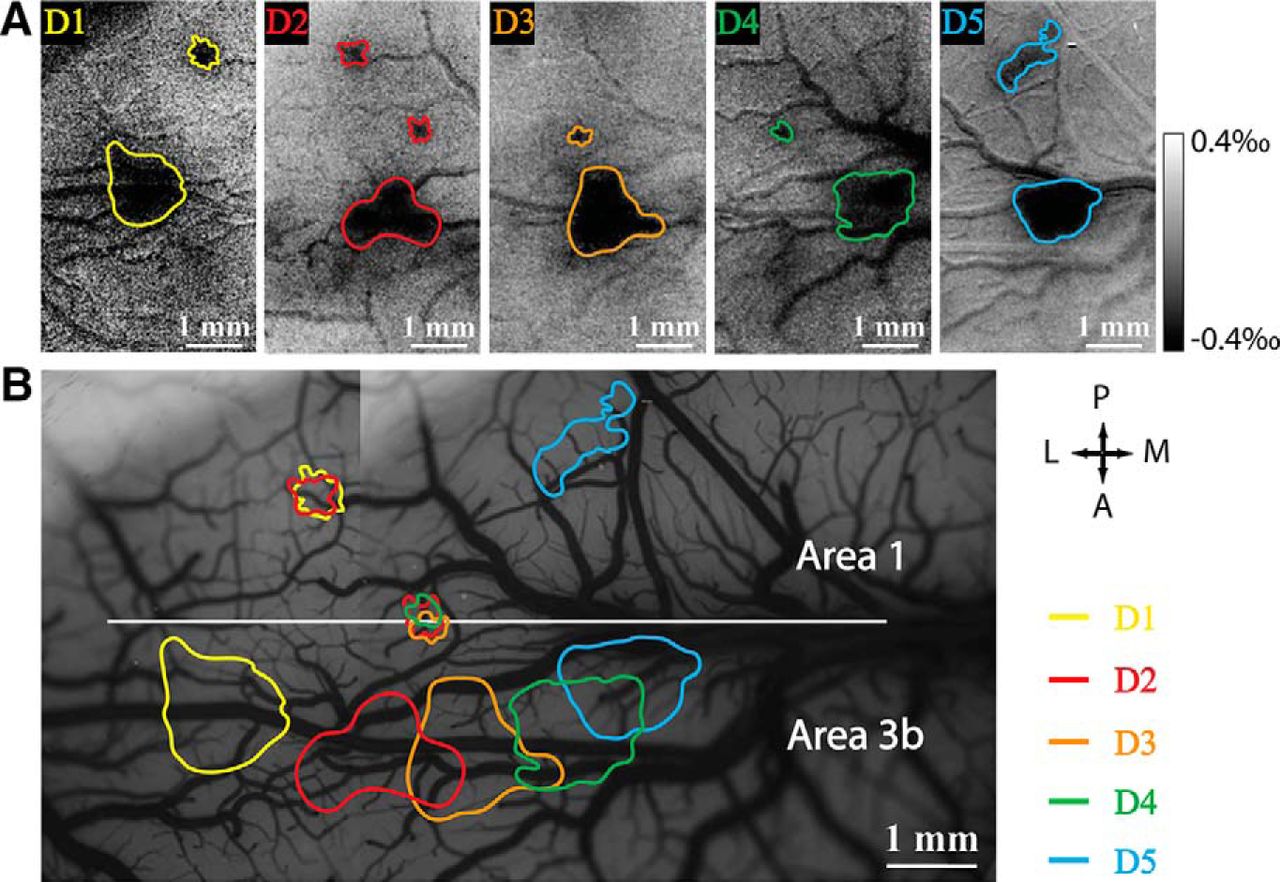
- Figure 1.
Individual digit representation in somatosensory area 3b and area 1 revealed by optical imaging intrinsic signals in one subject, SM-CHA. A, Optical imaging activations (dark spots) of D1–D5 in response to 8 Hz vibrotactile stimulation. B, Composed activation map shows the somatotopy of the individual digit activations (color outlines) on the blood vessel map.
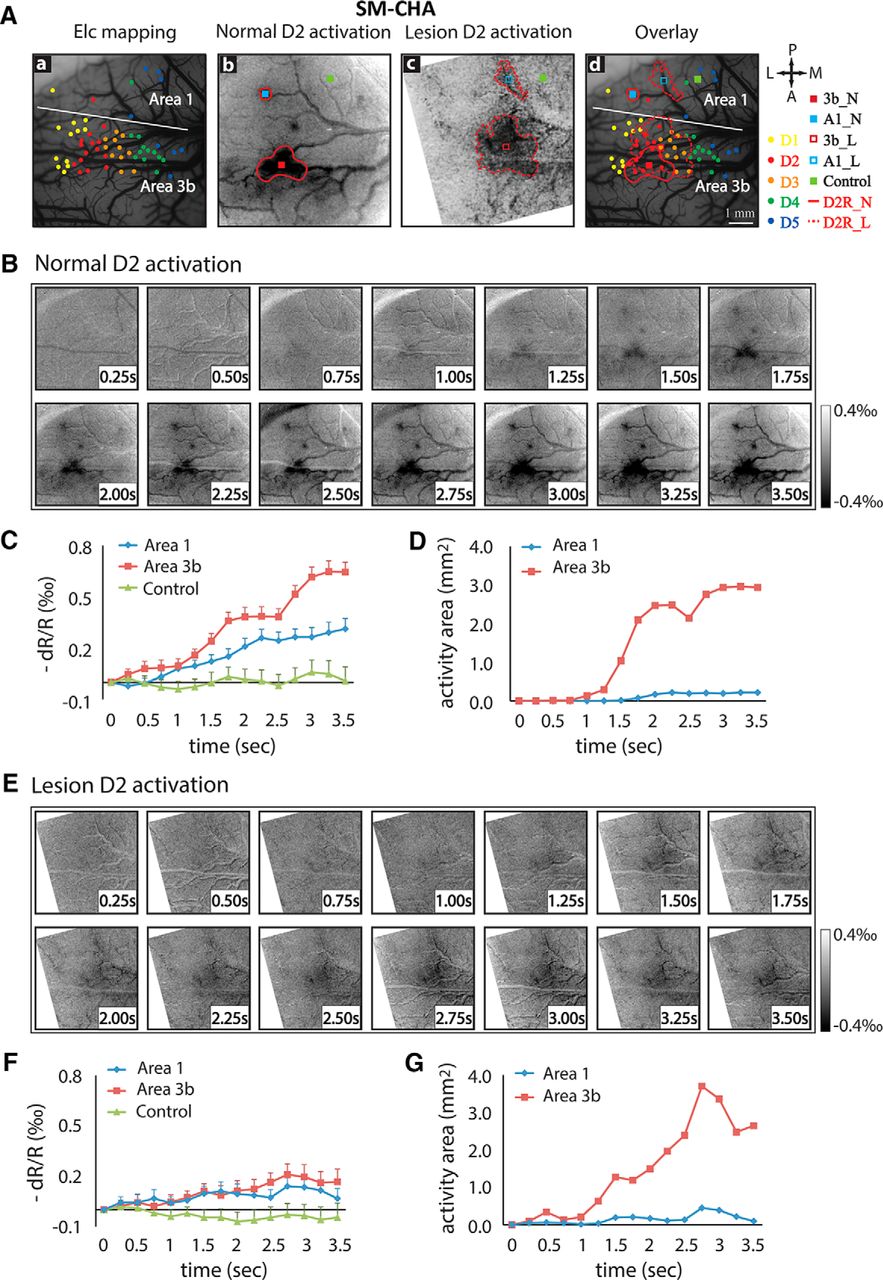
- Figure 2.
Spatiotemporal dynamics of optical imaging activation in response to single-digit stimulation in somatosensory areas 3b and 1 before and after a DCL in one representative monkey (SM-CHA). Aa–Ad, Postlesion electrophysiological map of digit representation (Aa), D2 mean activation map before DCL (Ab), D2 mean activation map after DCL (Ac), and overlay of Aa, Ab, and Ac (Ad). Electrode penetration sites and properties of the receptive fields are indicated by color dots, and the digit activations are circled by color outlines. Receptive field properties: yellow dots, D1; magenta dots, D2; orange dots, D3; green dots, D4; and blue dots, D5. Full red outlines (D2R_N) and dash red outlines (D2R_L) indicate D2 activation before and after DCL, respectively. Squares show regions for extracting optical signals (see squares in Ab, Ac, and Ad): center of activated area 3b before DCL, red full squares (3b_N); center of activated area 1 before DCL, blue full squares (A1_N); center of activated area 3b after DCL, red dash squares (3b_L); center of activated area 1 after DCL, blue dash squares (A1_L); and one nonactivated control region, green squares. B, First frame-subtracted serial optical images show the development of D2 activations over a 3.5 s vibrotactile stimulation period in areas 3b and 1 before DCL. C, Prelesion time course development of optical signals extracted from area 1 (blue line), area 3b (red line), and a control location (green line). D, Prelesion development of activation sizes in area 1 (blue line) and area 3b (red line) during stimulation. E, First frame-subtracted serial optical images show the development of D2 activations over a 3.5 s stimulation period after DCL. F, Postlesion time course development of optical signals in area 3b (red line), area 1 (blue line), and control (green line). G, Postlesion temporal profile of activation sizes in area 3b (red line) and area 1 (blue line). Error bars indicate the SE.
- Figure 3.
Spatiotemporal dynamics of optical imaging activation to single-digit stimulation in somatosensory areas 3b and 1 in prelesion and postlesion conditions in the second monkey (SM-CHI). Same format as Figure 2, except data are from vibrotactile stimulation of D3 prelesion and D2 6 weeks postlesion.
- Figure 4.
Spatiotemporal dynamics of optical imaging activation to single-digit (D2) stimulation in normal and lesioned somatosensory area 3b in a third monkey (SM-COA). A, Normal cortex. Aa–Ac, Electrophysiological map of digit representation (Aa), D2 activation map (blue outline) of the vibrotactile stimuli in contralateral normal cortex (Ab), and the overlay (Ac). B, Time courses of the optical imaging signals of D2 activation in area 3b (blue outline) and one control location (red outline). C, Temporal profile of the size changes of D2 area 3b activation. D, Deafferented cortex. Electrophysiology digit representation map (Da), average D2 activation map (Db), and overlap map (Dc) at 8 weeks postlesion. E, Time courses of the optical signals of D2 activation in area 3b (blue outline) and in one control region (red outline). F, Change of D2 activation size in area 3b during stimulation ipsilateral to the side of the spinal cord injury. Error bars indicate the SE.
- Figure 5.
A–D, Plots of individual digit and group averaged OIS signal amplitudes (A, B) and areas of activation (C, D) in areas 3b and area 1 in normal and lesioned conditions. A, B, The total number of digits for amplitude measure is n = 25 in normal area 3b (A: D1, n = 6; D2, n = 6; D3, n = 6; D4, n = 4; D5, n = 3), and n =19 in normal area 1 (B: D1, n = 3; D2, n = 5; D3, n = 3; D4, n = 4; D5, n = 4), respectively. The total number of digits for amplitude measure is n = 7 in lesioned area 3b (A: D1, n = 2; D2, n = 3; D3, n = 1; D4, n = 1), and n = 6 in lesioned area 1 (B: D1, n = 1; D2, n = 2; D3, n = 1; D4, n = 2), respectively. C, D, The total number of digit pairs (prelesion vs postlesion) for area measure is n = 6 in area 3b (C: D1, n = 2; D2, n = 3; D3, n = 1), and n = 3 in area 1 (D: D1, n = 1; D2, n = 1; D4, n = 1). One-way ANOVA test was performed to examine the amplitude differences across digits in normal area 3b (A) and area 1 (B). N.S.p > 0.05, *p < 0.05. Error bars indicate the SE. An unpaired t test was performed to compare the amplitude differences between total normal and lesioned digits (total columns in A and B). Paired t test was performed to examine the activation area difference between prelesion and postlesion conditions (total columns in C and D). *p < 0.05. Error bars indicate the SE.
- Figure 6.
Group-level statistical analysis of the spatiotemporal dynamic features of optical imaging signal changes to single-digit stimulation in normal and lesioned conditions (by DCL) in area 3b and area 1. A, B, Mean time courses of OI signal amplitudes in response to the stimulation of individual digits across all the animals in normal and deafferented conditions in area 3b (A) and area 1 (B). C, D, Mean time course of activation size changes. E, Time to peak amplitude. F, Time to peak activation size. G, Amplitude changes between 2.0 and 3.5 s after stimulus onset. H, Area changes between 2.0 and 3.5 s after stimulus onset. I, Comparison of peak activation amplitudes in area 1 and area 3b in normal vs lesion conditions. J, Comparison of peak activation sizes in area 3b. Unpaired t test for E–I (normal area 3b: n = 25 digits, including 8 digits from prelesion control, 14 digits from normal control, and 3 digits from ipsilateral control. Lesioned area 3b: n = 7 digits. Normal area 1: n = 19 digits, including 6 digits from prelesion control, 12 digits from normal control, and 1 digit from ipsilateral control. Lesioned area 1: n = 6 digits). Paired t test was used in J (area 3b: n = 6 digit pairs before and after DCL; area 1: n = 3 digit pairs before and after DCL). Details provided in Table 1. *p < 0.05, **p < 0.005. Error bars indicate the SE.
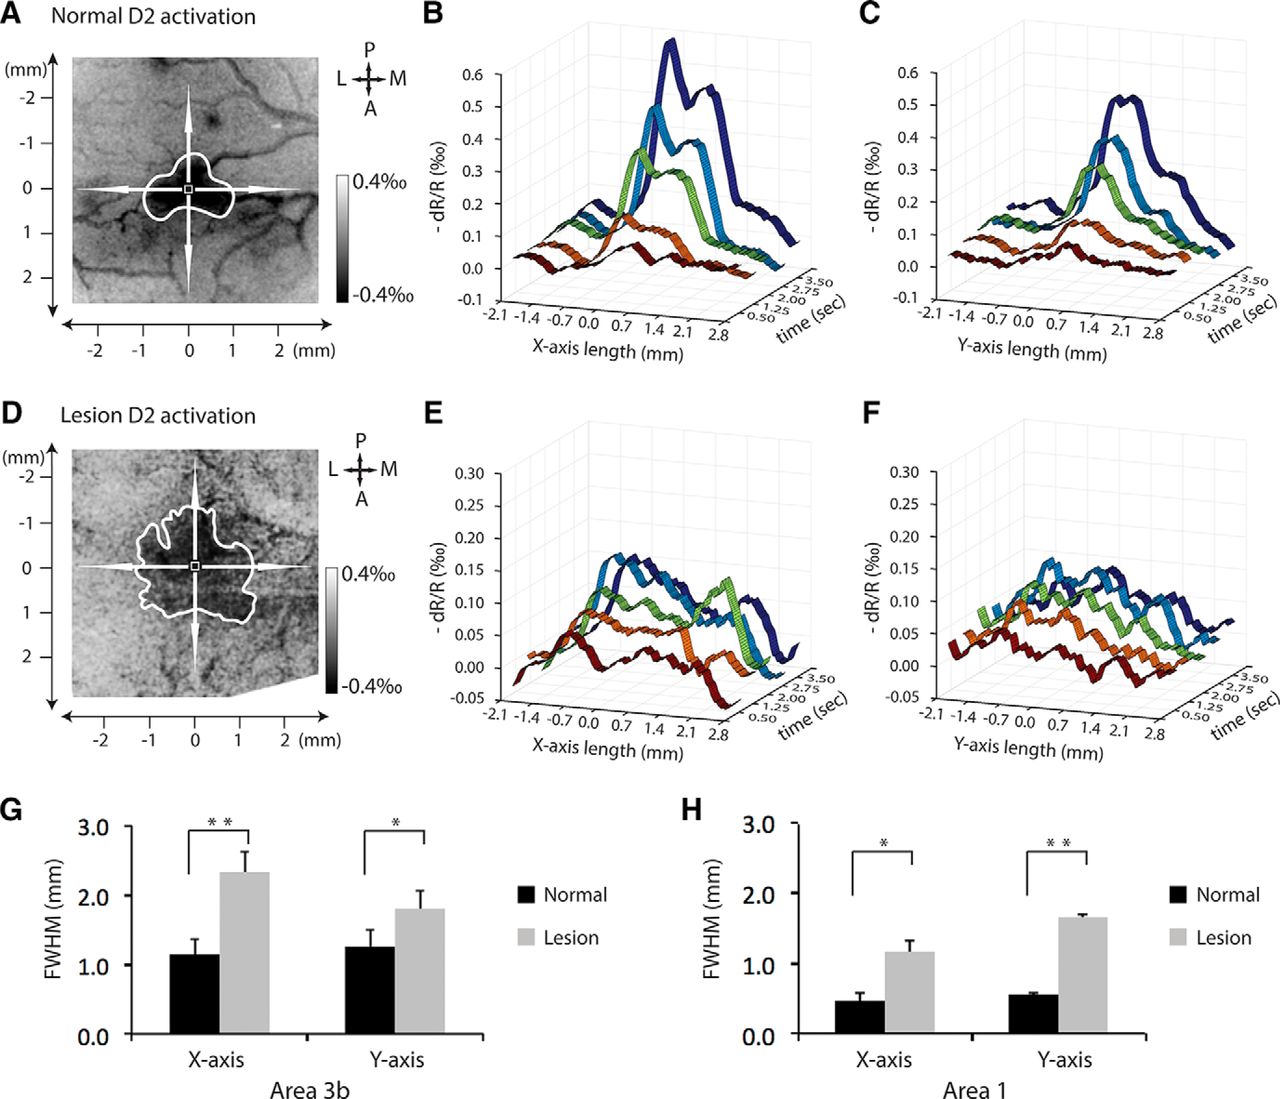
- Figure 7.
Spatiotemporal dynamics of activation in lateral-to-medial and anterior-to-posterior directions in area 3b in normal vs lesioned conditions. A, D2 activation map in normal cortex in monkey SM-CHA. B, 3D plot of the percentage of optical signal changes as a function of time after stimulus onset (0.5, 1.25, 2, 2.75, and 3.5 s) along the lateral-to-medial axis (x-axis) of the activation focus. C, 3D plot of the percentage of optical signal changes as a function of time along the anterior-to-posterior axis (y-axis) of the activation focus. D, D2 activation map after lesion. E, 3D plot of the percentage of optical signal changes as a function of time along the lateral-to-medial axis of the activation focus after lesion. F, 3D plot of the percentage of optical signal changes as a function of time along the anterior-to-posterior axis of the activation focus after lesion. G, H, Comparison of the FWHM measures along the two axes of area 3b (G) and area 1 (H) in normal and lesion conditions. Paired t test for G and H, area 3b pairs = 6 and area 1 pairs = 3. *p < 0.05, **p < 0.005. Error bars indicate the SE.
- Figure 8.
Histological evaluation of CTB-labeled terminations in the spinal cord and cuneate nucleus of the brainstem in three monkeys (A–C, SM-CHA; D–F, SM-CHI; and G–I, SM-COA). A, D, G, One horizontally cut CTB-immunoreacted section of the spinal cord showing the location of the lesion and labeled terminal fields after tracer injections. Cervical segments 4–7 and foci of label from injections in digits 1, 3, and 5 are marked. B, E, H, Three/four examples of coronally cut CTB-immunoreacted sections through dorsal column nuclei of brainstem. The cuneate nucleus (CuN) is outlined, and numbers 1, 3, and 5 mark the foci of afferents labeled by injections in digits 1, 3, and 5, respectively. Note that there are a few detectable foci of axon fibers on the lesioned (left) side (normal sides are marked with *). C, F, I, Transverse view of spinal cord through cervical segment C5–C6 (SM-CHA and SM-CHI), and C4–C5 (SM-COA) with the reconstructed extent of the lesion in black. The lesions were reconstructed from a series of horizontally cut sections.
- Figure 9.
Longitudinal evaluation of food-reaching and food-grasping behaviors following DCL. A, B, Plots of success rates (A) and number of flexes (B) as a function of different postoperational time points (week) for all three subjects. Error bars indicate the SE.
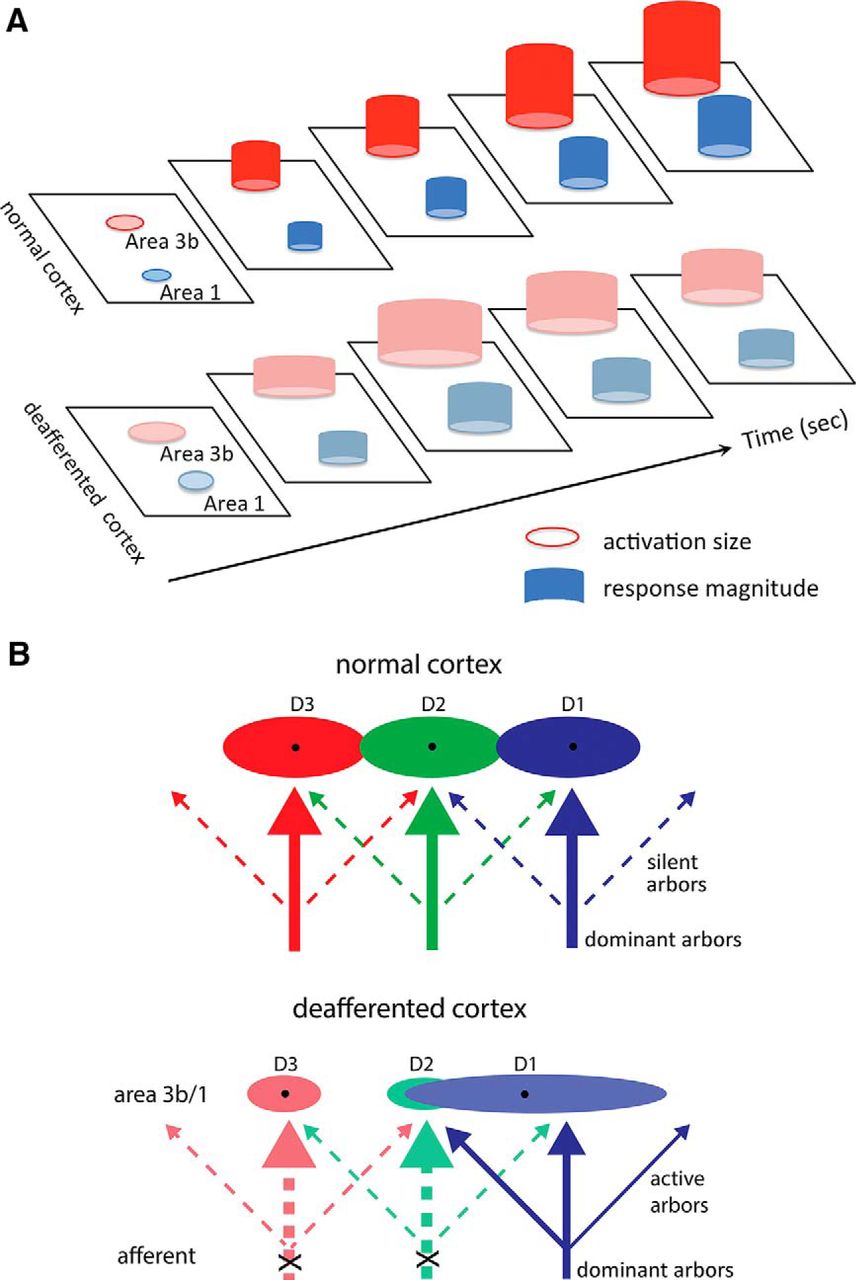
- Figure 10.
Schematic summary of the spatiotemporal dynamics of optical imaging activations and proposed mechanisms for response property changes after DCL. A, Schematic summary of optical imaging activations to single-digit stimulation in area 3b and area 1 in normal vs deafferented conditions. B, Proposed mechanism for response property changes in reactivated and reorganized digit regions in areas 3b and 1 after partial deafferentation.


Tables
- Table 1
—Summary of data source of normal animals (prelesion, SM-CHI and SM-CHA; normal control, SM-PUA, SM-GUA, and SM-POT; ipsilateral, SM-COA) and lesioned animals (postlesion, SM-CHI, SM-CHA, and SM-COA) included in this study
SM-CHI SM-CHA SM-PAU SM-GUA SM-POT SM-COA Total digits Normal area 1 D3, D5 D1, D2, D4, D5 D1, D2, D4 D1, D2, D3, D4, D5 D2, D3, D4, D5 D2 19 Lesioned area 1 D2, D4 D1, D2, D3, D4 Null Null Null Null 6 Normal area 3b D1, D2, D3 D1, D2, D3, D4, D5 D1, D2, D3, D4 D1, D2, D3, D4, D5 D1, D2, D3, D4, D5 D1, D2, D3 25 Lesioned area 3b D2, D4 D1, D2 Null Null Null D1, D2, D3 7
In this issue


