

Article Figures & Data
Figures
- Figure 1.
Outline of experimental procedures, example behavior, and schematic of hypotheses regarding how mPFC cells may alter responses and mediate behaviors as a result of flexible learning. A, Rabbits (n = 8) received standard training for trace eyeblink conditioning until asymptotic. Inset shows the standard training protocol and example eyelid response after learning (upward deflection indicates closure). Waterfall plots show traces of eyelid position for each trial of a session for two representative rabbits (trial 1 is at top, x-axis is time: gray bar, 500 ms tone; arrowhead, US onset). Eyelid closures prior to US onset are CRs. After acquisition, rabbits experienced four types of training sessions each week: Day 1, standard training; Day 2, pharmacological blockade of CRs (M, muscimol infusion into the cerebellum; note absence of CRs after infusion for both example sessions; markers show histologically verified infusion sites around Bregma −19.5; scale bar, 1 mm); Day 3, tone-only extinction training (E) followed by reacquisition (R; note the decrease in CRs during E training and the fast reinstatement of behavior during R training); and Day 4, different tone (9.6 kHz) and interval training (750 ms DTI; note the temporal shift in CR onsets during DTI). After Day 4, recording tetrodes were advanced to isolate a different population of mPFC cells, with daily manipulations repeated the following week. B, Schematic of persistent and “trace” (CR feedback responses) single-unit spike responses observed in the mPFC during trace conditioning (left) and the hypothesized response changes if persistent cells mediate flexible learning.
- Figure 2.
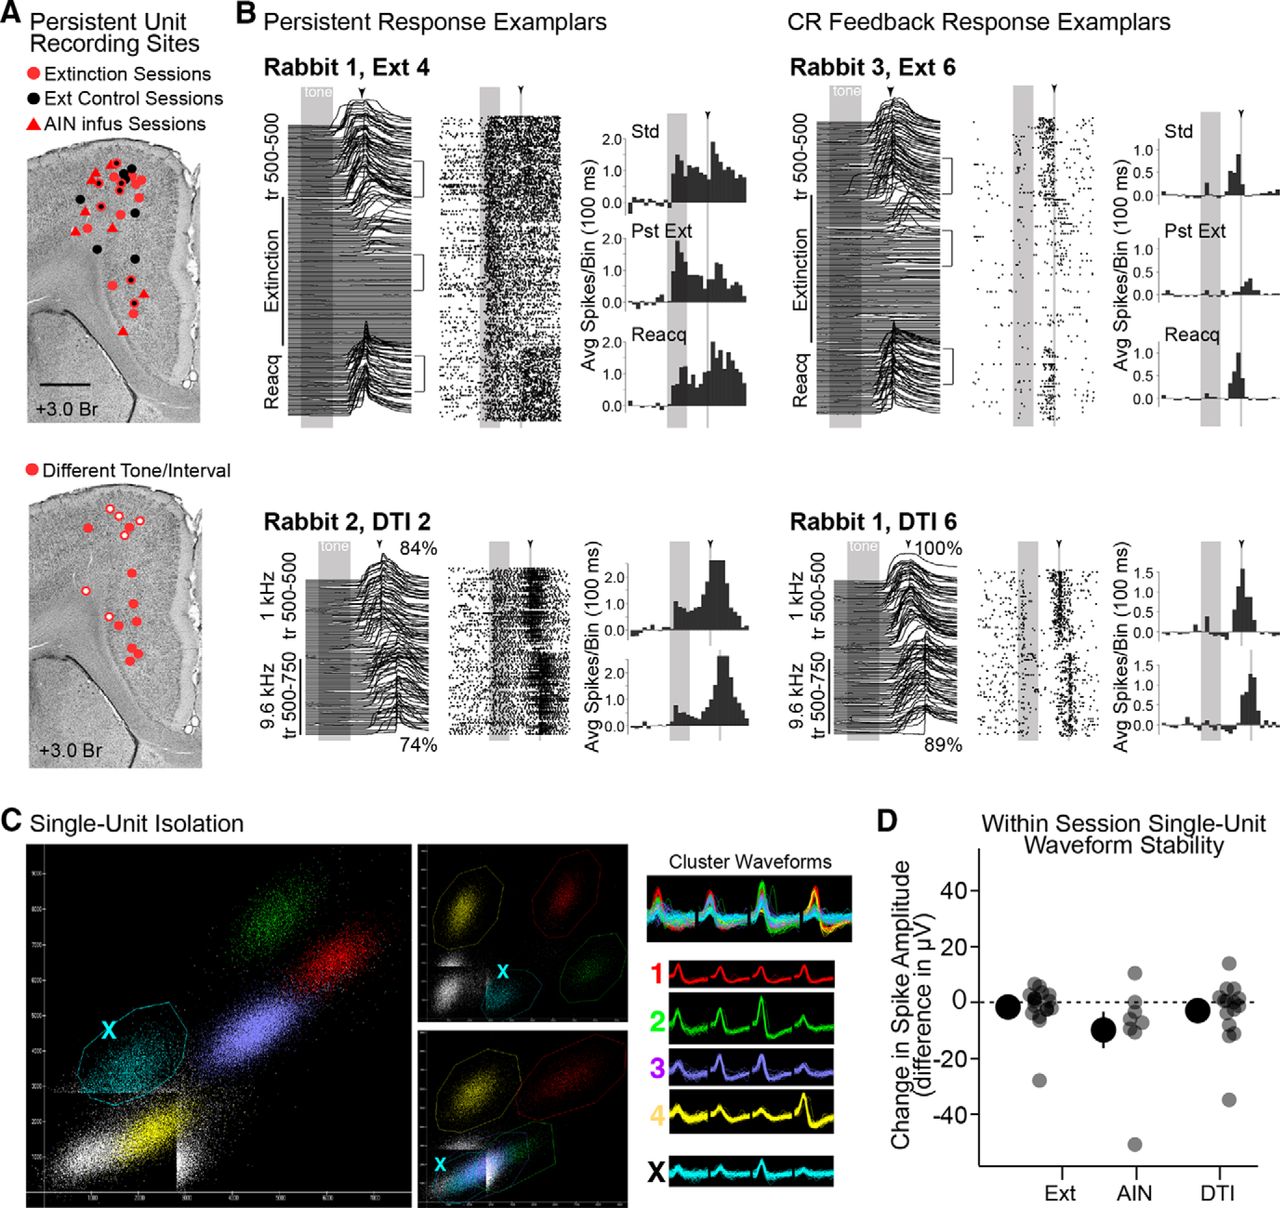
Estimated recording sites of persistent cells, example single-unit responses, single unit cluster isolation and stability measurements for manipulation sessions. A, Top, Estimated recording locations of persistent mPFC neurons recorded during extinction (red circles) and control extinction sessions (black circles; markers outlined in red indicate persistent cells recorded at that location for both control and corresponding extinction sessions). Recordings during cerebellar infusions (AIN) are shown as red triangles. Bottom, Recording sites for DTI sessions. Open markers indicate recordings during sessions with poor performance, closed markers indicate good performance. B, Waterfall plots show eyelid behavior. Raster plots show spike data across trials (each row is a trial; each dot is a spike; gray bars and arrowheads indicate the presentation of tone and US, respectively). Brackets indicate trials used for spike analysis based on behavioral criteria (see Materials and Methods), and histograms (baseline subtracted) show averaged spike data from those epochs (Std; Pst, postextinction; Reacq, reacquisition training). Top examples are from extinction sessions; bottom examples are from different tone/interval sessions. C, Scatterplots showing different peak-to-peak comparisons from two of the four channels of a tetrode. Colors indicate putative isolated single-unit clusters, with corresponding waveforms given to the right. Note that the teal cluster never completely surpasses the trigger threshold, while other clusters do and show clean separation from each other on at least one projection. The teal cluster would be eliminated from analyses due to poor isolation. D, Isolated clusters showing persistent responses during Ext, cerebellar infusion (AIN), and DTI training were evaluated for stability within recording sessions. Large markers show the mean and SEM of changes in amplitude between standard and experimental trials (individual data points are also shown). The peak spike amplitudes of some persistent cells shifted during recording sessions, but no systematic changes were observed for any group (t = 0.79–1.5, p > 0.05, n.s.).
- Figure 3.
Comparison of mPFC cell types showing “Strong” or “No/Weak” behavioral feedback during standard training sessions. Cells receiving feedback were identified by correlating spike activity across trials for a given session with eyelid responses (see Materials and Methods). Pseudocolored matrices are binned, baseline subtracted, and averaged eyelid (left) or single-unit spike data (middle and right) from standard training sessions (each row represents a trial; at top, gray bars and arrowheads, with corresponding white lines, indicate presentation of tone and US, respectively). Graphs to right show session-averaged eyelid (top) and spike data for cells receiving strong or no/weak feedback (middle), and the bin-by-bin differences in spike rates (bottom, red line) and confidence intervals based on bootstrapping (red dashed lines; see Materials and Methods). A, B, Cells receiving strong or no/weak feedback differed most in time bins corresponding to the timing of behavioral responses for both persistent (A) and CR feedback (B) cell types, while responses during the tone were not substantially different. Avg, average.
- Figure 4.
Behavioral performance during extinction sessions (standard training followed by extinction and then reacquisition of CRs) and behavioral criteria used to analyze spike data during extinction. A, CR rates were used to assess changes in behavior between conditions and across weekly experiences. The average performance during standard (black markers) and extinction (red markers) training show decreased CR rates as a result of extinction training, and was similar across weekly experiences. Performance during reacquisition (gray markers) was lower and more variable between rabbits and across experiences than standard training (numbers indicate the number of extinction sessions each week). B, Bar graph showing the total number of mPFC cells recorded during extinction sessions and the average number of cells/session recorded each week (black markers). The majority of cells were recorded during the first four extinction experiences. Numbers indicate the number of rabbits that experienced extinction for a given week. C, Scatterplot showing the number of trials until there were three consecutive trials with no CR (y-axis, criterion for early extinction) and the number of trials to reach eight of nine trials with no CR (x-axis, criterion for late extinction; markers represent each session, color indicates specific rabbits). Sessions for which animals met both criteria at a similar time (near dashed identity line) suggest a rapid progress to full extinction, and typically occurred between 10 and ≥20 trials after the start of extinction training. Sessions in which criteria were met at different times (below identity line) suggest that the extinction process was slower. D, Pseudocolored matrices of representative eyelid responses from two extinction sessions/rabbit (indicated in C by enlarged markers). One showed early rapid extinction (orange, left) and the other showed slow extinction (purple, right). Examples are from the same waterfall plots shown in Figure 1A. Brackets indicate trials used for the analysis of spike data to compare standard (last 27 trials) and full extinction based on when the eight of nine trials with no CR criterion was met (*first 27 trials after full extinction). Avg, average.
- Figure 5.
Persistent mPFC cells did not show decreased spike responses as a result of extinction training. Pseudocolored matrices and graphs are as described in Figure 3. A, Comparisons between Std (black) and after full extinction (Pst Ext; red) for behavior (Eyelid Responses, left), CR feedback cells (middle), and persistent cells (right), and for sessions in which behavior was pharmacologically blocked by infusion of muscimol into the cerebellum (Behavior Blocked, far right). Pseudocolored matrices show eyelid position or spike activity during Std and Pst Ext trials, with each row showing eyelid or spike response from one trial, averaged across sessions or cells, respectively. Top graphs show averages from Std trials (black) and from Pst Ext or Post-muscimol infusion trials (red). Bottom graphs show bin-by-bin differences between Std and Post averages (red line) and confidence intervals from bootstrapping (dashed red lines) for each time bin. PFC cells only showed response changes in association with changes in behavioral feedback due to CR extinction, similar to that observed during pharmacological blockade of CRs, suggesting that learning-related changes were not observed. B, Direct comparison of postextinction and pharmacological blockade of CRs indicated that observed changes in spike responses during Pst Ext trials were due to the absence of behavioral feedback alone and not to modification of responses to the tone as a result of extinction training. C, Control comparisons for persistent cells identified as showing No/Weak behavioral feedback support the interpretation that persistent cells did not show changes in spike responses after extinction. The average behavior for sessions that contributed cells to this analysis is also given. D, Correlated activity within simultaneously recorded cell ensembles show decreases in coactive cell pairs after extinction, which was similar to that observed during control sessions, suggesting that changes in ensemble activity occur over time and not in response to extinction training (unpaired t test, p > 0.05). Avg, average.
- Figure 6.
Persistent mPFC cells did not show changes in spike responses as a result of reacquisition training. Pseudocolor matrices and graphs are as described in Figure 5. Average spike activity from pre-extinction Std (black) is also shown for comparison. A, Comparisons of behavior, and persistent and trace cell responses between postextinction (Pst Ext; red) and reacquisition (Reacq; gray). Reliable differences were not observed between Pst Ext and Reacq for persistent cells, while CR feedback cells showed reliable differences in spike responses in accordance with behavioral feedback. B, Similar results were observed for persistent cells even when reacquisition criteria were not met. CR feedback cells showed more modest differences in responses when reacquisition criteria were not met, likely reflecting the behavioral variability observed for these sessions.
- Figure 7.
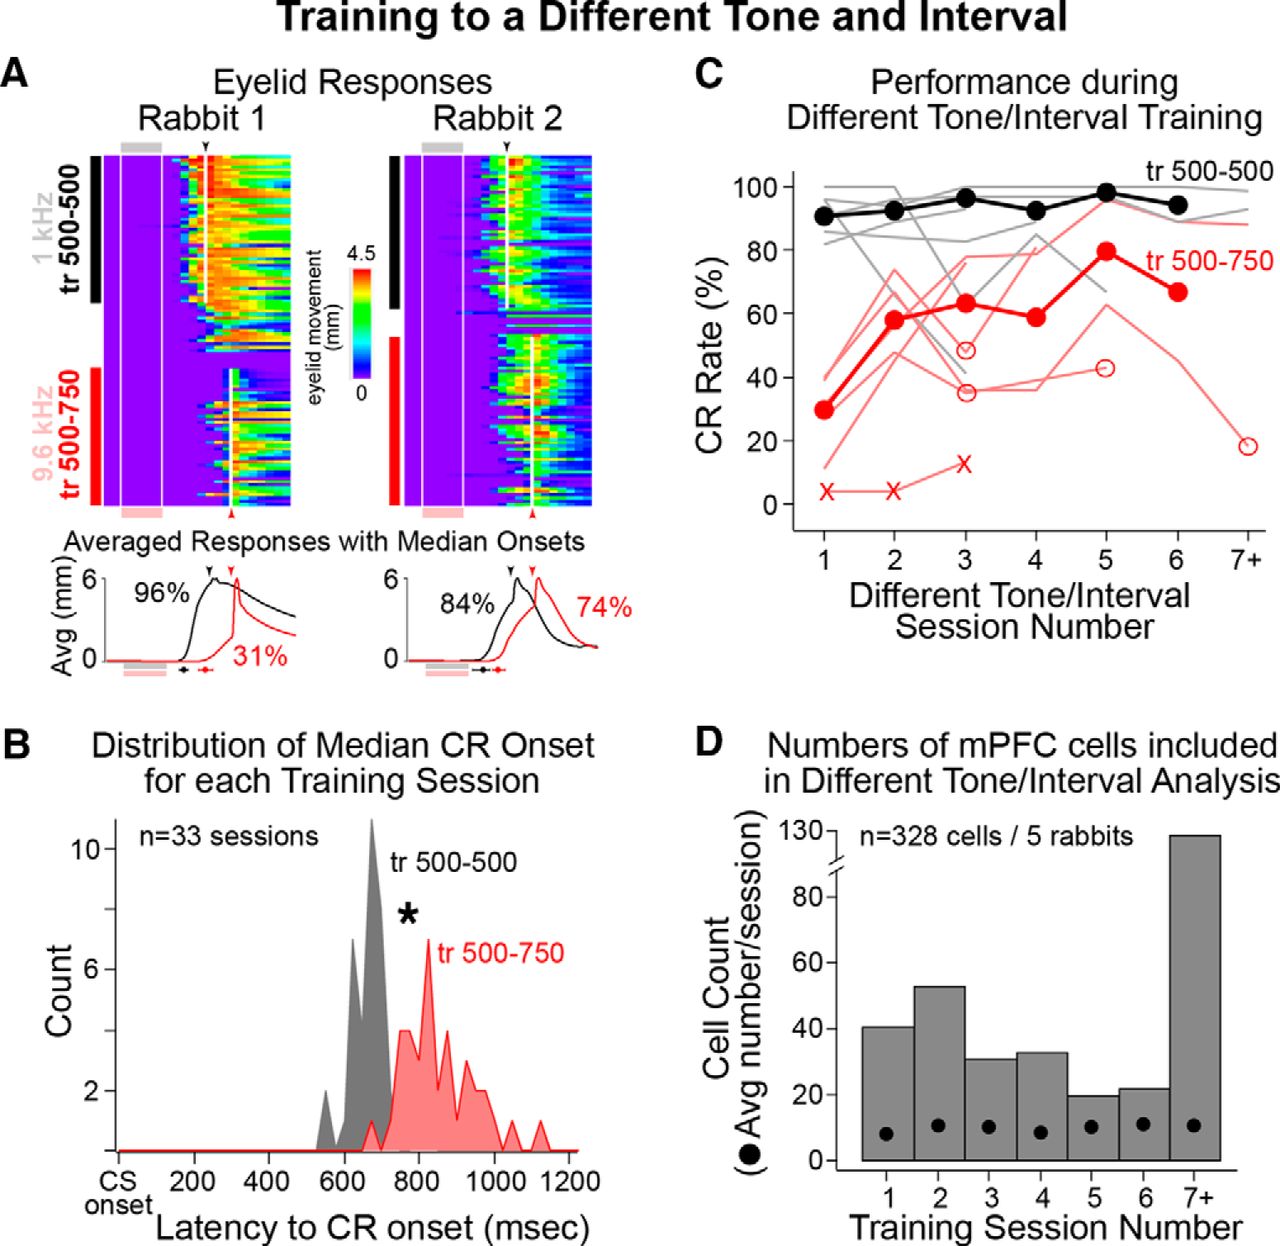
Behavioral performance during standard [1.3 kHz, training for 500–500 ms (tr 500–500), black] and different tone/interval training (9.6 kHz, tr 500–750, red), and analysis of CR onset latencies used to determine sessions in which rabbits showed good behavioral discrimination between the two tones. A, Representative eyelid behavior from different tone/interval sessions from two rabbits. Sessions began with standard training, followed by 9–18 trials of extinction to facilitate the task switch to the different tone/interval. Line graphs show the average eyelid behavior for standard (black) and different tone training (red; CR rates also given). The latencies to CR onset were measured for each trial and tested between epochs (indicated by black and red markers below graphs; median latency ± quartile). Only sessions in which rabbits showed significant differences in the timing of CRs were included for spike analysis. Note that both rabbits showed significantly later CR onsets for trials with the different tone (red). B, The distributions of median session latencies to CR onset are shown for standard (gray) and different tone/interval (red) epochs. A paired comparison indicated that rabbits showed significantly later CR onsets for different tone trials (paired t test, p < 0.001). C, Average behavioral performance (CR rates) across weekly training sessions for standard (black markers, light black lines show individual rabbits) and different tone/interval training (red markers, light red lines show individual rabbits; “X” markers indicate sessions from one rabbit excluded for poor learning; open markers indicate sessions in which rabbits failed to discriminate between tones and so were excluded from spike analysis). Note that rabbits typically showed learning (increased performance) between the first two sessions of different tone training, but that CR rates were generally lower and more variable than those observed for standard training. D, Bar graph showing the number of cells recorded during each weekly session, and the average number of cells recorded per session (black markers). Most cells included for analysis were recorded after rabbits showed new learning (post-session 1).
- Figure 9.
Schematic of the results for persistent and CR feedback cells during extinction and different tone training. A, Persistent cells did not show a change in spike response after full extinction or during reacquisition, while feedback cells showed the predicted changes in association with the absence and reinstatement of CRs. The data suggest that a decrease in persistent mPFC responses is unlikely to mediate the extinction of CRs. B, In contrast, during different tone/interval training persistent cells showed generalized responses when performance was good, while a failure to generalize was associated with poor performance. CR feedback cells showed a temporal shift in spike responses reflecting feedback from the shift in behavioral CRs.


Tables
Data structure Type of test Groups compared Confidence intervals a Unknown Paired t test, two-tailed Pre- vs post-spike height: Ext, AIN infusion, DTI 95% (each comparison) b Unknown Spearman correlation (with Bonferroni correction) Spiking of each cell with corresponding eyelid responses 99% (corrected for 3 bins = 99.7% CI each bin) c Unknown Bootstrap (with Bonferroni correction) Pre- vs post-Ext: eyelid responses 99% (corrected for 10 bins = 99.9% CI each bin) d Unknown Bootstrap (with Bonferroni correction) Pre- vs post-Ext: trace cells 99% (corrected for 10 bins = 99.9% CI each bin) e Unknown Bootstrap (with Bonferroni correction) Pre- vs post-Ext: persistent cells 99% (corrected for 10 bins = 99.9% CI each bin) f Unknown Bootstrap (with Bonferroni correction) Pre- vs post-muscimol: persistent cells 99% (corrected for 10 bins = 99.9% CI each bin) g Unknown Bootstrap (with Bonferroni correction) Post-Ext vs muscimol: persistent cells 99% (corrected for 10 bins = 99.9% CI each bin) h Unknown Bootstrap (with Bonferroni correction) Pre- vs post-Ext: weak feedback persistent cells 99% (corrected for 10 bins = 99.9% CI each bin) i Unknown Paired t test, two-tailed Pre- vs post-Ext: number of coactive pairs 95% j Unknown Paired t test, two-tailed Ext and control: cell pair correlations (r) 95% (each comparison) k Unknown Unpaired t test, two-tailed Ext and control: change in r values 95% l Unknown Bootstrap (with Bonferroni correction) Ext vs reacqired: persistent cells 99% (corrected for 10 bins = 99.9% CI each bin) m Unknown Bootstrap (with Bonferroni correction) Ext vs reacquired: trace cells 99% (corrected for 10 bins = 99.9% CI each bin) n Normal Paired t test, one-tailed Tr500 vs Tr750: CR onset 95% (each session) o Normal Paired t test, one-tailed Tr500 vs Tr750:
median CR onsets95% p Unknown Wilcoxon signed rank Session 1 Tr500 vs session 1 Tr750: CR rate 95% q Unknown Wilcoxon signed rank Sessions 1 vs 2 Tr750: CR rate 95% r Unknown Wilcoxon signed rank Sessions 2 vs 3 Tr750: CR rate 95% s Unknown Bootstrap (with Bonferroni correction) Tr500 vs Tr750,
>50% CRs: Persistent cells99% (corrected for 10 bins = 99.9% CI each bin) t Unknown Bootstrap (with Bonferroni correction) Baseline spike rate vs trial spike rate, Tr750 >50% CRs: persistent cells 99% (corrected for 10 bins = 99.9% CI each bin) u Unknown Paired t test, one-tailed Tr500 vs Tr750:
median CR onsets95% v Unknown Paired t test, one-tailed Tr500 vs Tr750:
median CR onsets95% w Unknown Bootstrap (with Bonferroni correction) Tr500 vs Tr750,
<50% CRs: persistent cells99% (corrected for 10 bins = 99.9% CI each bin) x Unknown Bootstrap (with Bonferroni correction) baseline spike rate vs trial spike rate, Tr750 <50% CRs: persistent cells 99% (corrected for 10 bins = 99.9% CI each bin) y Unknown Bootstrap (with Bonferroni correction) Tr500 vs Tr750, >50% CRs: weak feedback, persistent cells 99% (corrected for 10 bins = 99.9% CI each bin) z Unknown Bootstrap (with Bonferroni correction) Tr750 >50% CRs vs Tr750 <50% CRs 99% (corrected for 10 bins = 99.9% CI each bin) a' Unknown Bootstrap (with Bonferroni correction) Tr500 >50% CRs vs Tr500 <50% CRs 99% (corrected for 10 bins = 99.9% CI each bin) b' Unknown Bootstrap (with Bonferroni correction) Tr500 vs Tr750,
>50% and <50% CRs: phasic cells99% (corrected for 10 bins = 99.9% CI each bin) c' Unknown Bootstrap (with Bonferroni correction) Tr500 vs Tr750,
>50% and <50% CRs: CR feedback cells99% (corrected for 10 bins = 99.9% CI each bin) CI, Confidence interval; Tr500, Std for 500 ms; Tr750, Std for 750 ms.
In this issue


