

Article Figures & Data
Figures
- Figure 1.
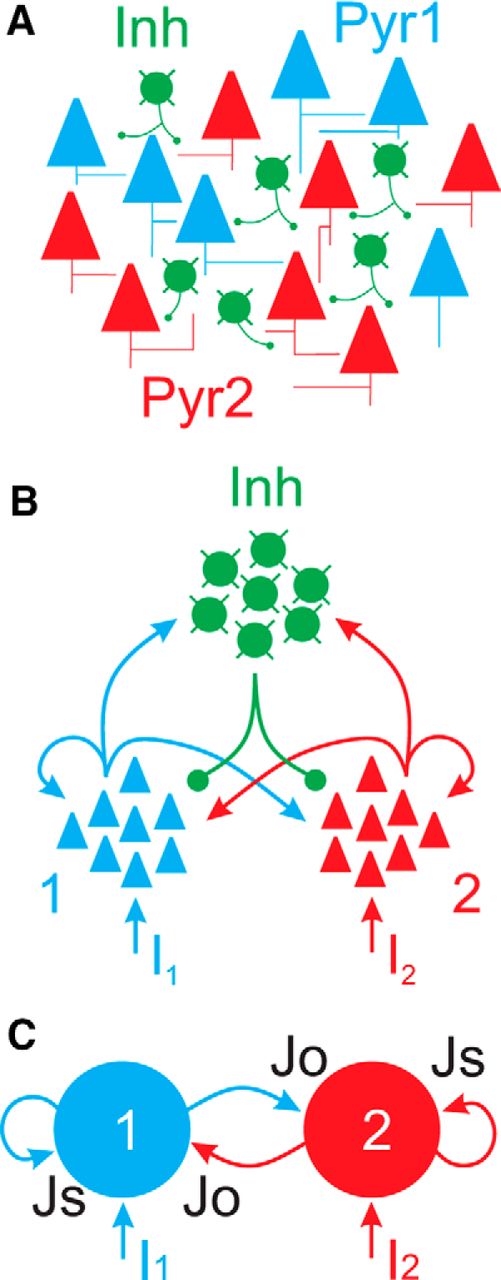
The circuit model. A, The basic anatomical circuit consists of two populations of excitatory neurons (Pyr1, Pyr2) and a single population of inhibitory neurons (Inh). In cortical circuits, these populations may be intermingled, as depicted here. B, By segregating the different populations, we highlight the major synaptic pathways. Each excitatory population projects to itself (recurrent) as well as the inhibitory and other excitatory populations. The inhibitory population receives inputs from, and projects to, both excitatory populations, providing global (within population and cross-population) inhibition. External inputs (I1, I2) are defined independently for each excitatory population. C, The population representation was further reduced to two ensembles of excitatory neurons. Inhibition is encoded in the magnitude of synaptic coupling parameters Js (self) and Jo (other).
- Figure 2.
Diverse circuit model responses to transient, coincident stimuli. A, External inputs to each ensemble (I1, I2) consisted of transient, coincidence current pulses, on top of background synaptic activity (see Materials and Methods). Transient inputs to ensemble 1 (blue) were of fixed amplitude, whereas transient inputs to ensemble 2 (red) increased from 0 to 4 × I1. B--D, Ensemble activity levels (S1, S2) in response to the above inputs, for various values of Js and Jo. B, For models with low Js and low Jo, network responses are transient and largely independent. C, For models with mid-Js and high Jo, network responses are transient, yet with strong cross-suppression. The asterisk depicts functionally equal cross-suppression, whereas the arrowheads depict functionally asymmetric cross-suppression, in which the ensemble with higher activity is preferentially suppressing the ensemble with lower activity. D, For models with high Js and high Jo, network responses are sustained with extreme cross-suppression. Arrows depict instances in which transient inputs produced sustained, winner-take-all transitions.
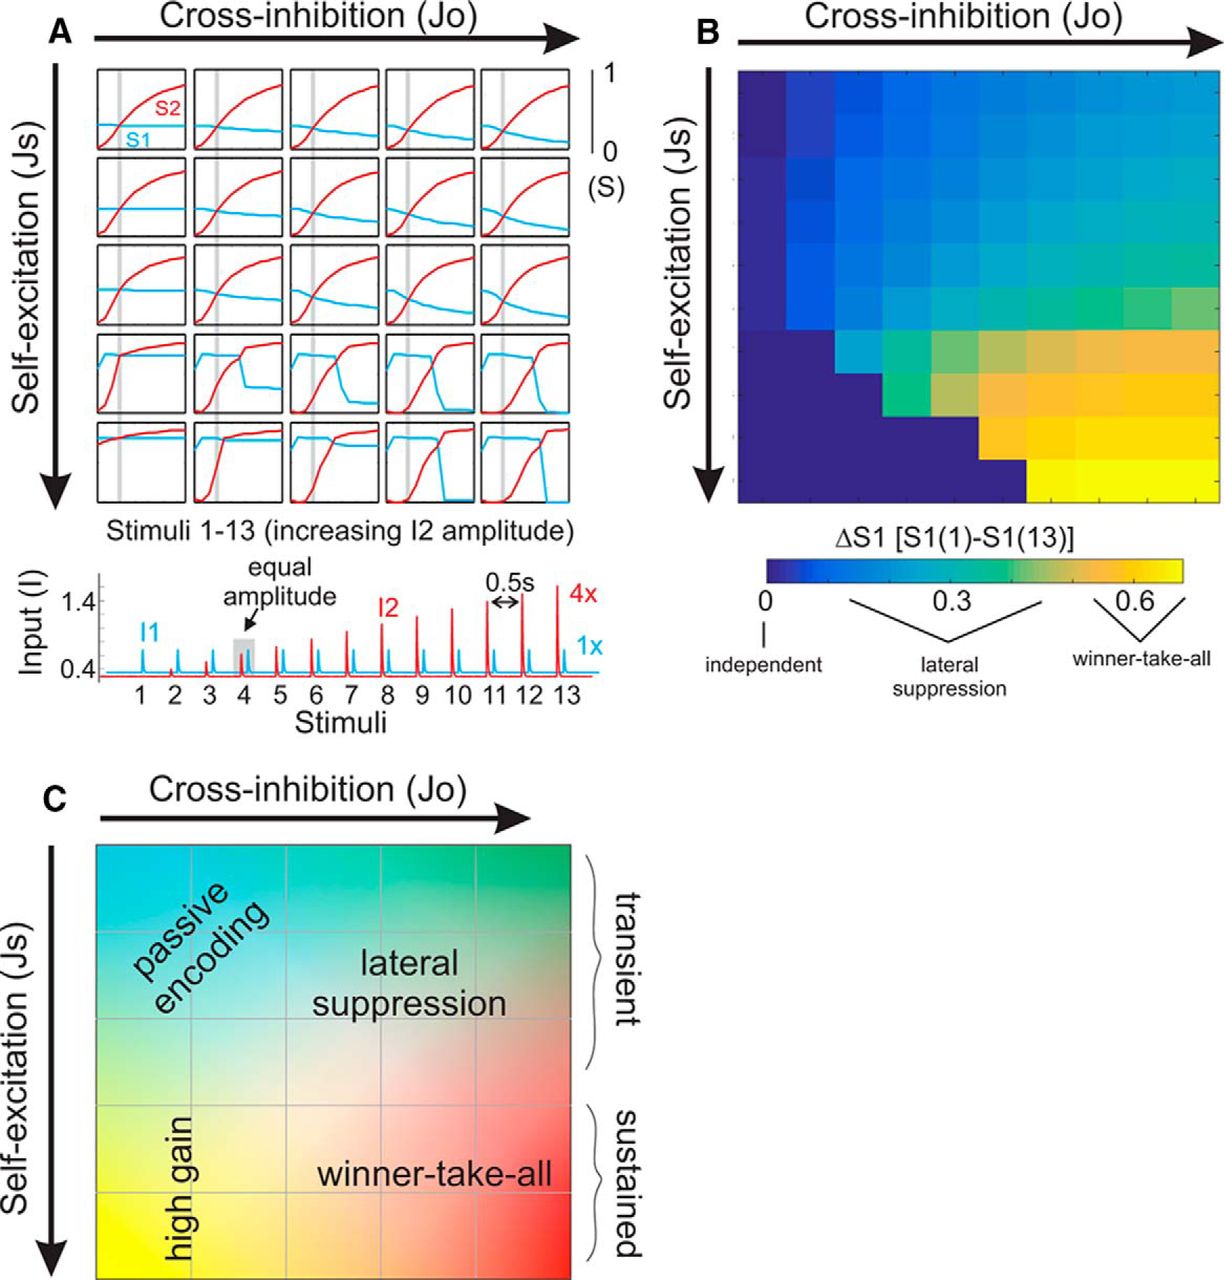
- Figure 3.
Patterns of cross-suppression across a wide range of values for synaptic coupling parameters Js and Jo. A, Top, Plot of peak responses of both ensembles for each of the transient stimuli. The trajectories of S2 reflect both increasing stimulus amplitude and intrinsic circuit dynamics. As the transient inputs to ensemble 1 (I1) are equivalent throughout this simulation, differences in S1 trajectories reflect changes in circuit dynamics alone. The gray bar in each plot refers to the condition in which I1 = I2. For some simulations, we find that the S1 and S2 plots intersect at this point. For other simulations, the point of intersection is shifted rightward, indicating a dependence on previous activity. Bottom, Extended stimulus series used to generate the above data. B, Quantification of cross-suppression, as the difference in S1 from the first compared to the last stimulus (ΔS1). C, Illustration summarizing the functional regimes accessible through parameterization of our circuit model. Changing self-excitation and cross-inhibition produces a family of functional circuits with diverse input–output response properties. Indication of “transient” versus “sustained” regimes are based on simulations as shown in Figure 2.
- Figure 4.
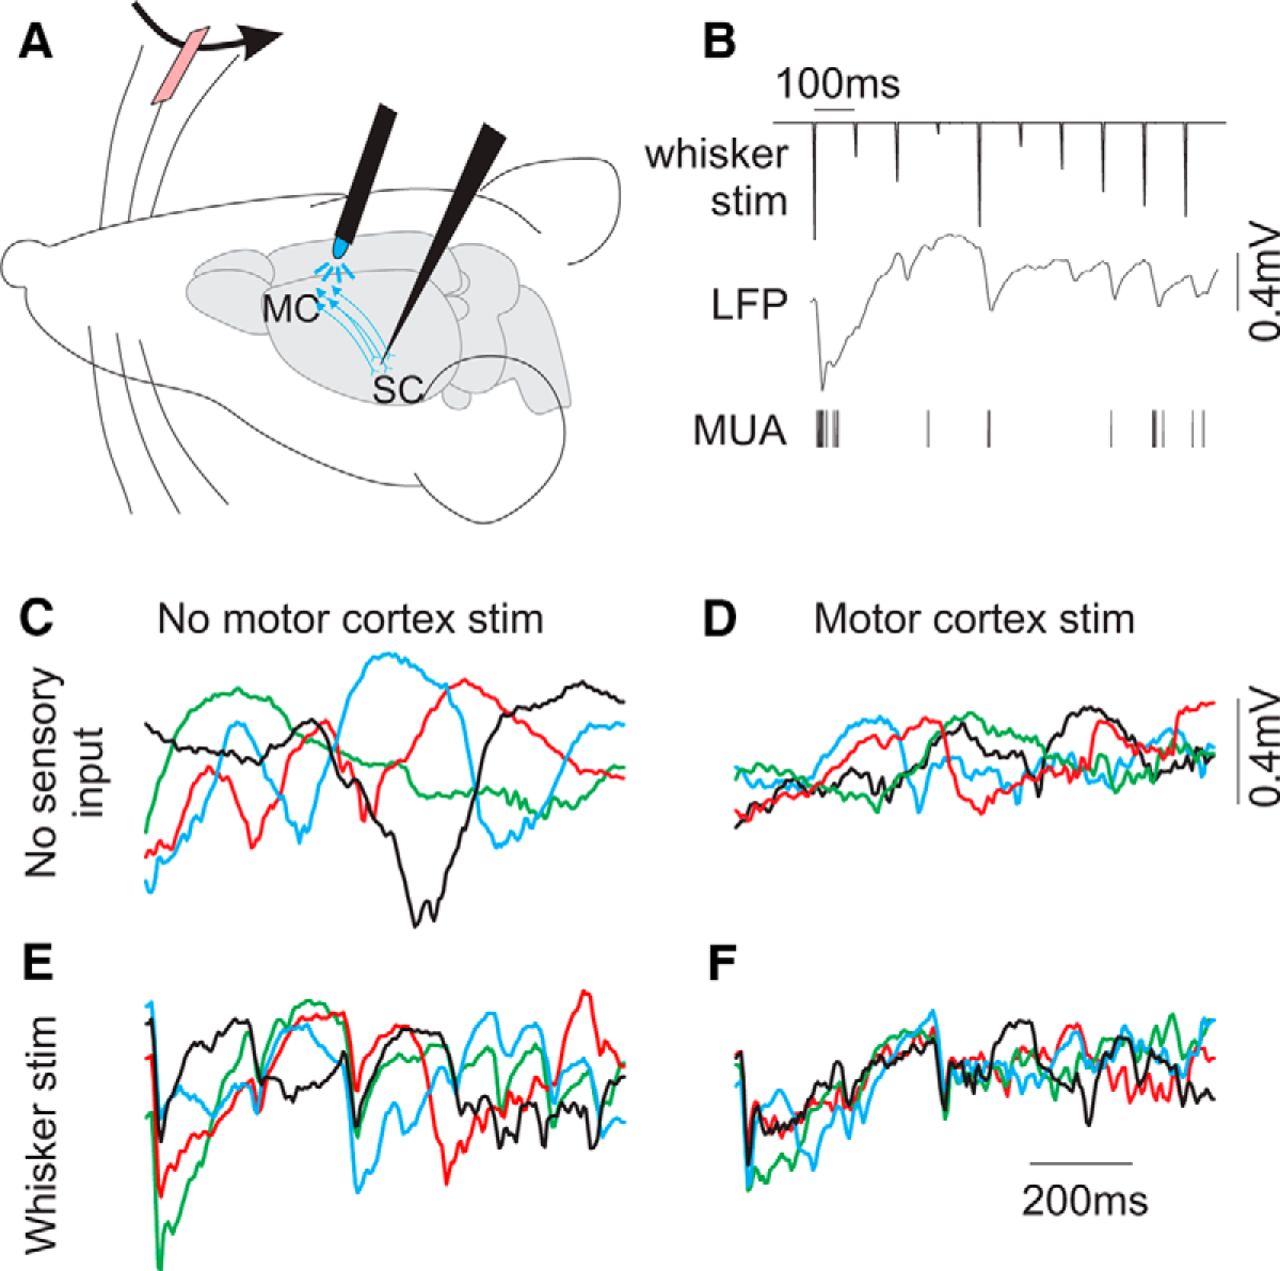
Probing the effects of top-down cortical feedback on sensory responses. A, Schematic of the experimental design. ChR2 was expressed in MCtx neurons, and stimulated by light application in the MCtx. The neurons in blue depict the cortical feedback pathway. In the contralateral whisker field, a single whisker was deflected by a piezo-controlled paddle. Cortical feedback and whisker sensory responses were recorded in primary SCtx. B, Top, Example of a whisker stimulus pattern, consisting of a series of rapid deflections of varying amplitude. Bottom, Example single-trial population activity recorded in SCtx, in response to the above stimulus. C–F, LFP signals overlaid from four trials of each condition: spontaneous activity (C), MCtx stimulation alone (D), whisker stimulation alone (E), and MCtx and whisker stimulation combined (F). Note that during MCtx stimulation, LFP signals in the SCtx show reduced-amplitude low-frequency activity (compare C, D). When paired with whisker stimulation, MCtx stimulation results in reduced in TbT variability, reduction of slow (>100 ms) dynamics, and increased resemblance to the whisker stimulus inputs (compare E, F).
- Figure 5.
Quantification of sensory response modulation by cortical feedback activation. A, For LFP signals, single-trial responses were cross-correlated with the whisker stimulus input. Shown here is the average cross-correlation function from one recording session, for conditions of whisker stimulation alone (control, black) and combined MCtx and whisker stimulation (MCtx stim, blue). Input–output amplitude (I–O amp) and tau (I–O tau) refer to the peak correlation amplitude and decay, respectively. B, For MUA signals, we plotted the normalized, cumulative spiking aligned to all transient whisker stimuli, and determined T50. The 10 ms offset accounts for sensory conduction delays. C–G, Population data for measurements of sensory response reliability (C, D), temporal precision (E, F), and response amplitude (G; black, control; blue, MCtx stim).
- Figure 6.
Diverse circuit model responses to slow oscillatory stimuli. A–D, Average ensemble activity [(S1 + S2)/2] in response to 2 Hz sinusoidal inputs. Equivalent sinusoidal inputs were applied to both ensembles. Each panel shows overlapping responses to four trials, in which the phase of the sine wave inputs differed on each trial. Note that different circuit models differentially amplify the same sinusoidal inputs. Simulations (B–D) refer to differences in model parameters compared to A. B, Increased background synaptic activity I(DC). C, Increased self-excitation (Js). D, reduced self-excitation (Js) and enhanced cross-inhibition (Jo). E, 2 Hz power in the average ensemble activity, from models with varying Js and Jo, in response to 2 Hz sinusoidal inputs.
- Figure 7.
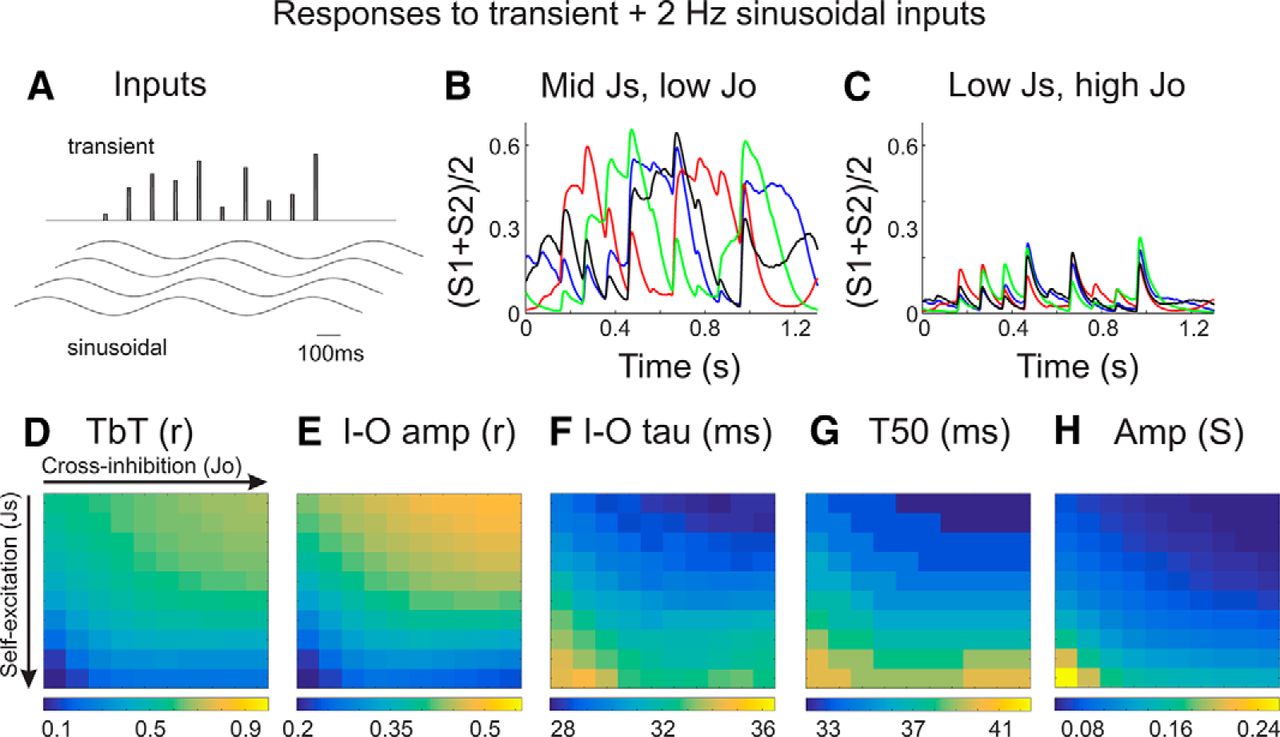
Circuit model responses to slow (spontaneous-like) and rapid (sensory-like) inputs. A, Transient and sinusoidal inputs used in these simulations. The two ensembles received identical sinusoidal inputs and proportional transient inputs (see Materials and Methods). Each trial began with a different phase of the sinusoidal input. B, C, Examples of average ensemble activities ([S1 + S2]/2) overlaid from four different trials. Notice that the responses of the model in C appear to have higher TbT reliability, reduced slow (>100 ms) dynamics, and greater resemblance to the transient inputs. D–H, Quantification of input–output response reliability (D, E), temporal precision (F, G), and response amplitude (H) from models with varying Js and Jo. Highest reliability (TbT r and I-O amp) and most rapid dynamics (I–O tau and T50) are observed in models with low self-excitation and high cross-inhibition.
- Figure 8.
Circuit model responses to rapid (sensory-like) inputs alone. A, Inputs used in these simulations, consisting of the transient inputs only. B, C, Examples of average ensemble activities [(S1 + S2)/2] overlaid from four different trials. Notice the highly reduced TbT variability compared to traces in Figure 7B,C. D–H, Quantification of input–output response reliability (D, E), temporal precision (F, G), and response amplitude (H), from models with varying Js and Jo. Scale bars in D–H are the same as scale bars in Figure 7D–H. Removing the sinusoidal inputs results in near-maximal TbT reliability and elevated I–O amp for all models (compare Figs. 7D,E, 8D,E). However, removing sinusoidal inputs alone does not account for increased temporal precision (compare Figs. 7F,G, 8F,G). The bottom plot in D depicts TbT reliability measurements, rescaled to show the dynamic range for this set of simulations. Even though correlation values are high (>0.95) for all models, synaptic weights still do modulate TbT reliability in this restricted range in the absence of the sine-wave inputs.


Tables
Graph Type of test Statistical values a. Figure 5C Paired t test, two-tailed t(6) = 3.99, p = 0.00716 b. Figure 5D Paired t test, two-tailed t(6) = 4.24, p = 0.00542 c. Figure 5E Paired t test, two-tailed t(6) = 4.00, p = 0.00711 d. Figure 5F Paired t test, two-tailed t(6) = 3.84, p = 0.0086 e. Figure 5G Paired t test, two-tailed t(6) = 6.06, p = 0.000914
In this issue


