

Article Figures & Data
Figures
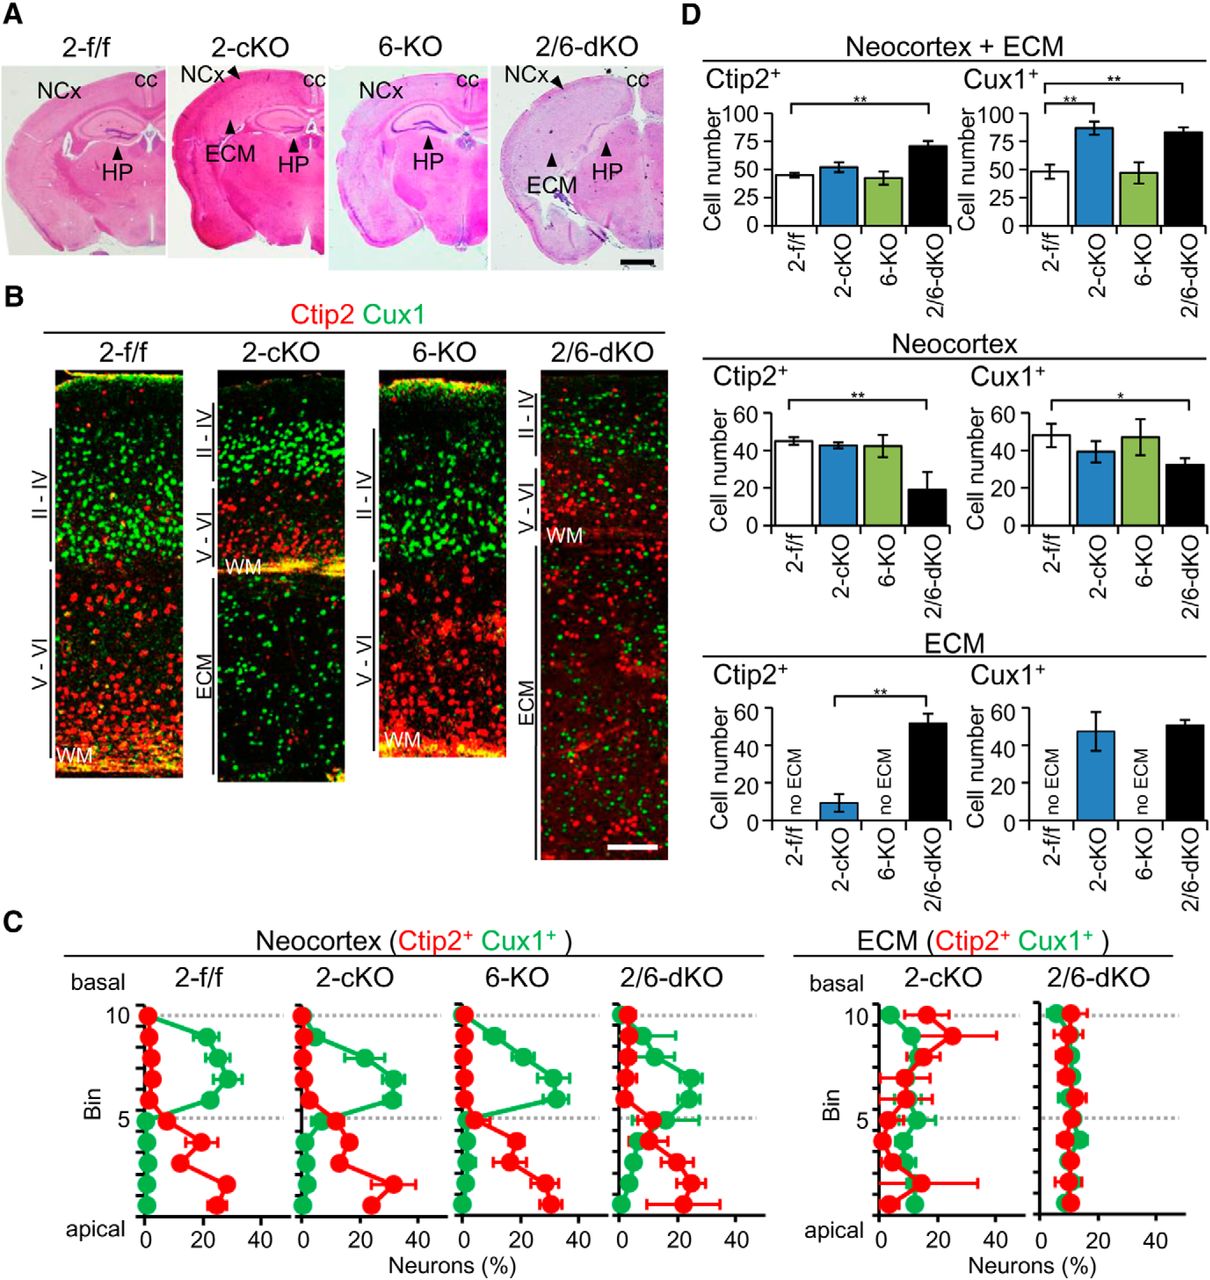
- Figure 1.
Effects of the genotypes of Rapgef2 and Rapgef6 on the cortical structure at P90. A, H&E staining of the coronal sections of the brains of Rapgef2-f/f (2-f/f), Rapgef2-cKO (2-cKO), Rapgef6-KO (6-KO), and Rapgef2/6-dKO (2/6-dKO) mice. Representative specimens derived from six mice of each group are shown. The neocortex with the six-layered structure (NCx), hippocampus (Hp), corpus callosum (cc), and ECM are indicated. Scale bars, 2 mm. B, Immunohistological staining of the neocortex and ECM. Sections prepared as in A were immunostained for Ctip2 (red) and Cux1 (green). Representative specimens derived from six mice of each group are shown. WM, White matter. Scale bars, 100 µm. C, D, Distributions of Ctip2+ and Cux1+ neurons in the neocortex and ECM. Sections stained as in B were used for the quantification of Ctip2+ neurons (red) and Cux1+ neurons (green), residing in each bin, as described in Materials and Methods (C), and the neurons contained in a total of 10 bins (100 μm in width) were counted as described in Materials and Methods (D). Data are expressed as the mean ± SD derived from six mice of each genotype. Student’s t test: *p < 0.05, **p < 0.01.
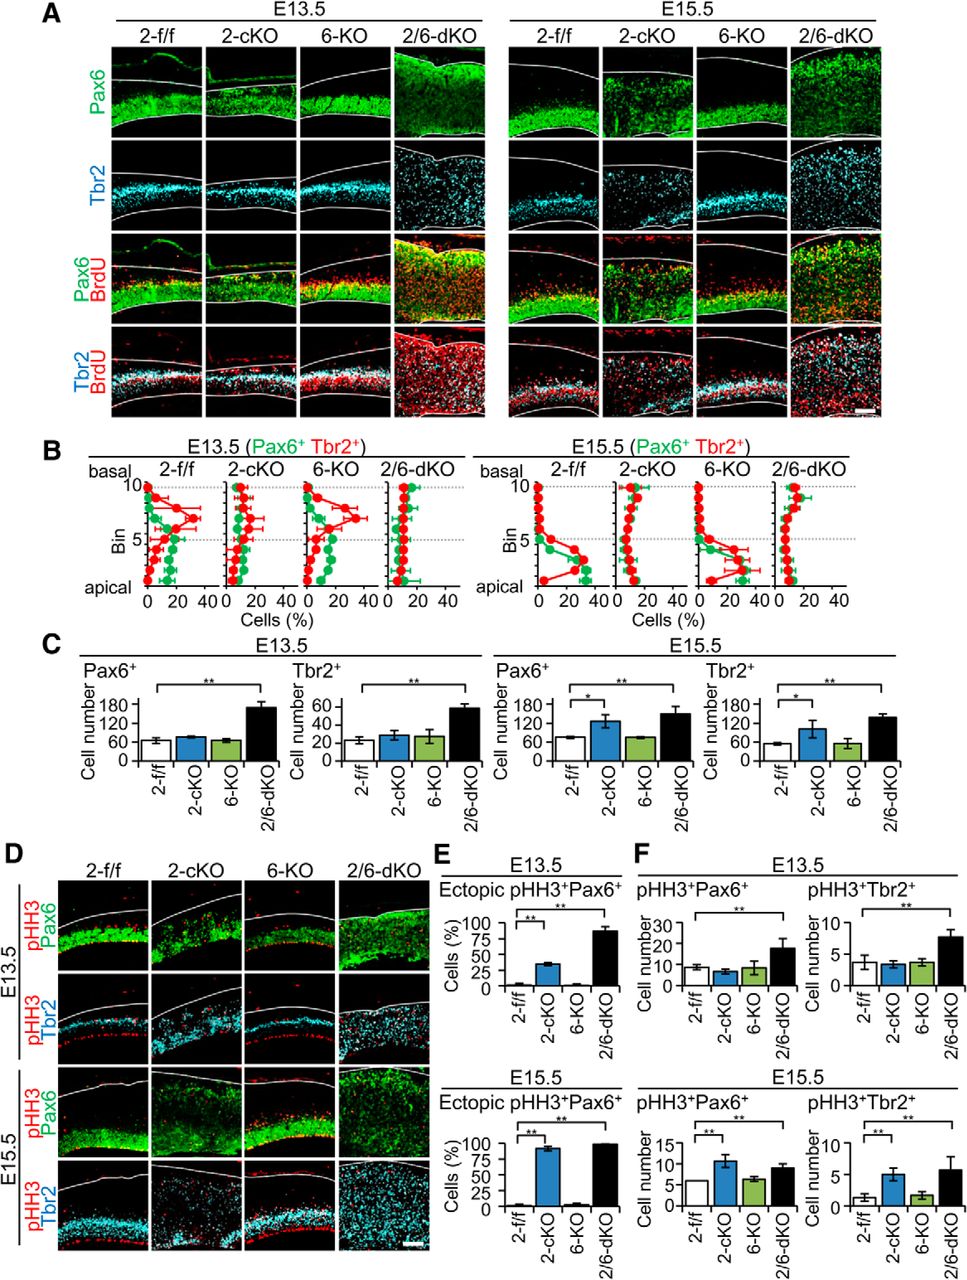
- Figure 2.
Effects of the genotypes of Rapgef2 and Rapgef6 on the distribution of neural progenitor cells. A, Immunohistological detection of Pax6+ cells, Tbr2+ cells, and BrdU-labeled S-phase cells. Coronal sections of the brains of Rapgef2-f/f (2-f/f), Rapgef2-cKO (2-cKO), Rapgef6-KO (6-KO), and Rapgef2/6-dKO (2/6-dKO) embryos at E13.5 and E15.5, which had been subjected to BrdU labeling, were subjected to immunostaining for Pax6 (green), Tbr2 (cyan), and BrdU (red). Pial and apical surfaces of the cortices are indicated by white lines. The images are representative of four biological replicates of each group. Scale bars, 100 µm. B, C, Distribution of Pax6+ cells and Tbr2+ cells in the cerebral cortices. Brain sections prepared and stained as in A were subjected to the quantification of Pax6+ cells (green lines) and Tbr2+ cells (red lines) residing in each bin, as described in Materials and Methods (B). Data are expressed as mean ± SD values derived from at least four biological replicates. The progenitors contained in a total of 10 bins (100 μm in width) were counted as described in Materials and Methods (C). Data are expressed as the mean ± SD values derived from four mice of each genotype. Student’s t test: *p < 0.05, **p < 0.01. D, Immunohistological detection of Pax6+ cells, Tbr2+ cells, and pHH3+ metaphase cells. Brain sections prepared as in A were subjected to immunostaining for Pax6 (green), Tbr2 (cyan), and pHH3 (red). Pial surfaces are indicated by white lines. The images are representative of four biological replicates of each group. Scale bars, 100 µm. E, F, Ectopic localization of Pax6+ and Tbr2+ metaphase cells. The percentages of the ectopically localized somata of pHH3+/Pax6+ cells in the total pHH3+/Pax6+ cells contained in the 10 bins (100 μm in width) were determined using the immunostained sections described in D (E). Also, pHH3+/Pax6+ cells and pHH3+/Tbr2+ cells in a total of 10 bins (100 μm in width) were counted. Data are expressed as the mean ± SD values derived from four mice of each genotype. Student’s t test: **p < 0.01.
- Figure 3.
Expression of Rapgef2 and Rapgef6 in the E13.5 and E15.5 brains. A, Immunohistological detection of Rapgef2 and Rapgef6. Coronal sections of the brains of Rapgef2-f/f (2-f/f), Rapgef2-cKO (2-cKO), and Rapgef6-KO (6-KO) embryos at E13.5 and E15.5 were subjected to immunostaining for Rapgef2 or Rapgef6 (red) and 4',6-diamidino-2-phenylindole (DAPI; blue). Scale bars, 100 µm. B, Preferential expression of Rapgef2 and Rapgef6 on the apical surfaces. Coronal sections of the brains of the E13.5 and E15.5 embryos with the indicated genotypes were subjected to immunostaining for Rapgef2 or Rapgef6 (green), β-catenin (red), and DAPI (blue). The images are representative of four biological replicates of each group. Scale bars, 20 µm.
- Figure 4.
Effects of the genotypes of Rapgef2 and Rapgef6 on the apical surface structures. A, B, Immunohistological detection of proteins constituting the AJs. A, B, Coronal sections of the brains of Rapgef2-f/f (2-f/f), Rapgef2-cKO (2-cKO), Rapgef6-KO (6-KO), and Rapgef2/6-dKO (2/6-dKO) embryos at E13.5 (A) and E15.5 (B) were subjected to immunostaining for β-catenin (β-cat.), N-cadherin (N-cad.), E-cadherin (E-cad.), afadin, and ZO-1, as indicated. The leftmost panels are phase contrast images with a lower magnification. The images are representative of four biological replicates of each group. Scale bars: leftmost panels, 100 µm; other panels, 10 µm.
- Figure 5.
Effects the genotypes of Rapgef2 and Rapgef6 on RG fiber organization and neuronal migration. A, Morphology of RG fibers. Coronal sections of the brains of Rapgef2-f/f (2-f/f), Rapgef2-cKO (2-cKO), Rapgef6-KO (6-KO), and Rapgef2/6-dKO (2/6-dKO) embryos at E13.5 and E15.5 were subjected to immunostaining for nestin. The images are representative of three biological replicates of each group. Scale bars, 50 µm. B, Morphology of ectopically located GFP-labeled cells. RGCs lining the apical surface of the 2-f/f and 2-cKO cortices were labeled with GFP by IUE of pCAG-EGFP-F at E14.5, and the morphology of their progenies was analyzed at E15.5 by immunohistological staining for GFP (green) and Pax6 (red). GFP+/Pax6+ RGCs are indicated by arrowheads. The apical and pial surfaces of the telencephalon were indicated by white broken lines. The images are representative of four biological replicates of each group. Scale bars: 20 µm C, Localization of Ctip2+ neurons. Coronal sections of the brains of the E13.5 and E15.5 embryos with the indicated genotypes were subjected to immunostaining for Ctip2 (red) and DAPI (blue). The images are representative of three biological replicates of each group. Scale bars, 50 µm.
- Figure 6.
Phenotypes of Cre-mediated Rapgef2 knockout and compensatory effects of artificial Rap1 expression. A, Efficient knockout of Rapgef2 by introduction of Cre recombinase. Rapgef2-f/f (2-f/f) embryos at E14.5 were subjected to IUE-mediated transduction of pCAG-NLS-Cre and pCAG-FloxP-EGFP-N1 (Cre/cEGFP). As controls, Rapgef2-cKO (2-cKO), and Rapgef2-f/f embryos at E14.5 were subjected to IUE-mediated transduction of CAG=EGFP (EGFP). Coronal sections of the brains of Cre/cEGFP and EGFP/Rapgef2-f/f embryos at E16.5 were subjected to immunostaining for GFP (green) and Rapgef2 (red), as indicated. GFP+ cells apparently lacking Rapgef2 expression are indicated by arrowheads. The images are representative of four biological replicates of each group. Scale bars, 20 µm. B, C, Zonal distribution of GFP-labeled cells and their neural progenitor markers. The sections prepared as in A were subjected to immunostaining for GFP (green), Pax6 (red), and Tbr2 (purple; B). The images are representative of four biological replicates of each group. Scale bars, 50 µm. The percentages of GFP+ cells located in the VZ, SVZ, and IZ/CP (left), and those displaying Pax6−/Tbr2− (D.N.), Pax6+, and Tbr2+ markers (right) are shown as mean ± SD values derived from four each of EGFP/Rapgef2-ff (white bars) and Cre/cEGFP (purple bars) embryos (C). Student’s t test: *p < 0.05, **p < 0.01. D, Disruption of the apical surface structures by Cre-mediated Rapgef2 knockout. The sections prepared as in A were subjected to immunostaining for GFP (green), afadin (red), and Pax6 (blue), as indicated. The images are representative of four biological replicates of each group. Arrowheads indicate the end feet of the apical fibers of GFP-labeled RGCs on the apical surface. Scale bars, 50 µm. E, F, Effects of the overexpression of constitutively active Rap1 on zonal distribution of GFP-labeled cells and their neural progenitor markers. pCAG-Myc-Rap1WT (Rap1WT), pCAG-Myc-Rap1G12V (Rap1G12V), or pCAG-Myc (Vector) were cotransduced by IUE with pCAG-NLS-Cre and pCAG-FloxP-EGFP-N1 into Rapgef2-f/f (2-f/f) embryos at E14.5. Coronal sections of the brains at E16.5 were subjected to immunostaining for GFP (green), Pax6 (red), and Tbr2 (purple), as indicated (E). The images are representative of three biological replicates of each group. Scale bars, 50 µm. The percentages of GFP+ cells located in the VZ, SVZ, and IZ/CP (left) and those displaying Pax6−/Tbr2− (D.N.), Pax6+, and Tbr2+ markers (right) are shown as mean ± SD values derived from three each of mice cotransduced with pCAG-Myc (purple bars), pCAG-Myc-Rap1WT (yellow bars), and pCAG-Myc-Rap1G12V (red bars; F). Student’s t test: **p < 0.01. G, Effects of Rap1 overexpression on the apical surface structures of Cre-mediated Rapgef2 knockout. The sections prepared as in E were subjected to immunostaining for GFP (green), ZO-1 (red), and Myc (blue), as indicated. The images are representative of three biological replicates of each group. Arrowheads indicate the end feet of the apical fibers of GFP-labeled cells on the apical surface. Scale bars, 50 µm.
- Figure 7.
Effects of Rapgef2 knockout on the morphology and migration of neurons. A, B, Effects of Rapgef2 knockout on neuronal migration observed at P7. Rapgef2-f/f (2-f/f) embryos at E14.5 were subjected to IUE-mediated transduction of pCAG-NLS-Cre and pCAG-FloxP-EGFP-N1 (Cre/cEGFP). As controls, Rapgef2-cKO (2-cKO) and Rapgef2-f/f embryos at E14.5 were subjected to IUE-mediated transduction of CAG=EGFP (EGFP). Coronal sections of the brains at P7 were subjected to immunostaining for GFP (green), Cux1 (red), Ctip2 (red), and DAPI (blue), as indicated (A). Due to the nuclear localizing nature of EGFP, double staining with Cux1 or Ctip2 is recognizable only in the nuclei. Images shown are representative of four biological replicates of each group. Layers II–IV and V–VI and the ECM are indicated. The apical surfaces of the cortices are indicated by white lines. Scale bars, 100 µm. B, The percentages of GFP+ cells located in thelayers II–IV, V and VI and the ECM (left), and those displaying Cux1+, Ctip2+, and Cux1−/Ctip2− (D.N.) markers (right) are shown as mean ± SD values derived from eight EGFP/Rapgef2-f/f embryos (white bars), four EGFP/Rapgef2-cKO embryos (blue bars), and four Cre/EGFP embryos (purple bars). C, Morphology of GFP+/Cux1+ neurons located in the ECM of the Rapgef2-cKO embryo at P7. A brain section of the EGFP/Rapgef2-cKO embryo prepared as in A was subjected to immunostaining for GFP (green) and Cux1 (red). Right, A magnified image of the area surrounded by a broken line. Scale bars, 50 µm. D, Effects of Cre-mediated Rapgef2 knockdown on neuronal migration observed at E18.5. Coronal sections of the brains were prepared at E18.5 from the Cre/EGFP and EGFP/Rapgef2-f/f embryos generated by IUE at E14.5 as described in A and subjected to immunostaining for GFP (green) and DAPI (blue). The images are representative of four biological replicates of each group. The apical surfaces of the cortices are indicated by white lines. Scale bars, 100 µm. E, Morphology of GFP+ cells located in the IZ at E18.5. The brain sections of the E18.5 Cre/EGFP and EGFP/Rapgef2-f/f embryos IUE were subjected to immunostaining for GFP (green), Pax6 (red), and Tbr2 (blue). E, Left panels (a–c) are magnified images of the corresponding areas surrounded by broken lines. Scale bars, 50 µm.
- Figure 8.
Distribution of neurons derived from neural progenitors labeled by BrdU at E15.5. Neural progenitors in E15.5 Rapgef2-f/f (2-f/f) and Rapgef2-cKO (2-cKO) embryos were labeled by BrdU, and neurons derived from them were detected by immunohistological staining for BrdU at P0. Nuclei were stained with DAPI. Layers II–IV and V–VI, and the ECM are indicated. Images shown are representative of four biological replicates of each group. Scale bars, 100 μm.


In this issue


