
Main menu

  • HOME
  • CONTENT
    • Early Release
    • Featured
    • Current Issue
    • Issue Archive
    • Blog
    • Collections
    • Podcast
  • TOPICS
    • Cognition and Behavior
    • Development
    • Disorders of the Nervous System
    • History, Teaching and Public Awareness
    • Integrative Systems
    • Neuronal Excitability
    • Novel Tools and Methods
    • Sensory and Motor Systems
  • ALERTS
  • FOR AUTHORS
  • ABOUT
    • Overview
    • Editorial Board
    • For the Media
    • Privacy Policy
    • Contact Us
    • Feedback
  • SUBMIT

User menu

Search

  • Advanced search
eNeuro

eNeuro

Advanced Search


  • HOME
  • CONTENT
    • Early Release
    • Featured
    • Current Issue
    • Issue Archive
    • Blog
    • Collections
    • Podcast
  • TOPICS
    • Cognition and Behavior
    • Development
    • Disorders of the Nervous System
    • History, Teaching and Public Awareness
    • Integrative Systems
    • Neuronal Excitability
    • Novel Tools and Methods
    • Sensory and Motor Systems
  • ALERTS
  • FOR AUTHORS
  • ABOUT
    • Overview
    • Editorial Board
    • For the Media
    • Privacy Policy
    • Contact Us
    • Feedback
  • SUBMIT
PreviousNext
Research ArticleNew Research, Sensory and Motor Systems

Rank Order Coding: a Retinal Information Decoding Strategy Revealed by Large-Scale Multielectrode Array Retinal Recordings

Geoffrey Portelli, John M. Barrett, Gerrit Hilgen, Timothée Masquelier, Alessandro Maccione, Stefano Di Marco, Luca Berdondini, Pierre Kornprobst and Evelyne Sernagor
eNeuro 12 May 2016, 3 (3) ENEURO.0134-15.2016; DOI: https://doi.org/10.1523/ENEURO.0134-15.2016
Geoffrey Portelli
1Biovision Team, Inria Sophia Antipolis Méditerranée, FR-06902, Sophia Antipolis, France
  • Find this author on Google Scholar
  • Find this author on PubMed
  • Search for this author on this site
John M. Barrett
2Faculty of Medical Sciences, Institute of Neuroscience, Newcastle University, Newcastle-upon-Tyne NE2 4HH, United Kingdom
  • Find this author on Google Scholar
  • Find this author on PubMed
  • Search for this author on this site
  • ORCID record for John M. Barrett
Gerrit Hilgen
2Faculty of Medical Sciences, Institute of Neuroscience, Newcastle University, Newcastle-upon-Tyne NE2 4HH, United Kingdom
  • Find this author on Google Scholar
  • Find this author on PubMed
  • Search for this author on this site
  • ORCID record for Gerrit Hilgen
Timothée Masquelier
3 INSERM, U968, Paris, F-75012, France
4Sorbonne Universités, UPMC Univ Paris 06, UMR S 968, Institut de la Vision, Paris, F-75012, France
5 CNRS, UMR 7210, Paris, F-75012, France
6Present address: CERCO UMR 5549, CNRS – Université de Toulouse, F-31300, France
  • Find this author on Google Scholar
  • Find this author on PubMed
  • Search for this author on this site
  • ORCID record for Timothée Masquelier
Alessandro Maccione
7NetS3 Laboratory, Neuroscience and Brain Technologies Dpt., Istituto Italiano di Tecnologia, Genova, Italy.
  • Find this author on Google Scholar
  • Find this author on PubMed
  • Search for this author on this site
Stefano Di Marco
7NetS3 Laboratory, Neuroscience and Brain Technologies Dpt., Istituto Italiano di Tecnologia, Genova, Italy.
  • Find this author on Google Scholar
  • Find this author on PubMed
  • Search for this author on this site
Luca Berdondini
7NetS3 Laboratory, Neuroscience and Brain Technologies Dpt., Istituto Italiano di Tecnologia, Genova, Italy.
  • Find this author on Google Scholar
  • Find this author on PubMed
  • Search for this author on this site
  • ORCID record for Luca Berdondini
Pierre Kornprobst
1Biovision Team, Inria Sophia Antipolis Méditerranée, FR-06902, Sophia Antipolis, France
  • Find this author on Google Scholar
  • Find this author on PubMed
  • Search for this author on this site
Evelyne Sernagor
2Faculty of Medical Sciences, Institute of Neuroscience, Newcastle University, Newcastle-upon-Tyne NE2 4HH, United Kingdom
  • Find this author on Google Scholar
  • Find this author on PubMed
  • Search for this author on this site
  • ORCID record for Evelyne Sernagor
  • Article
  • Figures & Data
  • Info & Metrics
  • eLetters
  • PDF
Loading

Article Figures & Data

Figures

  • Figure1
    • Download figure
    • Open in new tab
    • Download powerpoint
  • Figure 1.
    • Download figure
    • Open in new tab
    • Download powerpoint
    Figure 1.

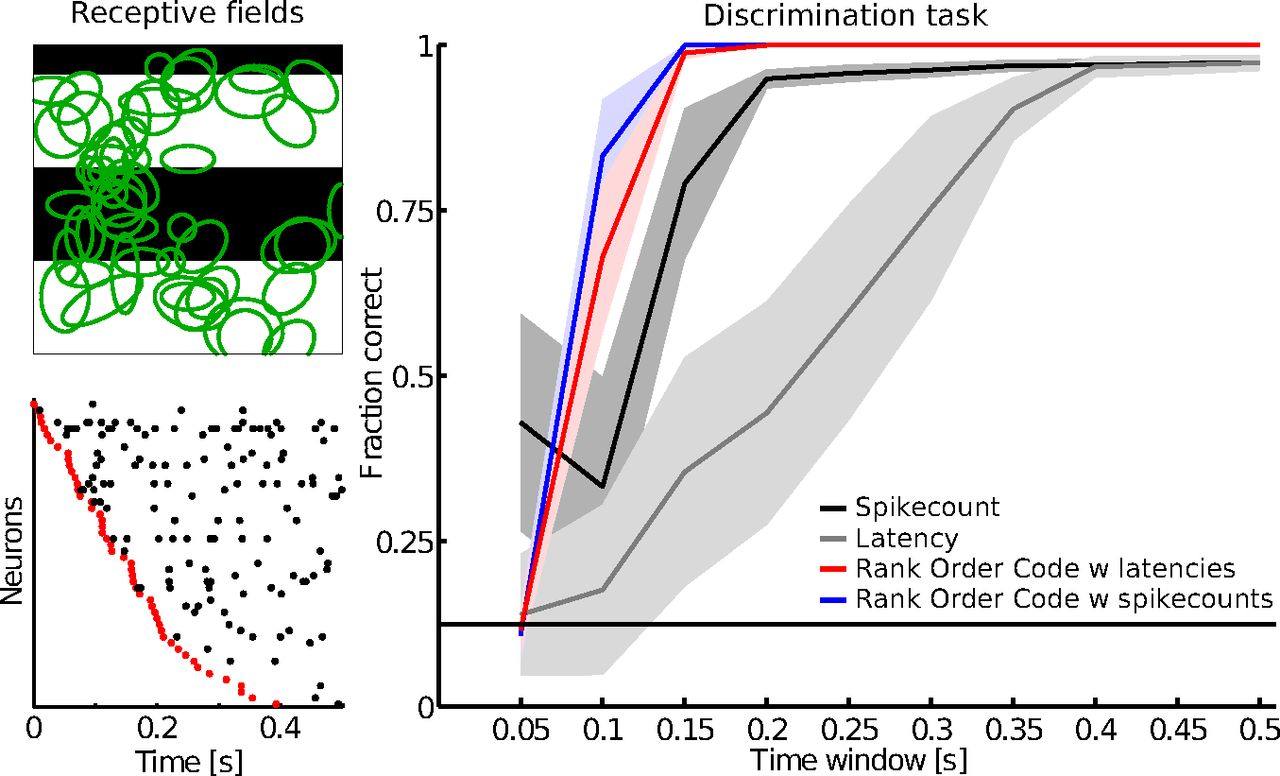
    Typical RGC responses of the dataset D1 to flashed gratings of spatial frequency 37 mcpd and different phases. Colored ellipses superimposed on grating images show the estimated receptive fields of the chosen RGCs. For each RGC chosen, 105 repetitions recorded with the 4096 APS CMOS MEA are plotted from 0 s (stimulus onset) to 0.5 s. We found no RGC exhibiting a clear latency tuning to the grating phase. However, a clear modulation of the RGC spike count with the grating phase can be observed for some cells.

  • Figure 2.
    • Download figure
    • Open in new tab
    • Download powerpoint
    Figure 2.

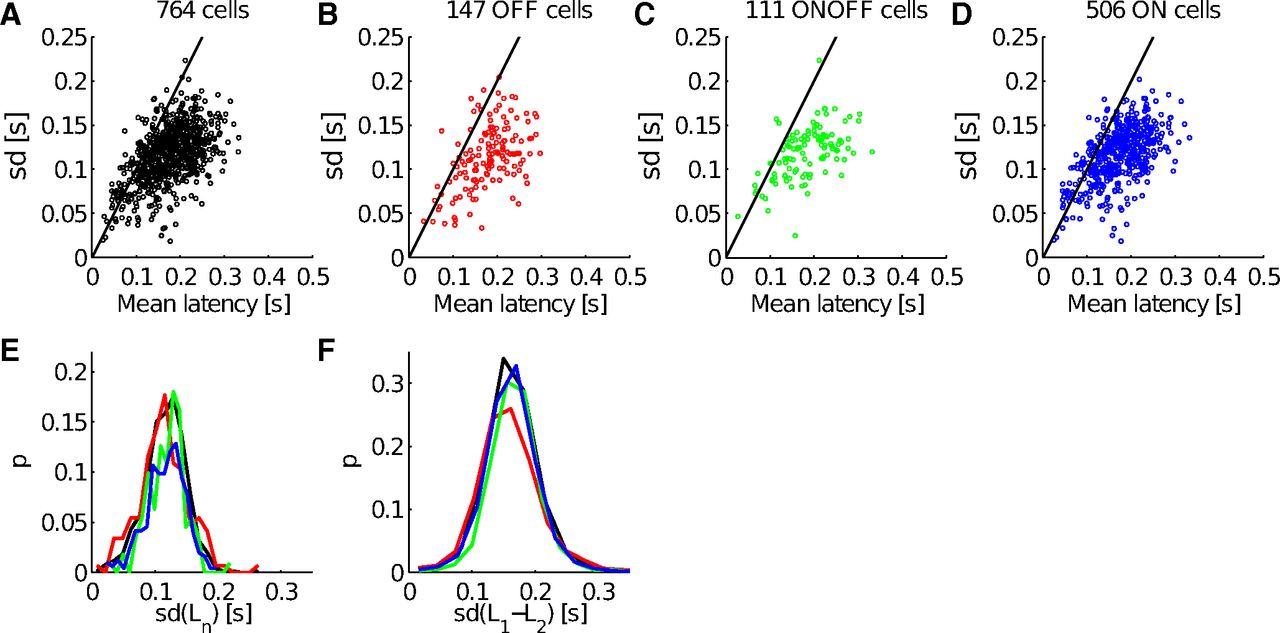
    Latency variability. A–F, Considering stimulus 17 (φ = 0°, 37mcpd). A, The SD is plotted as a function of the mean latency over the 105 repetitions, for all 764 RGCs of the dataset D1, for (B) only the 147 OFF cells, for (C) only the 111 ON-OFF cells, or for (D) only the 506 ON cells (see Materials and Methods for the classification method). The black line corresponds to a SD that is equal to the mean latency. This shows the considerable variability of individual latencies. E, The probability distribution of the individual latency SD for all cells (black), OFF cells (red), ON-OFF cells (green), and ON cells (blue). F, The probability distribution of the SD of latency difference for all cell pairs (black), OFF cell pairs (red), ON-OFF cells pairs (green), and ON cell pairs (blue).

  • Figure 3.
    • Download figure
    • Open in new tab
    • Download powerpoint
    Figure 3.

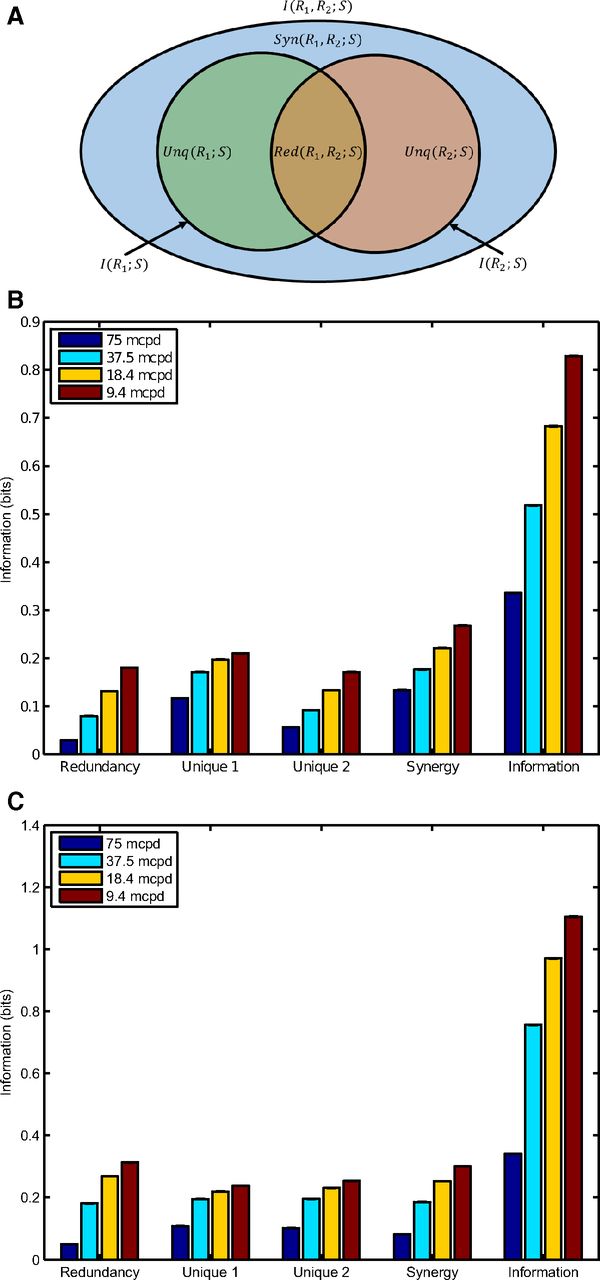
    A, Partial information diagram for two variables, based on Williams and Beer (2010), their Figure 1. The two inner circles represent the mutual information between two variables, R1 and R2, considered separately, and a third variable S. Where they overlap is the redundant information; where they do not is the unique information provided by each. The outer ellipse represents the mutual information between the pair (R1,R2) and S. The area not covered by the inner circles is the synergistic information. Decomposition of the information using PID for (B) dataset D1 and (C) dataset D2. The histograms show the amount of redundant, unique, and synergistic information for the four different spatial frequencies (9, 18, 37, and 75 mcpd). Error bars show standard error on the mean (SEM), but due to the large number of pairs sampled they are too small to be visible.

  • Figure 4.
    • Download figure
    • Open in new tab
    • Download powerpoint
    Figure 4.

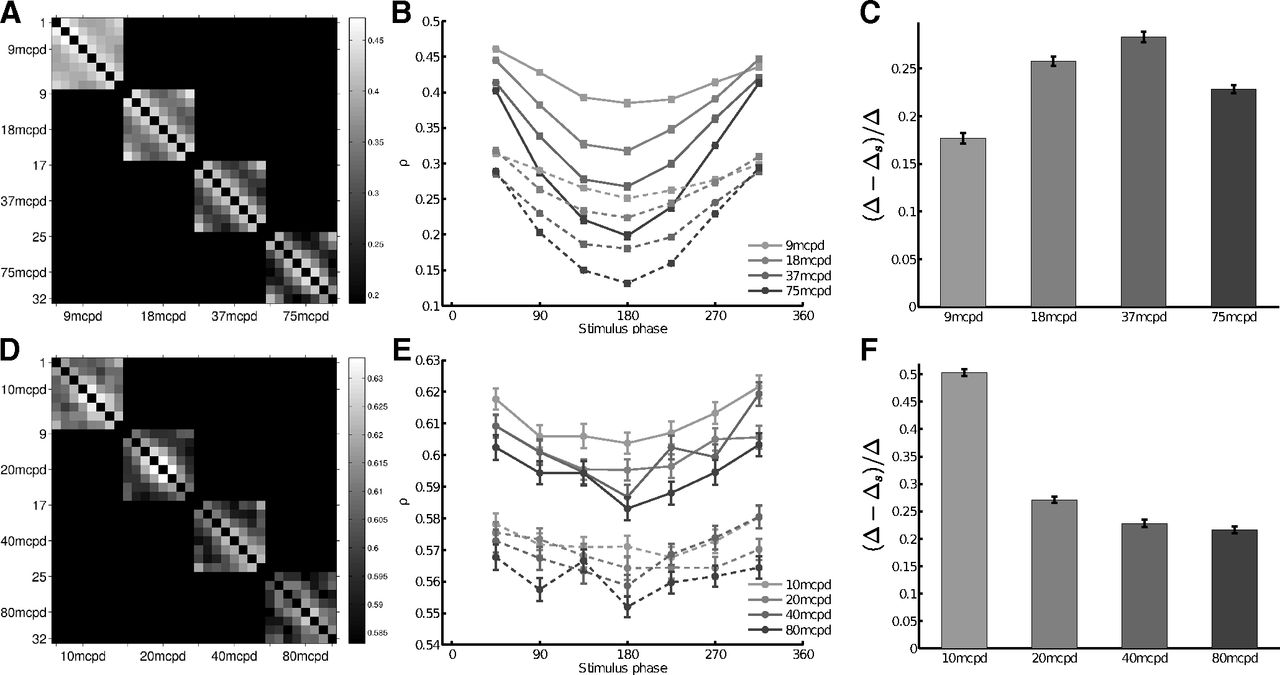
    Distance between WFS evoked by different stimuli. A, Confusion matrix showing the mean Spearman correlation coefficient ρ computed for all possible stimuli pairs, across all the trials of the dataset D1. It can be interpreted as a measure of how different are the ranks of the first stimulus-evoked spikes related to two different stimuli: ρ = 1 for identical ranked lists and ρ = −1 for opposite ranked lists. Periodic patterns appear, which can be related to phase differences. B, For each spatial frequency, the variations of ρ(0, φ)|{φ=45...315}, where φ are the other gratings differing with their phases, are plotted. Continuous lines stand for ρ computed across the trials. Dashed lines stand for ρ computed using shuffled trials. The more the phase changes, the more the ranked emitted spikes are different. Shuffling the trials decreases this modulation. Error bars show SEM. C, Quantification of the effect due to shuffling the trials observed in B as a relative difference between ρ(0,45) and ρ(0,180) in normal (Δ) and shuffled (Δs) condition (see Results for details). Shuffling the trials leads to a loss of ρ up to 30%. D, E, F, Same analysis as in A, B, C, using the dataset D3. Periodic variation of ρ as a function of the phase can be seen but not as clear as in dataset D1. Error bars show SEM.

  • Figure 5.
    • Download figure
    • Open in new tab
    • Download powerpoint
    Figure 5.

    Discrimination performance of the spike count, the latency, and the ROC decoders. The fraction of correct identifications is plotted as a function of the spatial frequency for the spike count code (black), the latency code (gray), the ROC with latencies (red), and the ROC with spike counts (blue). A, All 764 RGCs of the dataset D1 and (B) all the 649 RGCs of the dataset D2 were used in this analysis. Results show that all the decoders perform well in this task (close to 1, maximal value). The horizontal line indicates chance level. Shaded areas show SEM.

  • Figure 6.
    • Download figure
    • Open in new tab
    • Download powerpoint
    Figure 6.

    Discrimination performance as a function of the number of RGCs. The fraction of correct identifications is plotted for the spike count code (black), the latency code (gray), and the ROC with latencies (red), and the ROC with spike counts (blue), as a function of the number of neurons. A, Responses of the dataset D1 related to stimuli 9–16 (18 mcpd) are used in this analysis. From a population size of 30 RGCs and higher, the ROC with latencies tends to perform better than the latency decoder. B, Analysis on the responses of the dataset D2 related to the same stimuli as in A. The horizontal line indicates chance level. Shaded areas show SEM.
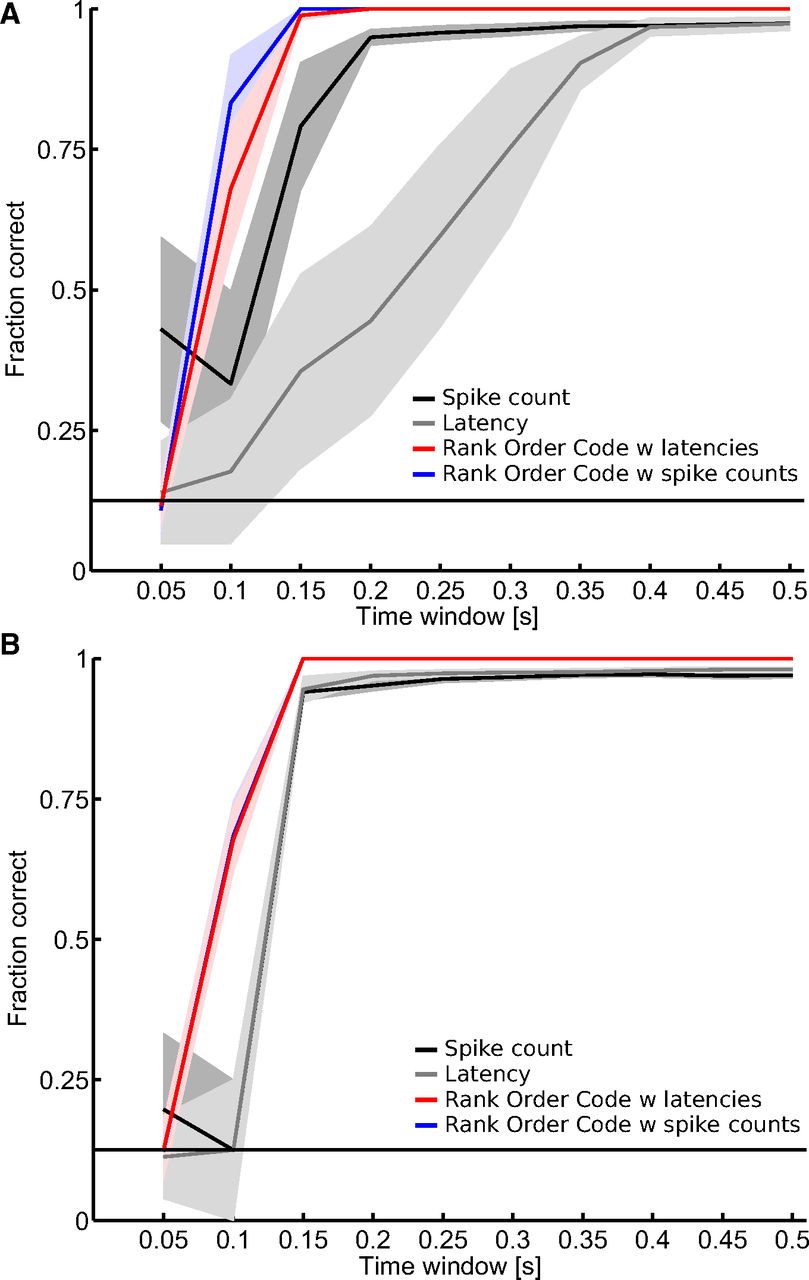
  • Figure 7.
    • Download figure
    • Open in new tab
    • Download powerpoint
    Figure 7.

    Discrimination performance as a function of the time window after the stimulus onset. The fraction of correct identifications is plotted for the spike count code (black), the latency code (gray), the ROC with latencies (red), and the ROC with spike counts (blue) as a function of the length of the observation window. This time window varied from 0.05 to 0.5 s after the stimulus onset. Responses of (A) the dataset D1 and (B) the dataset D2, related to stimuli 9–16 (18 mcpd) are used in this analysis. ROC with latencies decoder rapidly outperforms the latency decoder and reaches its maximal performance within 0.15 s after the stimulus onset. B, The curve of the ROC with spike counts is hidden by the ROC with latencies. The horizontal line indicates chance level. Shaded areas show SEM.

Back to top

In this issue

eneuro: 3 (3)
eNeuro
Vol. 3, Issue 3
May/June 2016
  • Table of Contents
  • Index by author
Email

Thank you for sharing this eNeuro article.

NOTE: We request your email address only to inform the recipient that it was you who recommended this article, and that it is not junk mail. We do not retain these email addresses.

Enter multiple addresses on separate lines or separate them with commas.
Rank Order Coding: a Retinal Information Decoding Strategy Revealed by Large-Scale Multielectrode Array Retinal Recordings
(Your Name) has forwarded a page to you from eNeuro
(Your Name) thought you would be interested in this article in eNeuro.
CAPTCHA
This question is for testing whether or not you are a human visitor and to prevent automated spam submissions.
Print
View Full Page PDF
Citation Tools
Rank Order Coding: a Retinal Information Decoding Strategy Revealed by Large-Scale Multielectrode Array Retinal Recordings
Geoffrey Portelli, John M. Barrett, Gerrit Hilgen, Timothée Masquelier, Alessandro Maccione, Stefano Di Marco, Luca Berdondini, Pierre Kornprobst, Evelyne Sernagor
eNeuro 12 May 2016, 3 (3) ENEURO.0134-15.2016; DOI: 10.1523/ENEURO.0134-15.2016

Citation Manager Formats

  • BibTeX
  • Bookends
  • EasyBib
  • EndNote (tagged)
  • EndNote 8 (xml)
  • Medlars
  • Mendeley
  • Papers
  • RefWorks Tagged
  • Ref Manager
  • RIS
  • Zotero
Respond to this article
Share
Rank Order Coding: a Retinal Information Decoding Strategy Revealed by Large-Scale Multielectrode Array Retinal Recordings
Geoffrey Portelli, John M. Barrett, Gerrit Hilgen, Timothée Masquelier, Alessandro Maccione, Stefano Di Marco, Luca Berdondini, Pierre Kornprobst, Evelyne Sernagor
eNeuro 12 May 2016, 3 (3) ENEURO.0134-15.2016; DOI: 10.1523/ENEURO.0134-15.2016
del.icio.us logo Digg logo Reddit logo Twitter logo Facebook logo Google logo Mendeley logo
  • Tweet Widget
  • Facebook Like
  • Google Plus One

Jump to section

  • Article
    • Visual Abstract
    • Abstract
    • Significance Statement
    • Introduction
    • Materials and Methods
    • Results
    • Discussion
    • Footnotes
    • References
    • Synthesis
  • Figures & Data
  • Info & Metrics
  • eLetters
  • PDF

Keywords

  • ganglion cells
  • multielectrode array
  • population coding
  • rank order coding
  • retina

Responses to this article

Respond to this article

Jump to comment:

No eLetters have been published for this article.

Related Articles

Cited By...

More in this TOC Section

New Research

  • Brain FNDC5/irisin expression in patients and mouse models of major depression
  • Microglia maintain homeostatic conditions in the developing rostral migratory stream
  • Similar presynaptic action potential-calcium influx coupling in two types of large mossy fiber terminals innervating CA3 pyramidal cells and hilar mossy cells
Show more New Research

Sensory and Motor Systems

  • Supramodal representation of the sense of body ownership in the human parieto-premotor and extrastriate cortices
  • Nonspiking Interneurons in the Drosophila Antennal Lobe Exhibit Spatially Restricted Activity
  • Pattern of Driver-Like Input onto Neurons of the Mouse Ventral Lateral Geniculate Nucleus
Show more Sensory and Motor Systems

Subjects

  • Sensory and Motor Systems

  • Home
  • Alerts
  • Visit Society for Neuroscience on Facebook
  • Follow Society for Neuroscience on Twitter
  • Follow Society for Neuroscience on LinkedIn
  • Visit Society for Neuroscience on Youtube
  • Follow our RSS feeds

Content

  • Early Release
  • Current Issue
  • Latest Articles
  • Issue Archive
  • Blog
  • Browse by Topic

Information

  • For Authors
  • For the Media

About

  • About the Journal
  • Editorial Board
  • Privacy Policy
  • Contact
  • Feedback
(eNeuro logo)
(SfN logo)

Copyright © 2023 by the Society for Neuroscience.
eNeuro eISSN: 2373-2822

The ideas and opinions expressed in eNeuro do not necessarily reflect those of SfN or the eNeuro Editorial Board. Publication of an advertisement or other product mention in eNeuro should not be construed as an endorsement of the manufacturer’s claims. SfN does not assume any responsibility for any injury and/or damage to persons or property arising from or related to any use of any material contained in eNeuro.