

Article Figures & Data
Figures
- Figure 1.
Enhancement of cocaine cue-evoked pupil dilation during drug abstinence. A, Left, Setup for drug conditioning using olfactory cues in head-restrained mice. Behavior was monitored in the form of pupil dilation and circular treadmill rotation velocity. Right, Image of the pupil of an animal before drug injection (top) or 10 min after a single injection of cocaine during conditioning (bottom). B, Timeline of surgery, habituation, drug conditioning, and recording. C, Time dependence of absolute value of treadmill rotation velocity (left) and pupil diameter (right) for one representative animal on the first day of cocaine conditioning. Dashed line indicates the time of drug injection. D, For the drug group (n = 10), postinjection treadmill rotation velocity showed a significant effect of treatment type (two-way ANOVA, F(1,18) = 31.50, p < 0.0001) and day of treatment (F(4,72) = 3.75, p = 0.008). E, Postinjection pupil diameter showed a significant effect of treatment type (two-way ANOVA, F(1,18) = 17.66, p = 0.0005), while there was no effect of day of treatment (F(4,72) = 0.831, p = 0.510). F, When presented with the cues on the test day in the absence of cocaine, drug-experienced mice (n = 10) showed an equal locomotor response to cocaine- and saline-associated cues (Wilcoxon matched-pairs signed rank test, p > 0.99). G, Drug-experienced mice showed a higher pupil dilation in response to cocaine-associated cues (Wilcoxon matched-pairs signed rank test, p = 0.027). H, Cocaine cue-mediated pupil dilation changes were not correlated with treadmill rotation changes (r = 0.08, p = 0.827). I, Cue-triggered treadmill rotation velocity vs time averaged across drug-treated mice shows no difference in locomotion between cocaine- and saline-paired cues. Dashed lines indicate cue onset and offset. J, Mean cue-triggered change in pupil dilation vs time. Blue lines indicate time bins where the cocaine and saline cues elicited significantly different dilation (paired t test, p < 0.05). K, There was no significant difference in pupillary response between the initial 15 trials and final 15 trials of the cocaine cue (Wilcoxon matched pairs signed-rank test, p = 0.695). L, There was no significant difference in pupillary response between the initial 15 trials and the final 15 trials of the saline cue (Wilcoxon matched pairs signed-rank test, p = 0.922). Data in D, E, I, and J are reported as the mean ± SEM. *p < 0.05, **p < 0.01, ***p < 0.001, ****p < 0.0001.
- Figure 2.
Control mice do not show differences in cue-evoked pupil dilation. A, For the control group (n = 7), postinjection treadmill rotation velocity showed no effect of odor type (two-way ANOVA, F(1,12) = 0.024, p = 0.878) or day of treatment (F(4,48) = 1.450, p = 0.232). B, Control group animals showed no effect of odor type (F(1,12) = 0.072, p = 0.794) or day of treatment (F(4,48) = 1.777, p = 0.149). C, When presented with cues on the test day, control group mice (n = 7) showed an equal locomotor response to both cues (Wilcoxon matched-pairs signed rank test, p = 0.297). D, When presented with cues on the test day, control group mice showed an equal pupillary response to both cues (Wilcoxon matched-pairs signed rank test, p = 0.375). Data in A and B are reported as the mean ± SEM.
- Figure 3.
Large-scale neural recordings in the frontostriatal circuit. A, A 512 electrode silicon microprobe targeting the mPFC and VS. B, Representative reconstruction of electrode placement in the mPFC (left) and VS (right) from the same animal. Red, DiD dye; green, NeuN staining. C, Distribution of trough-to-peak spike duration in the mPFC and VS. Red dashed lines denote the classification boundary between FSI and non-FSI units (units between the lines are unclassified). D, Proportion and total number of cells recorded in the mPFC and VS in the drug and control groups.
- Figure 4.
Cocaine does not alter spontaneous cortical or striatal firing rate in early abstinence. A, B, Illustration of how units in the mPFC and VS were partitioned according to their location on the top or bottom half of the electrode array. C–F, There was no difference between the average firing rate of principal cells or FSIs in any of the subregions examined (Mann–Whitney U test, p > 0.025; exact probability values are listed in the figure, α was adjusted to 0.025 after Bonferroni’s correction for two comparisons, corresponding to the top and bottom partitions). Data in C–F are reported as the mean ± SEM firing rate across the animals in the drug (n = 10) and control (n = 7) groups. G, H, There was no difference in the pooled spontaneous FSI firing rate in any of the subregions examined (Kolmogorov–Smirnov test, p > 0.05; exact probability values are listed in the figure).
- Figure 5.
Average cue-evoked activity is not selective for cocaine-associated stimuli. A, B, Mean cue-triggered firing rate of all significantly excited pyramidal cells and MSNs, combined across data from the drug treatment group. Black and red lines, respectively, indicate the response to cocaine- and saline-paired cues. Dashed lines indicate cue onset and offset. There was no significant difference between the response to cocaine- and saline-paired cues at any time point (paired permutation test, p > 0.05). C, D, Mean cue-triggered firing rate of all significantly inhibited pyramidal cells and MSNs, combined across data from the drug treatment group. There was no significant difference between the response to cocaine- and saline-paired cues at any time point (paired permutation test, p > 0.01). Data in A–D are reported as the mean ± SEM. E, F, There was no difference in the average fraction of cortical pyramidal cells excited or inhibited by cocaine cues (Wilcoxon matched pairs signed-rank test, p > 0.05). G, H, There was no difference in the average fraction of MSNs excited or inhibited by cocaine cues (Wilcoxon matched pairs signed-rank test, p > 0.05). Data in E–H denote the fraction of cells per animal in the drug group (n = 10).
- Figure 6.
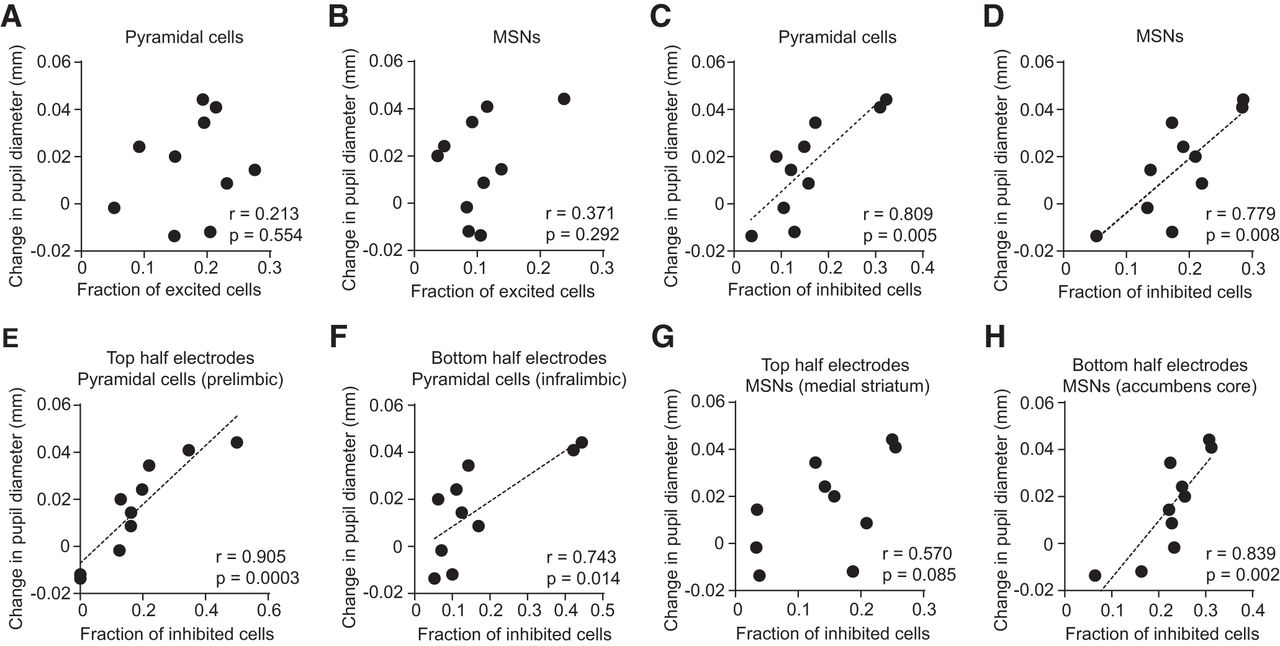
Cocaine cue-evoked pupil dilation correlates with frontostriatal inhibition. A, There was no correlation of mean change in pupillary response to the fraction of cortical pyramidal neurons excited by the cocaine-paired cue (r = 0.213, p = 0.554). B, There was no correlation of mean change in pupillary response to the fraction of MSNs excited by the cocaine-paired cue (r = 0.371, p = 0.292). C, The mean change in pupillary response was correlated with the fraction of inhibited pyramidal neurons (r = 0.809, p = 0.005). D, The mean change in pupillary response was correlated with the fraction of inhibited MSNs (r = 0.779, p = 0.008). Results from A–D were obtained by combining cortical or striatal principal cells across the entire electrode array. E, F, Inhibited units in both the prelimbic and infralimbic cortex maintained their relationship to pupillary response (Pearson’s correlation, p < 0.025; α was adjusted to 0.025 after Bonferroni’s correction for two comparisons; exact probability values are listed in the figure). G, Inhibited MSNs in the medial striatum were uncorrelated to pupillary response (r = 0.570, p = 0.085). H, Inhibited MSNs in the nucleus accumbens core were correlated with pupillary response (r = 0.839, p = 0.002). Plots show data from the drug group (n = 10).
- Figure 7.
No correlation of neural activity with cocaine cue-evoked treadmill speed or saline cue-evoked pupil dilation. A, There was no correlation of the mean change in treadmill velocity with the fraction of cortical pyramidal neurons excited by the cocaine-paired cue (r = 0.113, p = 0.756). B, There was no correlation of the mean change in treadmill velocity with the fraction of MSNs excited by the cocaine-paired cue (r = 0.163, p = 0.652). C, There was no correlation of the mean change in treadmill velocity with the fraction of cortical pyramidal neurons inhibited by the cocaine-paired cue (r = −0.126, p = 0.73). D, There was no correlation of the mean change in treadmill velocity with the fraction of MSNs inhibited by the cocaine-paired cue (r = −0.36, p = 0.307). E, There was no correlation of the mean change in pupillary response with the fraction of cortical pyramidal neurons excited by the saline-paired cue (r = −0.135, p = 0.701). F, There was no correlation of the mean change in pupillary response with the fraction of MSNs excited by the saline-paired cue (r = 0.367, p = 0.296). G, There was no correlation of the mean change in pupillary response with the fraction of cortical pyramidal neurons inhibited by the saline-paired cue (r = 0.060, p = 0.869). H, There was no correlation of the mean change in pupillary response with the fraction of MSNs inhibited by the saline-paired cue (r = 0.283, p = 0.428). Results from A–H were obtained by combining cortical or striatal principal cells across the entire electrode array. Plots show data from the drug group (n = 10).
- Figure 8.
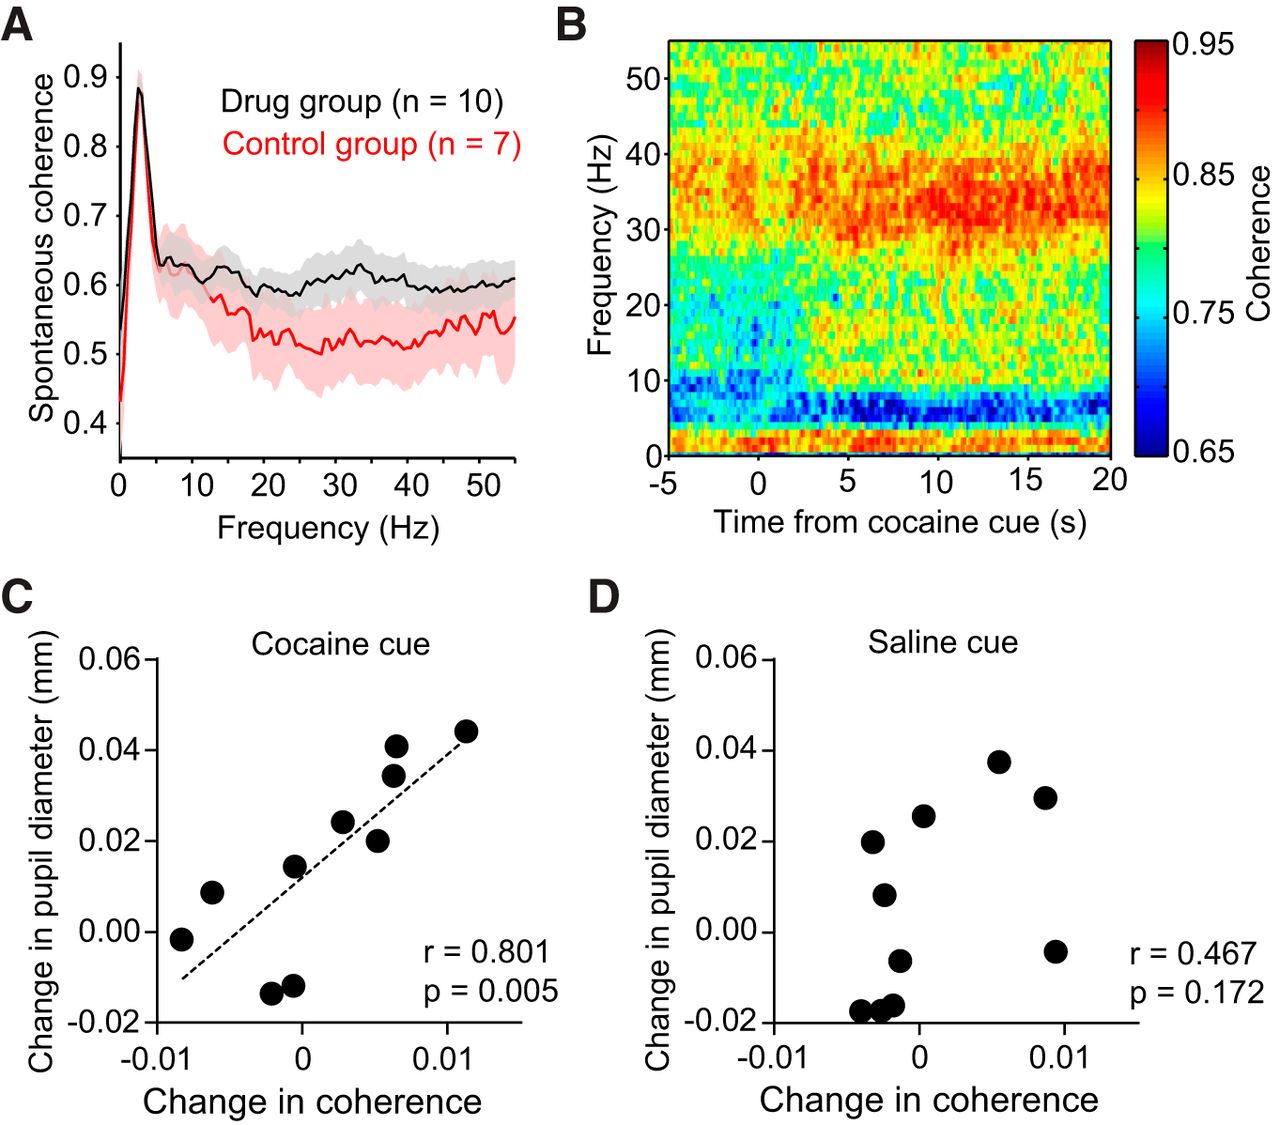
Cocaine cue-evoked pupil dilation correlates with 25–45 Hz frontostriatal LFP coherence. A, Frontostriatal coherence spectra of spontaneous LFP activity. Black and red lines, respectively, indicate the mean ± SEM of spectra recorded from animals in the drug (n = 10) and control (n = 7) groups. Note the peak at ∼25–45 Hz for the cocaine group. B, LFP coherence spectrogram from one animal showing modulation of coherence by olfactory stimuli. Data are aligned to cocaine cue onset. C, The mean change in pupillary response was correlated with the change in 25–45 Hz LFP coherence during the presentation of cocaine cues (r = 0.801, p = 0.005). D, The mean change in pupillary response was uncorrelated with the change in 25–45 Hz LFP coherence during the presentation of saline cues (r = 0.467, p = 0.172).


Tables
Mouse ID Total Pyramidal cells Pyramidal cells excited by cocaine cues Pyramidal cells inhibited by cocaine cues Pyramidal cells excited by saline cues Pyramidal cells inhibited by saline cues 1 84 18 26 11 23 2 141 13 21 14 28 3 87 17 15 16 10 4 57 3 6 14 24 5 58 16 7 5 5 6 95 22 15 8 5 7 31 6 10 1 6 8 67 10 6 11 10 9 27 4 1 0 2 10 39 8 5 12 0 Mouse ID Total MSNs MSNs excited by cocaine cues MSNs inhibited by cocaine cues MSNs excited by saline cues MSNs inhibited by saline cues 1 95 11 27 8 29 2 63 3 12 4 21 3 87 8 15 3 17 4 60 5 8 8 11 5 65 9 9 5 9 6 100 11 22 6 4 7 21 5 6 3 0 8 81 3 17 5 16 9 57 6 3 2 6 10 81 7 14 10 9 Figure Data structure Type of test Sample size p Value a Fig. 1D Two factors (day and treatment) Two-way ANOVA with repeated measures n = 10 mice Day: F(4,72) = 3.752, p = 0.0079Treatment: F(1,18) = 31.50, p < 0.0001Interaction: F(4,72) = 2.639, p = 0.0407Sidak's multiple comparisons test:Saline vs drug, day 1: p = 0.2737Saline vs drug, day 2: p = 0.0630Saline vs drug, day 3: p = 0.0003Saline vs drug, day 4: p < 0.0001Saline vs drug, day 5: p < 0.0001 b Fig. 1E Two factors (day and treatment) Two-way ANOVA with repeated measures n = 10 mice Day: F(4,72) = 0.8313, p = 0.5096Treatment: F(1,18) = 17.66, p = 0.0005Interaction: F(4,72) = 0.6524, p = 0.6270Sidak's multiple comparisons test:Saline vs drug, day 1: p = 0.0148Saline vs drug, day 2: p = 0.0190Saline vs drug, day 3: p = 0.0004Saline vs drug, day 4: p = 0.0013Saline vs drug, day 5: p = 0.0034 c Fig. 1F Nonparametric Wilcoxon matched pairs signed-rank test n = 10 mice p > 0.9999 d Fig. 1G Nonparametric Wilcoxon matched pairs signed-rank test n = 10 mice p = 0.0273 e Fig. 1H Two variables r and rs n = 10 mice r = 0.080, p = 0.827rs = −0.103, p = 0.785 f Fig. 1K Nonparametric Wilcoxon matched pairs signed-rank test n = 10 mice p = 0.6953 g Fig. 1L Nonparametric Wilcoxon matched pairs signed-rank test n = 10 mice p = 0.9219 h Fig. 2A Two factors (day and treatment) Two-way ANOVA with repeated measures n = 7 mice Day: F(4,48) = 1.450, p = 0.2320Treatment: F(1,12) = 0.02449, p = 0.8782Interaction: F(4,48) = 0.4431, p = 0.7768Sidak's multiple comparisons test:Day 1: p > 0.9999Day 2: p = 0.9701Day 3: p > 0.9999Day 4: p > 0.9999Day 5: p = 0.8377 i Fig. 2B Two factors (day and treatment) Two-way ANOVA with repeated measures n = 7 mice Day: F(4,48) = 1.777, p = 0.1489Treatment: F(1,12) = 0.07157, p = 0.7936Interaction: F(4,48) = 0.2804, p = 0.8893Sidak's multiple comparisons test:Day 1: p = 0.9998Day 2: p = 0.9913Day 3: p = 0.9992Day 4: p > 0.9999Day 5: p = 0.9907 j Fig. 2C Nonparametric Wilcoxon matched pairs signed-rank test n = 7 mice p = 0.2969 k Fig. 2D Nonparametric Wilcoxon matched pairs signed-rank test n = 7 mice p = 0.3750 l Fig. 4C, left Nonparametric Mann–Whitney test n = 7 control group + 10 drug group p = 0.4028Bonferroni’s correction: 2 comparisons,α = 0.025 m Fig. 4C, right Nonparametric Mann–Whitney test n = 7 control group + 10 drug group p = 0.0328Bonferroni’s correction: 2 comparisons,α = 0.025 n Fig. 4D, left Nonparametric Mann–Whitney test n = 7 control group + 10 drug group p = 0.5942Bonferroni’s correction: 2 comparisons,α = 0.025 o Fig. 4D, right Nonparametric Mann–Whitney test n = 7 control group + 10 drug group p = 0.4705Bonferroni’s correction: 2 comparisons,α = 0.025 p Fig. 4E, left Nonparametric Mann–Whitney test n = 7 control group + 10 drug group p = 0.9252Bonferroni’s correction: 2 comparisons,α = 0.025 q Fig. 4E, right Nonparametric Mann–Whitney test n = 7 control group + 10 drug group p = 0.4028Bonferroni’s correction: 2 comparisons,α = 0.025 r Fig. 4F, left Nonparametric Mann–Whitney test n = 7 control group + 10 drug group p = 0.3130Bonferroni’s correction: 2 comparisons,α = 0.025 s Fig. 4F, right Nonparametric Mann–Whitney test n = 7 control group + 10 drug group p > 0.9999Bonferroni’s correction: 2 comparisons,α = 0.025 t Fig. 4G, left Nonparametric Kolmogorov–Smirnov test n = 26 control + 80 drug group FSIs p = 0.7Bonferroni’s correction: 2 comparisons,α = 0.025 u Fig. 4G, right Nonparametric Kolmogorov–Smirnov test n = 21 control + 60 drug group FSIs p = 0.945Bonferroni’s correction: 2 comparisons,α = 0.025 v Fig. 4H, left Nonparametric Kolmogorov–Smirnov test n = 102 control + 110 drug group FSIs p = 0.0584Bonferroni’s correction: 2 comparisons,α = 0.025 w Fig. 4H, right Nonparametric Kolmogorov–Smirnov test n = 42 control + 97 drug group FSIs p = 0.349Bonferroni’s correction: 2 comparisons,α = 0.025 x Fig. 5E Nonparametric Wilcoxon matched-pairs signed rank test n = 10 mice p = 0.4316 y Fig. 5F Nonparametric Wilcoxon matched-pairs signed rank test n = 10 mice p = 0.6953 z Fig. 5G Nonparametric Wilcoxon matched-pairs signed rank test n = 10 mice p = 0.1602 aa Fig. 5H Nonparametric Wilcoxon matched-pairs signed rank test n = 10 mice p = 0.9102 ab Fig. 6A Two variables r and rs n = 10 mice r = 0.2132, p = 0.5543rs =0.1394, p = 0.7072 ac Fig. 6B Two variables r and rs n = 10 mice r = 0.3706, p = 0.2918rs = 0.3091, p = 0.3869 ad Fig. 6C Two variables r and rs n = 10 mice r = 0.8089, p = 0.0046rs = 0.7818, p = 0.0105 ae Fig. 6D Two variables r and rs n = 10 mice r = 0.7793, p = 0.0079rs = 0.7091, p = 0.0268 af Fig. 6E Two variables r and rs n = 10 mice r = 0.9051, p = 0.0003rs = 0.9605, p < 0.0001Bonferroni’s correction: 2 comparisons,α = 0.025 ag Fig. 6F Two variables r and rs n = 10 mice r = 0.7426, p = 0.0139rs = 0.7455, p = 0.0174Bonferroni’s correction: 2 comparisons,α = 0.025 ah Fig. 6G Two variables r and rs n = 10 mice r = 0.5701, p = 0.0853rs = 0.5152, p = 0.1334Bonferroni’s correction: 2 comparisons,α = 0.025 ai Fig. 6H Two variables r and rs n = 10 mice r = 0.8391, p = 0.0024rs = 0.7818, p = 0.0105Bonferroni’s correction: 2 comparisons,α = 0.025 aj Fig. 7A Two variables r and rs n = 10 mice r = 0.1131, p = 0.7558rs = −0.0901, p = 0.8113 ak Fig. 7B Two variables r and rs n = 10 mice r = 0.1634, p = 0.6520rs = 0.2727, p = 0.4483 al Fig. 7C Two variables r and rs n = 10 mice r = −0.1255, p = 0.7297rs = −0.0909, p = 0.8113 am Fig. 7D Two variables r and rs n = 10 mice r = −0.3601, p = 0.3068rs = −0.3455, p = 0.3304 an Fig. 7E Two variables r and rs n = 10 mice r = −0.1352, p = 0.7096rs = 0.006061, p > 0.9999 ao Fig. 7F Two variables r and rs n = 10 mice r = 0.3674, p = 0.2963rs = 0.4061, p = 0.2475 ap Fig. 7G Two variables r and rs n = 10 mice r = 0.05994, p = 0.8694rs = 0.1394, p = 0.7072 aq Fig. 7H Two variables r and rs n = 10 mice r = 0.2834, p = 0.4275rs = 0.2485, p = 0.4918 ar Fig. 8C Two variables r and rs n = 10 mice r = 0.8011, p = 0.0053rs = 0.8909, p = 0.0011 as Fig. 8D Two variables r and rs n = 10 mice r = 0.4686, p = 0.1719rs = 0.5879, p = 0.0806
In this issue


