

Article Figures & Data
Figures
- Figure 1.
Hom Brattleboro weanlings play less than their WT and Het littermates. A, B, Number of total play behaviors (A) and pins (B) of Hom, Het, and WT rats during a 20 min test at P17, P19, P21, or P23. Sample sizes are indicated within each bar. Data from each age were obtained from separate cohorts of animals. Genotypes with differing letters differ significantly from each other (p < 0.05, Fisher’s PLSD); where differences approach significance, the p value is included in parentheses next to the letter representing the appropriate comparison. See Results for ANOVA details.
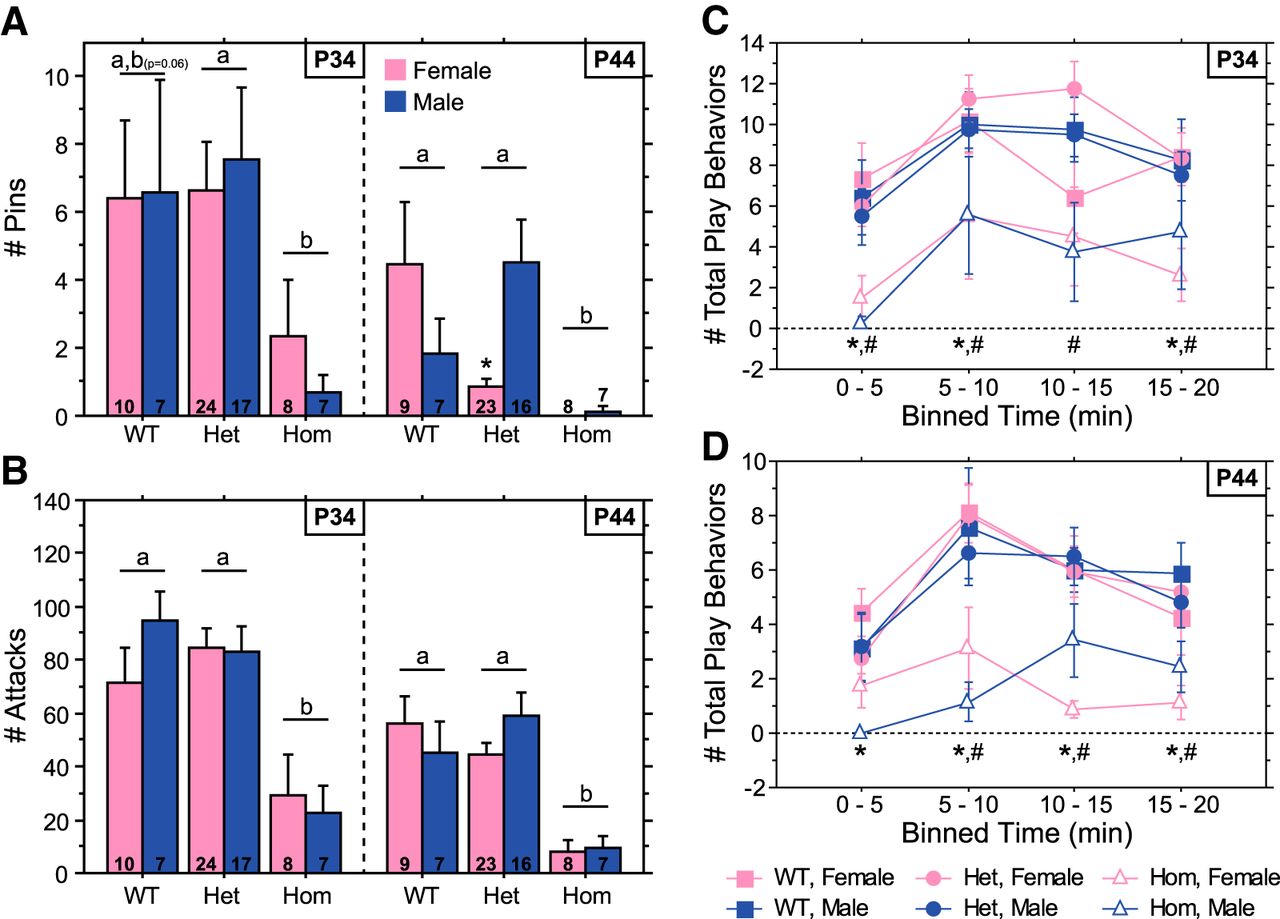
- Figure 2.
Social play is decreased in Hom Brattleboro juveniles. A, B, Number of pins (A) and play attacks (B) of male and female Hom, Het, and WT rats during a 20 min test at P34 or P44. C, D, The temporal profile of play is illustrated in C (for P34) and D (for P44) as the number of total play behaviors binned every 5 min. Sample sizes are indicated within each bar in A and B. Data from each age were obtained from separate cohorts of animals. Genotypes with differing letters differ significantly from each other (p < 0.05, Fisher’s PLSD); where differences approach significance, the p value is included in parentheses next to the letter representing the appropriate comparison. In C and D, significant differences between Hom and WT or Het rats within each bin are indicated by * and #, respectively (p < 0.005, Fisher’s PLSD). See Results for ANOVA details.
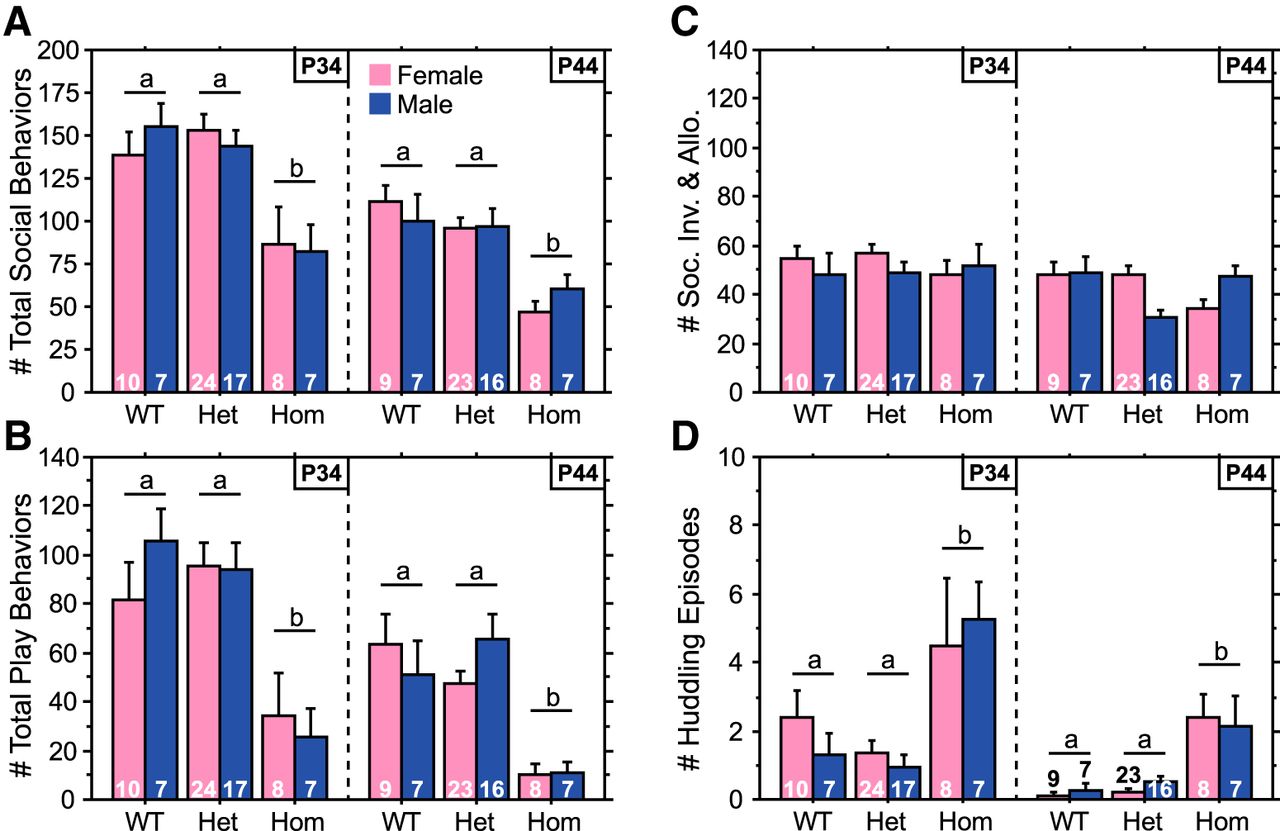
- Figure 3.
Social behavior is altered in Hom Brattleboro juveniles. A–D, Number of total social behaviors (A), total play behaviors (B), social investigation & allogrooming behaviors (C), and huddling episodes (D) of Hom, Het, and WT rats during a 20 min test at P34 or P44. Sample sizes are indicated within each bar. Data from each age were obtained from separate cohorts of animals. Genotypes with differing letters differ significantly from each other (p < 0.05, Fisher’s PLSD). See Results for ANOVA details.
- Figure 4.
Hom Brattleboro juveniles emit fewer 50 kHz USVs. A–C, Number of all (A), 50 kHz (B), and 22 kHz (C) USVs of male and female Hom, Het, and WT rats during the first 10 min of a 20 min test at P34 or P44. Sample sizes are indicated within each bar. Data from each age were obtained from separate cohorts of animals. Genotypes with differing letters differ significantly from each other (p < 0.05, Fisher’s PLSD); where differences approach significance, the p value is included in parentheses next to the letter representing the appropriate comparison. See Results for ANOVA details.
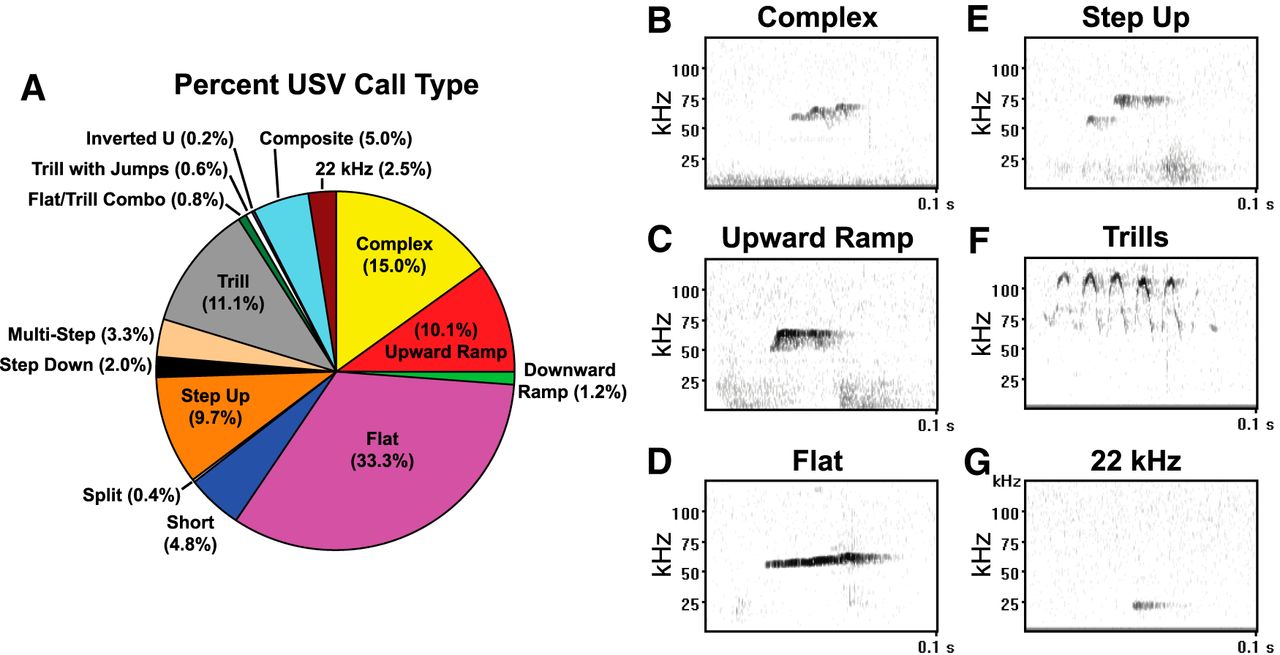
- Figure 5.
Ultrasonic vocalization call types emitted during social behavior testing. A, Percentage of USV call types, as defined by Wright et al. (2010), emitted by male and female Hom, Het, and WT juveniles (P34 or P44) during the first 10 min of a 20 min test; data are combined across sex, genotype, and age. B–G, Representative spectrograms of the most common 50 kHz calls [complex (B), upward-ramp (C), flat (D), step-up (E), and trill (F)] as well as the 22 kHz call (G).
- Figure 6.
The quantity and quality of USV calls is altered in Hom Brattleboro rats. A–O, number (A–E), integrated frequency (F–J), and duration (K–O) of type 1 (complex), type 2 (upward-ramp), type 4 (flat), type 7 (step-up), and type 10 (trill) USV calls of male and female Hom, Het, and WT rats during the first 10 min of a 20 min test at P34 or P44. Data from each age were obtained from separate cohorts of animals. Genotypes with differing letters differ significantly from each other (p < 0.05, Fisher’s PLSD); where differences approach significance, the p value is included in parentheses next to the letter representing the appropriate comparison. See Results for ANOVA details.


Tables
Data structure Dependent variable Comparison Type of test p value Power a1 Non-normal distribution Total play Main effect of age Three-way ANOVA, K-W <0.0001 (ANOVA and K-W) 1.000 a2 Non-normal distribution Main effect of genotype Three-way ANOVA, K-W 0.0310 (ANOVA), 0.0375 (K-W) 0.649 a3 Non-normal distribution Main effect of sex Three-way ANOVA, M-W 0.9342 (ANOVA), 0.3852 (M-W) 0.051 a4 Non-normal distribution P17 vs P19 M-W <0.0001 1.000 a5 Non-normal distribution P19 vs P21 M-W <0.0001 1.000 a6 Non-normal distribution Hom vs WT Fisher's PLSD, M-W 0.0024 (Fisher's), 0.0124 (M-W) 0.804 a7 Non-normal distribution Hom vs Het Fisher's PLSD, M-W 0.0079 (Fisher's), 0.043 (M-W) 0.612 a8 Normal distribution Main effect of genotype, P21 Two-way ANOVA 0.0021 0.918 a9 Normal distribution Hom vs WT, P21 Fisher's PLSD 0.0004 0.934 a10 Normal distribution Hom vs Het, P21 Fisher's PLSD 0.0604 0.610 a11 Normal distribution Het vs WT, P21 Fisher's PLSD 0.0342 0.470 a12 Normal distribution Main effect of genotype, P23 Two-way ANOVA 0.0582 0.550 a13 Normal distribution Hom vs WT, P23 Fisher's PLSD 0.0876 0.526 a14 Normal distribution Hom vs Het, P23 Fisher's PLSD 0.0190 0.604 a15 Normal distribution Main effect of genotype, P19 Two-way ANOVA 0.6717 (ANOVA) 0.110 b1 Non-normal distribution Pins Main effect of age Three-way ANOVA, K-W <0.0001 (ANOVA and K-W) 1.000 b2 Non-normal distribution Main effect of genotype Three-way ANOVA, K-W 0.0118 (ANOVA), 0.0046 (K-W) 0.773 b3 Non-normal distribution Main effect of sex Three-way ANOVA, M-W 0.9655 (ANOVA), 0.5681 (M-W) 0.050 b4 Non-normal distribution P17 vs P19 M-W <0.0001 1.000 b5 Non-normal distribution P19 vs P21 M-W <0.0001 1.000 b6 Non-normal distribution Hom vs WT Fisher's PLSD, M-W 0.0003 (Fisher's), 0.0015 (M-W) 0.950 b7 Non-normal distribution Hom vs Het Fisher's PLSD, M-W 0.0019 (Fisher's), 0.0085 (M-W) 0.797 b8 Normal distribution Main effect of genotype, P21 Two-way ANOVA 0.0015 0.933 b9 Normal distribution Hom vs WT, P21 Fisher's PLSD 0.0003 0.942 b10 Normal distribution Hom vs Het, P21 Fisher's PLSD 0.0436 0.764 b11 Normal distribution Het vs WT, P21 Fisher's PLSD 0.0363 0.436 b12 Normal distribution Main effect of genotype, P23 Two-way ANOVA 0.0280 0.667 b13 Normal distribution Hom vs WT, P23 Fisher's PLSD 0.0377 0.770 b14 Normal distribution Hom vs Het, P23 Fisher's PLSD 0.0099 0.691 b15 Non-normal distribution Main effect of genotype, P19 Two-way ANOVA, K-W 0.3325 (ANOVA), 0.3213 (K-W) 0.230 c1 Non-normal distribution Play attacks Main effect of age Three-way ANOVA, K-W <0.0001 (ANOVA and K-W) 1.000 c2 Non-normal distribution Main effect of genotype Three-way ANOVA, K-W 0.0629 (ANOVA), 0.0887 (K-W) 0.537 c3 Non-normal distribution Main effect of sex Three-way ANOVA, M-W 0.9314 (ANOVA), 0.4056 (M-W) 0.051 c4 Non-normal distribution P17 vs P19 M-W <0.0001 1.000 c5 Non-normal distribution P19 vs P21 M-W <0.0001 1.000 c6 Non-normal distribution Hom vs WT Fisher's PLSD, M-W 0.0086 (Fisher's), 0.0318 (M-W) 0.645 K-W, Kruskal–Wallis test; M-W, Mann–Whitney U test.
Data structure Dependent variable Comparison Type of test p value Power d1 Normal distribution Total play Main effect of age Three-way ANOVA <0.0001 0.997 d2 Normal distribution Main effect of genotype Three-way ANOVA <0.0001 1.000 d3 Normal distribution Main effect of sex Three-way ANOVA 0.6259 0.076 d4 Normal distribution Hom vs WT Fisher's PLSD <0.0001 1.000 d5 Normal distribution Hom vs Het Fisher's PLSD <0.0001 1.000 e1 Non-normal distribution Pins Main effect of age Three-way ANOVA, M-W 0.0041 (ANOVA), 0.0002 (M-W) 0.843 e2 Non-normal distribution Main effect of genotype Three-way ANOVA, K-W 0.0031 (ANOVA), <0.0001 (K-W) 0.890 e3 Non-normal distribution Main effect of sex Three-way ANOVA, M-W 0.9169 (ANOVA), 0.3571 (M-W) 0.051 e4 Non-normal distribution Hom vs WT Fisher's PLSD, M-W 0.0048 (Fisher's), <0.0001 (M-W) 0.908 e5 Non-normal distribution Hom vs Het Fisher's PLSD, M-W 0.0016 (Fisher's), <0.0001 (M-W) 0.903 e6 Non-normal distribution genotype x sex, P44 Two-way ANOVA 0.0076 0.826 e7 Normal distribution Het male vs Het female, P44 Fisher's PLSD 0.0019 0.921 f1 Normal distribution Play attacks Main effect of age Three-way ANOVA <0.0001 0.999 f2 Normal distribution Main effect of genotype Three-way ANOVA <0.0001 1.000 f3 Normal distribution Main effect of sex Three-way ANOVA 0.5730 0.085 f4 Normal distribution Hom vs WT Fisher's PLSD <0.0001 1.000 f5 Normal distribution Hom vs Het Fisher's PLSD <0.0001 1.000 g1 Normal distribution Total social behaviors Main effect of age Three-way ANOVA <0.0001 1.000 g2 Normal distribution Main effect of genotype Three-way ANOVA <0.0001 1.000 g3 Normal distribution Main effect of sex Three-way ANOVA 0.8892 0.052 g4 Normal distribution Hom vs WT Fisher's PLSD <0.0001 1.000 g5 Normal distribution Hom vs Het Fisher's PLSD <0.0001 1.000 h1 Normal distribution Social Investigation/allogrooming Main effect of age Three-way ANOVA 0.0090 0.758 h2 Normal distribution Main effect of genotype Three-way ANOVA 0.5137 0.156 h3 Normal distribution Main effect of sex Three-way ANOVA 0.4631 0.109 i1 Non-normal distribution Huddling Main effect of age Three-way ANOVA, M-W <0.0001 (ANOVA), 0.0001 (M-W) 0.999 i2 Non-normal distribution Main effect of genotype Three-way ANOVA, K-W <0.0001 (ANOVA), <0.0001 (K-W) 1.000 i3 Non-normal distribution Main effect of sex Three-way ANOVA, M-W 0.8084 (ANOVA), 0.8321 (M-W) 0.057 i4 Normal distribution Hom vs WT Fisher's PLSD, M-W <0.0001 (Fisher's), 0.0003 (M-W) 0.948 i5 Non-normal distribution Hom vs Het Fisher's PLSD, M-W <0.0001 (Fisher's), <0.0001 (M-W) 1.000 j1 Normal distribution All USVs Main effect of genotype Three-way ANOVA <0.0001 0.993 j2 Normal distribution Hom vs WT Fisher's PLSD 0.0020 0.942 j3 Normal distribution Hom vs Het Fisher's PLSD <0.0001 0.998 k1 Normal distribution 50 kHz USVs Main effect of age Three-way ANOVA 0.0380 0.537 k2 Normal distribution Main effect of genotype Three-way ANOVA 0.0001 0.990 k3 Normal distribution Hom vs WT Fisher's PLSD 0.0022 0.947 k4 Normal distribution Hom vs Het Fisher's PLSD <0.0001 0.996 l1 Non-normal distribution 22 kHz USVs Main effect of age Three-way ANOVA, M-W 0.0001 (ANOVA), <0.0001 (M-W) 0.986 l2 Non-normal distribution Main effect of genotype Three-way ANOVA, K-W 0.2541 (ANOVA), 0.2262 (K-W) 0.282 K-W, Kruskal–Wallis test; M-W, Mann–Whitney U test.
Data structure Dependent variable Comparison Type of test Exact p value Power m1 Normal distribution Complex calls Main effect of age Three-way ANOVA 0.1349 0.304 m2 Normal distribution (Number) Main effect of genotype Three-way ANOVA 0.0258 0.676 m3 Normal distribution Hom vs WT Fisher's PLSD 0.0303 0.594 m4 Normal distribution Hom vs Het Fisher's PLSD 0.0116 0.796 m5 Normal distribution Main effect of genotype, P34 Two-way ANOVA 0.1603 0.366 m6 Normal distribution Main effect of genotype, P44 Two-way ANOVA 0.1587 0.367 n1 Normal distribution Upward-ramp calls Main effect of age Three-way ANOVA 0.0028 0.875 n2 Normal distribution (Number) Main effect of genotype, P34 Two-way ANOVA 0.0185 0.725 n3 Normal distribution Hom vs WT, P34 Fisher's PLSD 0.0112 0.724 n4 Normal distribution Hom vs Het, P34 Fisher's PLSD 0.0163 0.755 n5 Normal distribution Main effect of genotype, P44 Two-way ANOVA 0.6322 0.120 o1 Normal distribution Flat calls Main effect of age Three-way ANOVA 0.8419 0.054 o2 Normal distribution (Number) Main effect of genotype, P34 Two-way ANOVA 0.0270 0.673 o3 Normal distribution Hom vs WT, P34 Fisher's PLSD 0.0574 0.520 o4 Normal distribution Hom vs Het, P34 Fisher's PLSD 0.0056 0.832 o5 Normal distribution Main effect of genotype, P44 Two-way ANOVA 0.5538 0.141 p1 Normal distribution Step-up calls Main effect of age Three-way ANOVA 0.0355 0.549 p2 Normal distribution (Number) Main effect of genotype, P34 Two-way ANOVA 0.0058 0.850 p3 Normal distribution Hom vs WT, P34 Fisher's PLSD 0.0084 0.857 p4 Normal distribution Hom vs Het, P34 Fisher's PLSD 0.0022 0.918 p5 Normal distribution Main effect of genotype, P44 Two-way ANOVA 0.0543 0.562 q1 Non-normal distribution Trills Main effect of age Three-way ANOVA, M-W 0.0144 (ANOVA), 0.0025 (M-W) 0.694 q2 Non-normal distribution (Number) Main effect of sex Three-way ANOVA, K-W 0.0046 (ANOVA), <0.0001 (K-W) 0.830 q3 Normal distribution Main effect of genotype, P34 Two-way ANOVA 0.0092 0.807 q4 Normal distribution Hom vs WT, P34 Fisher's PLSD 0.0978 0.789 q5 Normal distribution Hom vs Het, P34 Fisher's PLSD 0.0045 0.746 q6 Normal distribution Main effect of genotype, P44 Two-way ANOVA 0.0009 0.954 q7 Normal distribution Hom vs WT, P44 Fisher's PLSD 0.0300 0.887 q8 Normal distribution Hom vs Het, P44 Fisher's PLSD 0.0005 0.923 r1 Normal distribution Complex calls Main effect of genotype Three-way ANOVA 0.0142 0.754 r2 Normal distribution (Int. Freq.) Hom vs WT Fisher's PLSD 0.1043 0.414 r3 Normal distribution Hom vs Het Fisher's PLSD 0.0053 0.703 r4 Normal distribution Main effect of age Three-way ANOVA <0.0001 0.999 r5 Normal distribution age x sex Three-way ANOVA 0.9431 0.059 s1 Normal distribution Upward-ramp calls Main effect of genotype Three-way ANOVA 0.0002 0.986 s2 Normal distribution (Int. Freq.) Hom vs WT Fisher's PLSD 0.0007 0.936 s3 Normal distribution Hom vs Het Fisher's PLSD <0.0001 0.990 s4 Normal distribution Main effect of age Three-way ANOVA <0.0001 0.994 s5 Normal distribution age x sex Three-way ANOVA 0.6940 0.106 t1 Normal distribution Flat calls Main effect of genotype Three-way ANOVA 0.0020 0.916 t2 Normal distribution (Int. Freq.) Hom vs WT Fisher's PLSD 0.0022 0.930 t3 Normal distribution Hom vs Het Fisher's PLSD 0.0014 0.825 t4 Normal distribution Main effect of age Three-way ANOVA <0.0001 0.999 t5 Normal distribution age x sex Three-way ANOVA 0.8255 0.079 u1 Normal distribution Step-up calls Main effect of genotype Three-way ANOVA 0.0186 0.721 u2 Normal distribution (Int. Freq.) Hom vs WT Fisher's PLSD 0.0416 0.531 u3 Normal distribution Hom vs Het Fisher's PLSD 0.0066 0.706 u4 Normal distribution Main effect of age Three-way ANOVA 0.0416 0.521 u5 Normal distribution age x sex Three-way ANOVA 0.0588 0.548 v1 Normal distribution Trills Main effect of genotype Three-way ANOVA 0.2452 0.288 v2 Normal distribution (Int. Freq.) Main effect of age Three-way ANOVA 0.1801 0.252 w1 Normal distribution Step-up calls Main effect of genotype, P44 Two-way ANOVA 0.0026 0.908 w2 Normal distribution (Dur.) Hom vs WT, P44 Fisher's PLSD 0.0195 0.592 w3 Normal distribution Hom vs Het, P44 Fisher's PLSD 0.0006 0.947 w4 Normal distribution Main effect of age Three-way ANOVA 0.2480 0.198 x1 Normal distribution Trills Main effect of genotype, P44 Two-way ANOVA 0.0090 0.810 x2 Normal distribution (Dur.) Hom vs WT, P44 Fisher's PLSD 0.0040 0.799 x3 Normal distribution Het vs WT, P44 Fisher's PLSD 0.0157 0.659 x4 Normal distribution Hom vs Het, P44 Fisher's PLSD 0.2632 0.213 x5 Normal distribution Main effect of age Three-way ANOVA 0.1010 0.357 y1 Normal distribution Complex calls (Dur.) Main effect of age Three-way ANOVA 0.0210 0.638 z1 Normal distribution Upward-ramp calls (Dur.) Main effect of age Three-way ANOVA 0.0078 0.775 aa1 Normal distribution Flat calls (Dur.) Main effect of age Three-way ANOVA 0.0036 0.854 K-W, Kruskal–Wallis test; M-W, Mann–Whitney U test.
In this issue


