

Article Figures & Data
Figures
- Figure 1.
Rapid and sustained behavioral effects of S-ketamine. A, Short-term S-ketamine (ket) treatment reduced the latency to eat in the novelty-suppressed feeding test (one-way ANOVA, F(3,14) = 6.61, p = 0.005; *Holm–Sidak test, 10 mg/ml vs saline, p = 0.004). B, In the repeated forced swim test, short-term administration of S-ketamine reduced the time spent immobile immediately and 21 d later, while fluoxetine had no effect (two-way repeated-measures ANOVA; treatment effect: F(2,9) = 31.65, p = 0.0001; time effect: F(1,9) = 31.47, p = 0.0003; treatment × time interaction: F(2,9) = 0.002, p =0.99; ***p < 0.001 vs saline in post hoc test). All bars represent mean ± standard error of the mean (SEM).
- Figure 2.
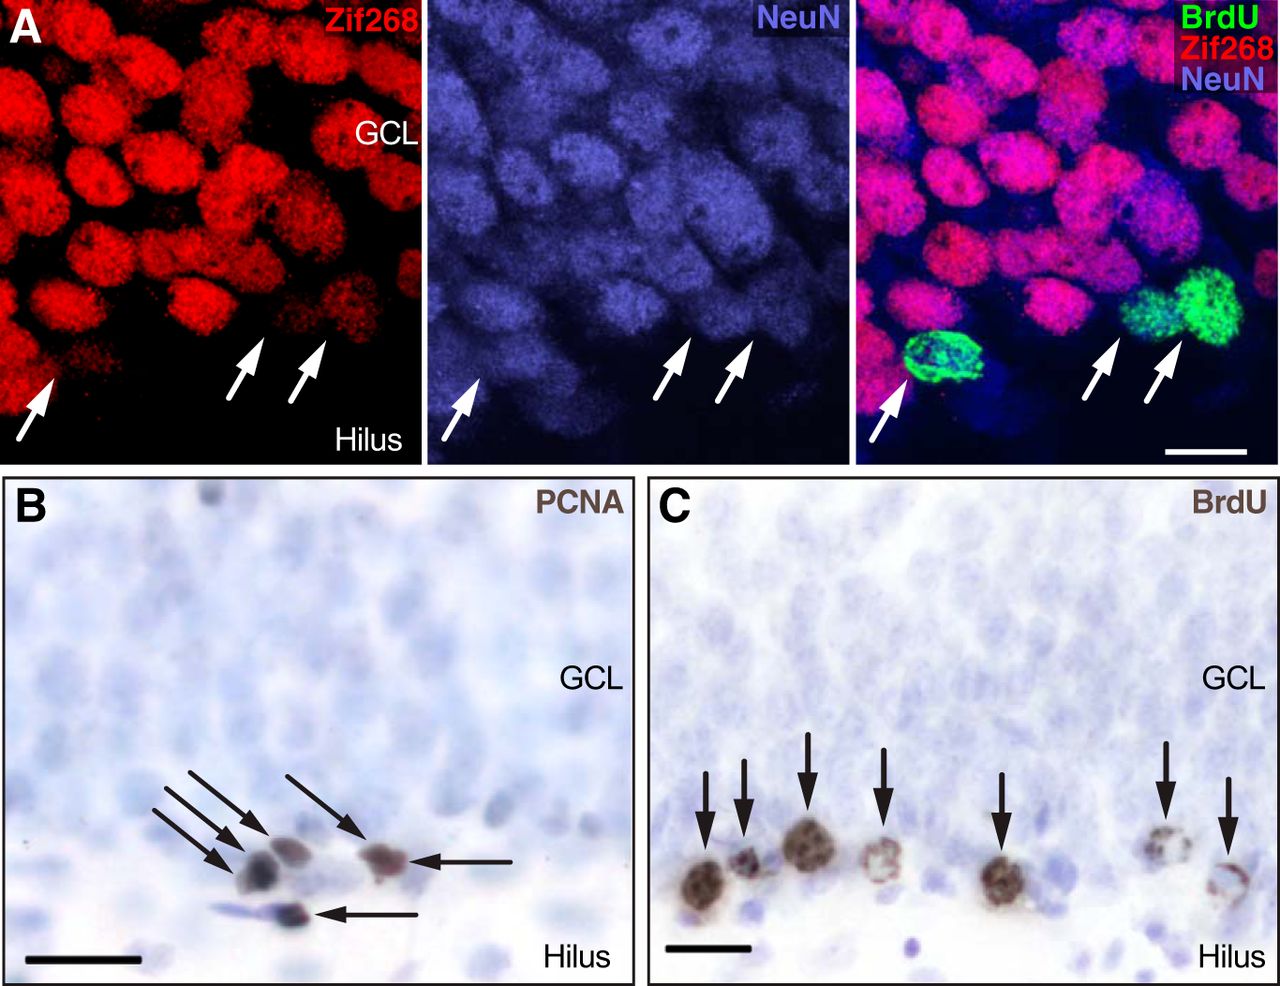
Examples of immunohistochemical markers. A, After kainate injection, all mature granule neurons and some BrdU-labeled 16-d-old NeuN+ neurons expressed zif268, indicating synaptic activation. GCL, granule cell layer B, Dividing cells (arrows) were identified using PCNA immunohistochemistry. C, Cells surviving 2-3 weeks (arrows) were identified with BrdU immunohistochemistry (gray-brown); immunonegative cells were stained with blue-purple counterstain.
- Figure 3.
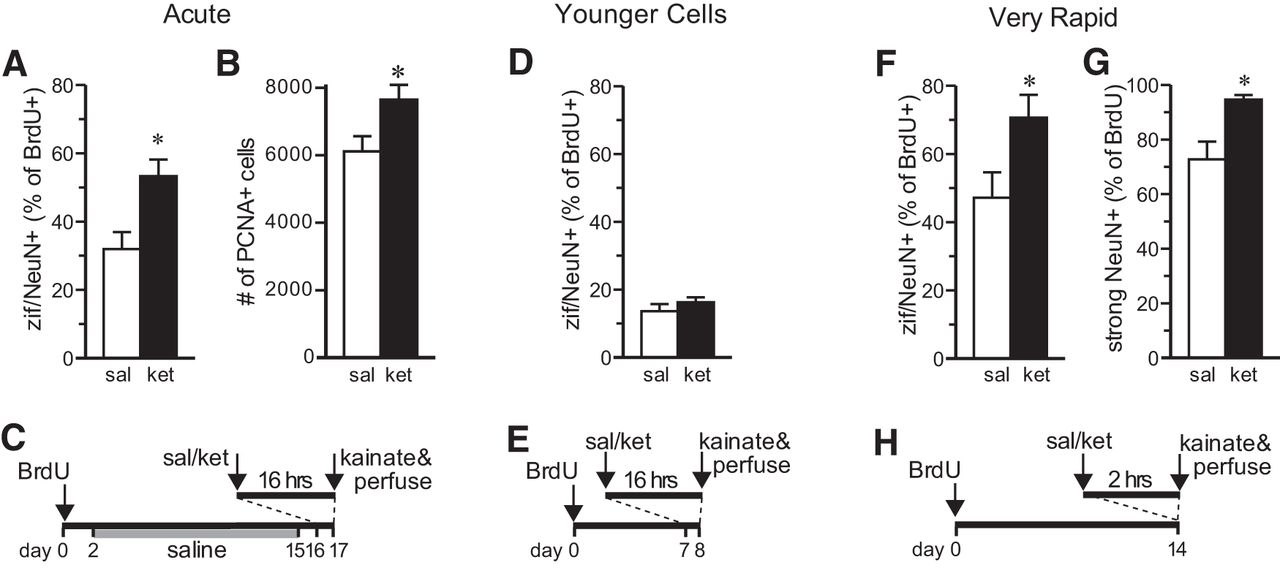
Rapid effects of ketamine on granule cell maturation and proliferation. A, S-ketamine (ket) increased the proportion of 16-d-old BrdU+ cells colabeled with NeuN and zif268 (zif) 16 h later, relative to saline-treated controls (sal) (*t test, t(4) = 3.065, p =0.0375). All bars represent mean ± SEM. B, S-ketamine increased the number of PCNA+ (dividing) cells in the subgranular zone 16 h later (*t test, t(10) = 2.42, p = 0.0359). C, Animal treatment time course for short-term effects; ketamine injection was 10 mg/kg, i.p., in each experiment. D, The maturation effect was not seen in 7-d-old cells (t test, t(9) = 0.98, p = 0.35). E, Animal treatment time course for short-term effects in young cells. F, G, Increased zif/NeuN coexpression and strong NeuN expression were seen in 14-d-old cells within 2 h of ketamine treatment (zif: *t test, t(9) = 2.33, p = 0.0450; strong NeuN: *t test, t(9) = 3.55, p = 0.0062). H, Animal treatment time course for very rapid effects on maturation.
- Figure 4.
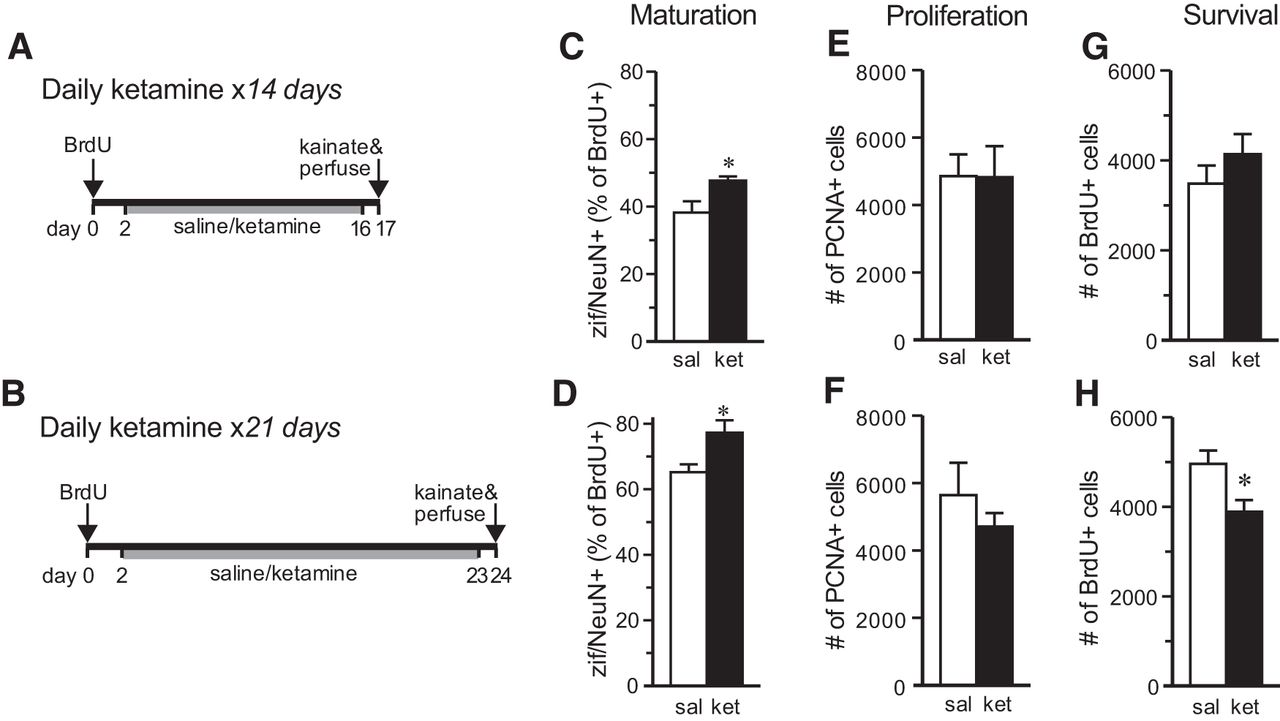
Effects of long-term ketamine treatment. A, B, Animal treatment time courses; all ketamine injections were 10 mg/kg, i.p. C, D, Long-term daily ketamine treatment for 14 d (C) or 21 d (D) increased the proportion of zif/NeuN+ BrdU+ granule cells (*14 d: t test, t(9) = 3.20, p = 0.0108; *21 d: t test, t(11) = 2.773, p = 0.0181). E, F, S-ketamine had no effect on cell proliferation when administered daily for 14 or 21 d (14 d: t(10) = 0.035, p = 0.973; 21 d: t(9) = 0.955, p = 0.365). G, H, BrdU+ cell survival was unaffected by 14 d of daily treatment with S-ketamine (t test, t(10) = 1.03, p = 0.33) but was decreased after 21 d (*t test, t(12) = 2.71, p = 0.0191). All bars represent the mean ± SEM (n = 6-7 per group).
- Figure 5.
Sustained effects of S-ketamine in a depression model. A, Ketamine given 32 d earlier increased zif/NeuN expression in 16-d-old cells regardless of long-term corticosterone exposure (main effect of CORT: F(1,17) = 0.00, p = 0.996; *main effect of ketamine: F(1,17) = 14.99, p = 0.0017; CORT × ketamine interaction: F(1,17) = 0.0005, p = 0.9821 by two-way ANOVA). B, S-ketamine increased the number of PCNA+ cells 32 d later and prevented the inhibition of proliferation by long-term corticosterone treatment (*main effect of ketamine: F(1, 23) = 7.44, p = 0.013; *main effect of CORT: F(1,23) = 8.35, p = 0.009; CORT × ketamine interaction: F(1,23) = 0.00, p = 0.988 by two-way ANOVA). C, Animal treatment time course for maturation and proliferation effects. D, A single S-ketamine injection prior to long-term CORT treatment prevented a decrease in sucrose preference (one-way ANOVA, F(2,15) = 6.98, p = 0.0072; *p < 0.05 vs saline in post hoc test). Values represent the mean ± SEM (n = 4-6 per group). E, Neither long-term exposure to CORT nor short-term ketamine exposure prior to CORT significantly altered new cell survival (F(2,15) = 1.12, p = 0.35 by one-way ANOVA). Values represent the mean ± SEM (n = 6-7 per group. F, Animal treatment time course for sucrose preference and survival effects.
- Figure 6.
Neurogenesis is not required for the S-ketamine effect on novelty-suppressed feeding. A, Animal treatment time course showing valganciclovir to inhibit neurogenesis, the injection of saline (sal) or ketamine (ket; 10 mg/kg), and NSF testing. B, Photographs show DCX-expressing young granule neurons (green) in the dentate gyrus of valganciclovir (VGCV)-treated wild-type rats (WT), but not in GFAP-TK (TK) rats. Blue counterstain shows cell nuclei. C, Higher magnification of granule cell layer showing DCX staining. D, Quantification shows near-complete absence of DCX+ new neurons in GFAP-TK rats and no effect of short-term S-ketamine treatment on DCX+ cell number. (*main effect of genotype: F(1,20) = 183.6, p < 0.0001; main effect of ketamine: F(1,20) = 1.471, p = 0.2392; genotype × ketamine interaction: F(1,20) = 1.418, p = 0.2477, all by two-way ANOVA) E, In the NSF test, the latency to eat in a novel arena was decreased by S-ketamine in both wild-type and GFAP-TK rats (*main effect of genotype: F(1,20) = 0.2827, p = 0.6008; main effect of ketamine: F(1,20) = 13.24, p = 0.0016; genotype × ketamine interaction: F(1,20) = 0.3756, p = 0.5469, all by two-way ANOVA). All bars represent mean ± SEM.


Tables
Figure Description Data structure Type of test Power a 1A Latency to eat in NSF Normal distribution ANOVA p = 0.0052 b 1A Latency to eat in NSF (0 vs 10 mg/kg) Normal distribution Holm–Sidak post hoc test p = 0.0042 c 1B Immobility, main effect of treatment Normal distribution 2-way repeated measures ANOVA p < 0.0001 d 1B Immobility, main effect of time Normal distribution 2-way repeated measures ANOVA p = 0.0003 e 1B Immobility, treatment × time interaction Normal distribution 2-way repeated measures ANOVA p = 0.9980 f 1B Immobility, ketamine vs saline Normal distribution Holm–Sidak post hoc test p < 0.0001 g 3A Short-term effects on cell maturation Normal distribution t test p = 0.0375 h 3B Proliferation effects Normal distribution t test p = 0.0359 i 3D Maturation effects in younger cells Normal distribution t test p = 0.3548 j 3F Very rapid maturation effects Normal distribution t test p = 0.0450 k 3G Strong NeuN expression Normal distribution t test p = 0.0062 l 4C Long-term 14 d maturation effects Normal distribution t test p = 0.0108 m 4D Long-term 21 d maturation effects Normal distribution t test p = 0.0181 n 4E Long-term 14 d proliferation effects Normal distribution t test p = 0.9726 o 4F Long-term 21 d proliferation effects Normal distribution t test p = 0.365 p 4G Long-term 14 d survival effects Normal distribution t test p = 0.3280 q 4H Long-term 21 d survival effects Normal distribution t test p = 0.0191 r 5A Sustained maturation, main effect of CORT Normal distribution 2-way ANOVA p = 0.9964 s 5A Sustained maturation, main effect of ketamine Normal distribution 2-way ANOVA p = 0.0017 t 5A Sustained maturation, CORT × ketamine interaction Normal distribution 2-way ANOVA p = 0.9821 u 5B Proliferation, main effect of ketamine Normal distribution 2-way ANOVA p = 0.0130 v 5B Proliferation, main effect of CORT Normal distribution 2-way ANOVA p = 0.0091 w 5B Proliferation, CORT × ketamine interaction Normal distribution 2-way ANOVA p = 0.9883 x 5D Sucrose preference Normal distribution ANOVA p = 0.0072 y 5D Sucrose preference, vehicle/saline vs CORT/saline Normal distribution Holm-Sidak post hoc test p = 0.0074 z 5D Sucrose preference, CORT/saline vs CORT/ketamine Normal distribution Holm-Sidak post hoc test p = 0.0405 aa 5E Survival Normal distribution ANOVA p = 0.3512 bb 6D DCX+ cell number, main effect of genotype Normal distribution 2-way ANOVA p < 0.0001 cc 6D DCX+ cell number, main effect of ketamine Normal distribution 2-way ANOVA p = 0.2393 dd 6D DCX+ cell number, genotype × ketamine interaction Normal distribution 2-way ANOVA p = 0.2477 ee 6E Latency to eat in NSF, main effect of genotype Normal distribution 2-way ANOVA p = 0.6008 ff 6E Latency to eat in NSF, main effect of ketamine Normal distribution 2-way ANOVA p = 0.0016 ee 6E Latency to eat in NSF, genotype × ketamine interaction Normal distribution 2-way ANOVA p = 0.5469
In this issue


