

Article Figures & Data
Figures
- Figure 1.
TLR2 and TLR4 expression is increased in response to SOD1G93A overexpression. BV-2 cells were transiently transfected with CFP or SOD1G93A-CFP plasmids and harvested at 8 or 24 h post-transfection. A, tlr2 mRNA expression in transfected BV-2 cells was measured at 8 h post-transfection by qPCR analysis, relative to control gene gapdh (n = 8–10 wells pooled from 3 separate experiments; Kruskal–Wallis, Dunn’s multiple-comparison post hoc test). B, tlr4 mRNA was analyzed by qPCR analysis of BV-2 lysates 8 h post-transfection with CFP or SOD1G93A-CFP (n = 8–9 wells pooled from 2 separate experiments). Samples were normalized to internal control gapdh. C, E, TLR2 protein levels in CFP or SOD1G93A-CFP-transfected BV-2 cells analyzed by Western blot. BV-2 cells were lysed in RIPA buffer 24 h post-transfection via nucleofection (normalized to α-Tubulin OD, n = 6 wells pooled from 4 separate experiments; p = 0.031, two-tailed paired t test). D, F, TLR4 protein levels in CFP or SOD1G93A-CFP-transfected BV-2 cells analyzed by Western blot. BV-2 cells were lysed in RIPA buffer 24 h post-transfection via nucleofection (normalized to α-Tubulin OD n = 6 wells pooled from 4 separate experiments; p = 0.031, two-tailed paired t test). G, H, COX-II levels were assessed in SOD1G93A overexpressing BV-2 cells (n = 3 cultures from 2 separate platings; p = 0.016, two-tailed paired t test). BV-2 cells were transfected with CFP or SOD1G93A-CFP via electroporation and lysed in RIPA buffer 24 h post-transfection and prepared for Western blot analysis. I, J, COX-II levels in TLR2- and TLR4 -inhibited BV-2 cells following stimulation with CFP or SOD1G93A cMedia. BV-2 cells were treated with OxPAPC (30 µg/ml) simultaneous to cMedia treatment. Cells were lysed 24 h post-cMedia stimulation and prepared for Western blot analysis (n = 3 wells, p = 0.002, one-way ANOVA, Tukey’s multiple comparison post hoc test). K, NF-κB activity in TLR4-deficient HEK293 and HEK293-TLR4-stably expressing cells stimulated with SOD1G93A conditioned media. HEK293 and HEK293-TLR4 were cotransfected with κB-RE-luciferase and RLTK-Renilla-luciferase for normalization for 24 h and subsequently stimulated with CFP or SOD1G93A cMedia for 8 or 24 h. The cells were lysed in passive lysis buffer and measured as κB-dependent firefly activity normalized to renilla luciferase activity per well (n = 11 wells pooled from 2 separate experiments; p = 0.021, two-tailed paired t test between HEK-TLR4 treated cells). Conditioned media was generated by overexpression of CFP or SOD1G93A-CFP vectors in NSC-34 cells, with serum-free conditioned media collected 3 d post-transfection.
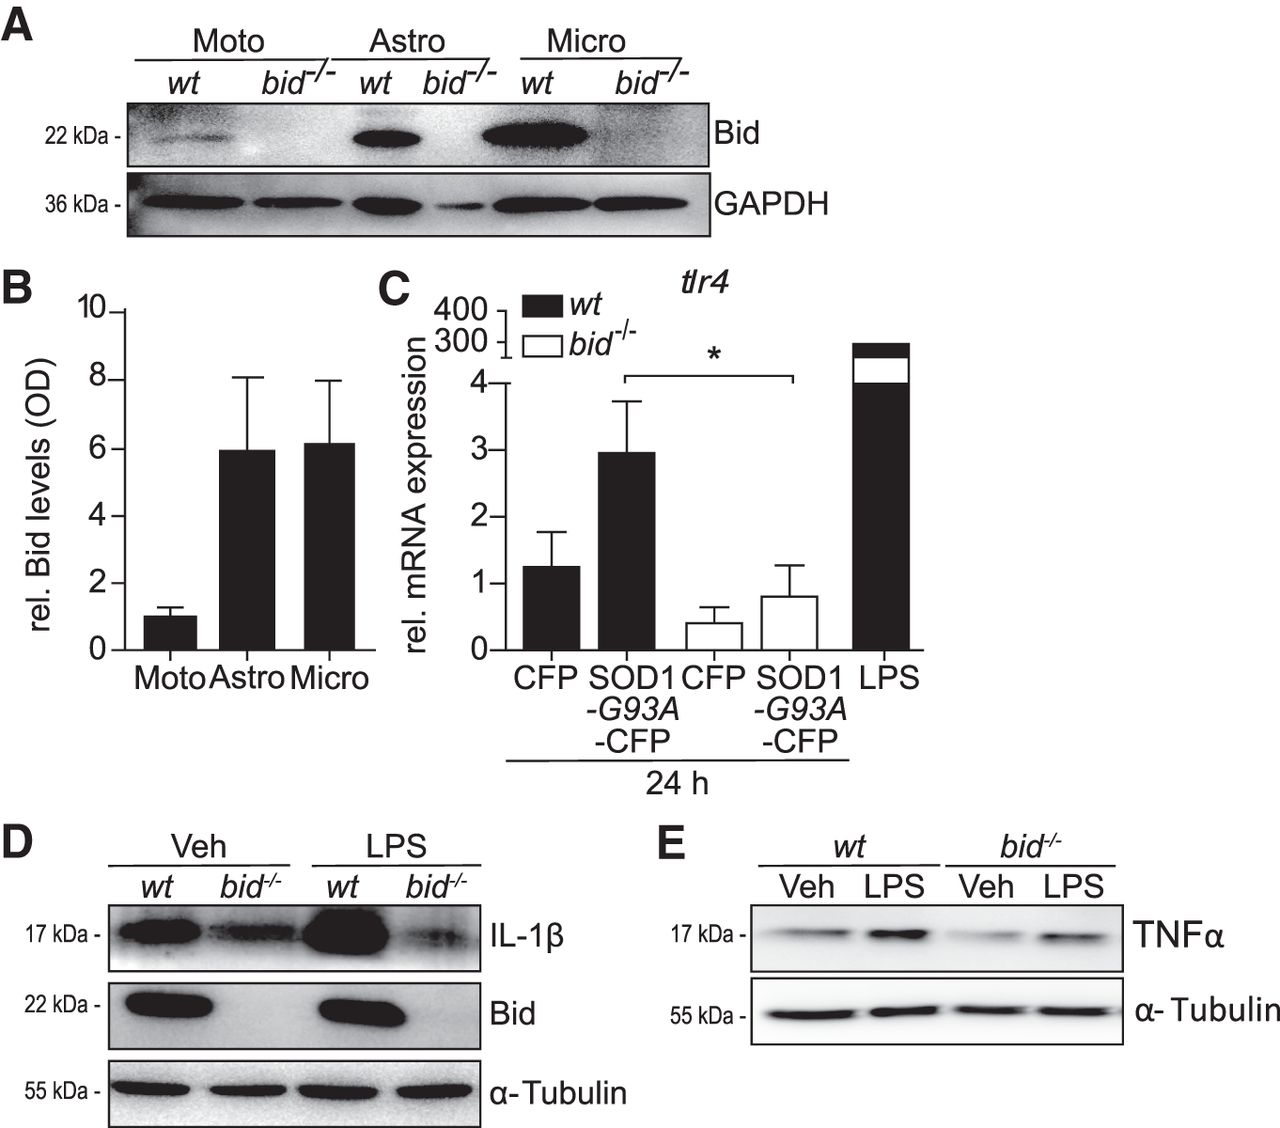
- Figure 2.
Bid is highly expressed in microglia, SOD1G93A-overexpressing bid-deficient microglia express reduced tlr4 mRNA levels compared with wild-type, and levels of proinflammatory IL-1β and TNFα are reduced in LPS-stimulated bid−/− microglia. A, Representative Western blot showing Bid levels and (B) quantification of optical density analysis of Bid levels in motoneurons, astrocytes and microglia. Primary mixed motoneurons were harvested at 7DIV, and purified astrocytes and isolated microglia were lysed 2 d post-plating to allow time for the cells to become quiescent. Bid protein levels were examined, by Western blot, in purified astrocytes and microglia at rest compared with motoneurons. Bid protein levels were assessed by measuring the optical densities of each sample relative to that of the respective loading control (B; GAPDH or β-actin, experiment was repeated 3 times with similar results). C, tlr4 mRNA expression in wild-type and bid−/− primary microglia overexpressing CFP or SOD1G93A-CFP, analyzed by qPCR. Samples were normalized to internal control gapdh (n = 4–6 wells pooled from 2 separate experiments; p = 0.027, one-way ANOVA, Bonferroni’s multiple-comparison post hoc test). D, IL-1β levels were analyzed by Western blot in wild-type and bid−/− microglia 4 h post-LPS treatment. E, TNFα levels were analyzed in wild-type and bid-deficient microglia 4 h post-LPS stimulation. Wild-type and bid−/− microglia were stimulated with vehicle, LPS (100 ng/ml) for 4 h before being harvested with RIPA lysis buffer and used for Western blot analysis.
- Figure 3.
Reduced phosphorylation of IKKα/β, p65 and delayed IκBα degradation and reduced NF-κB activation in bid−/− microglia. A, Primary wild-type and bid−/− microglia were stimulated with LPS for 5–30 min in serum-free media before being fixed in 3% paraformaldehyde and stained with anti-phosphorylated IKKα/β (pIKKα/β) and anti-CD11b. Immunohistochemistry analysis of anti-pIKKα/β mean fluorescence on CD11b-positive cells is depicted. Scale bar, 50 µm. B, C, Primary wild-type and bid−/− microglia were treated with LPS for 5, 15, 30 min, or 1 h in serum-free media before being lysed for Western blot analysis of pIKKα/β protein levels (n = 3 pooled from 3 separate experiments; p = 0.014, 3-way ANOVA, Tukey post hoc test). D, E, Wild-type and bid−/− microglia were stimulated with LPS for 5 min to 2 h in serum-free media, lysed in RIPA buffer and IκBα levels were analyzed by Western blot (n = 3–4 wells from 3–4 separate experiments). F, G, Wild-type and bid−/− microglia were stimulated with LPS for 1 h before being lysed in RIPA buffer. pp65 levels were assessed by Western blot (n = 7 wells pooled from 6 separate experiments; p = 0.0162, one-way ANOVA, Tukey’s post hoc test). H, BV-2 cells were cotransfected with NF-κB-RE-luciferase and renilla-luciferase plasmids for 24 h and subsequently treated with LPS for 24 h. The cells were lysed in passive lysis buffer and NF-κB activation was quantified by dual luciferase assay (represented as relative κB-dependent firefly activity, n = 6–16 wells pooled from 2 separate experiments, 2 outliers removed, Grubbs test followed by Kruskal–Wallis and Dunn’s multiple-comparison post hoc test). I, J, COX-II levels in Bid-depleted BV-2 cells stimulated with CFP or SOD1G93A cMedia. BV-2 cells were transfected with an siRNA targeting Bid (“siBid”) or a scrambled control siRNA (“siControl”), and stimulated with cMedia 48 h post-siRNA transfection, when Bid levels were optimally reduced. Twenty-four hours post-cMedia treatment the cells were lysed in RIPA and COX-II levels were measured. Dashed line indicated irrelevant lanes spliced out. Quantification of optical density was normalized to anti-α-tubulin for each Western blot (n = 3, from 3 separate experiments).
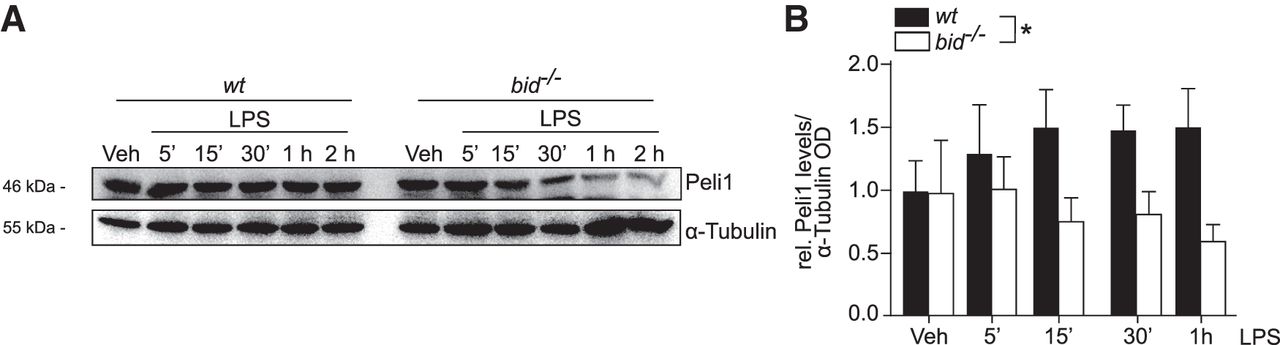
- Figure 4.
Peli1 levels are reduced in bid−/− microglia upon LPS stimulation. A, B, Peli1 levels were analyzed by Western blot analysis in wild-type and bid−/− microglia upon acute LPS stimulation (B; n = 3 cultures from 3 separate platings; three-way ANOVA, Tukey’s multiple-comparison post hoc test). Cells were stimulated with LPS (100 ng/ml) in serum-free media for the relevant treatment time points, lysed in RIPA buffer and prepared for Western blot analysis.
- Figure 5.
Bid associates with TRAF6 in microglia and astrocytes, as shown by coimmunoprecipitation and PLA. A, Coimmunoprecipitation of Bid and TRAF6 in BV-2 cells. BV-2 cells were stimulated with LPS (1 µg/ml) for 15 min or 1 h and Bid was immunoprecipitated. Negative controls included anti-Bid immunoprecipitation from bid-deficient mixed glia lysates, and IgG immunoprecipitation from all samples. Cells were lysed in RIPA buffer and analyzed for TRAF6 content after immunoprecipitation of Bid. B, Coimmunoprecipitation of Bid and TRAF6 in BV-2 cells overexpressing TRAF6-FLAG. BV-2 cells were stimulated with LPS (1 µg/ml) and lysed in RIPA buffer. FLAG was detected by Western blotting and represents TRAF6FLAG immunoprecipitated with Bid in BV-2 cells. An IgG immunoprecipitation was included as a negative control. C, Coimmunoprecipitation of Bid and TRAF6 in WT and bid-deficient primary mixed glia stimulated with LPS for 1 and 4 h (100 ng/ml). Samples were lysed post-LPS stimulation and Bid was immunoprecipitated from the lysates. The samples were analyzed for TRAF6 content by Western blotting. IgG immunoprecipitation was carried out as an additional negative control. D, Coimmunoprecipitation of Bid and TRAF6 in wild-type and bid−/− astrocytes. Purified astrocytes were stimulated with LPS (100 ng/ml) for 1 and 4 h, and lysed in RIPA buffer for Bid immunoprecipitation. The samples were analyzed for TRAF6 by Western blotting. E, Representative images of PLA and phase contrast in TRAF6-FLAG overexpressing BV-2 cells immunostained with anti-Bid and anti-TRAF6 (n = 2 wells/condition, 4 fields of view per well). Negative control representative images of PLA in TRAF6-FLAG overexpressing BV-2 cells immunostained with anti-TRAF6 and anti-HA-tag (n = 1 well/condition, 6 fields of view-LPS, 1 field of view + LPS), or immunostained with anti-Bid and anti-IRF2 (n = 1 well/condition, 7 fields of view). Scale bar, 10 µm. F, Quantification of PLA interactions in BV-2 cells. BV-2 cells were transfected with TRAF6-FLAG or empty FLAG vector and stimulated with LPS for 1 h. The cells were fixed with 3% paraformaldehyde, incubated with anti-Bid and anti-TRAF6 and PLA was quantified (significant increase of PLA dots in TRAF6 transfected versus control transfected cells and vehicle vs LPS treated cells, two-way ANOVA). Negative controls included immunostaining with anti-Bid plus anti-IRF2, and anti-TRAF6 plus anti-HA-tag.
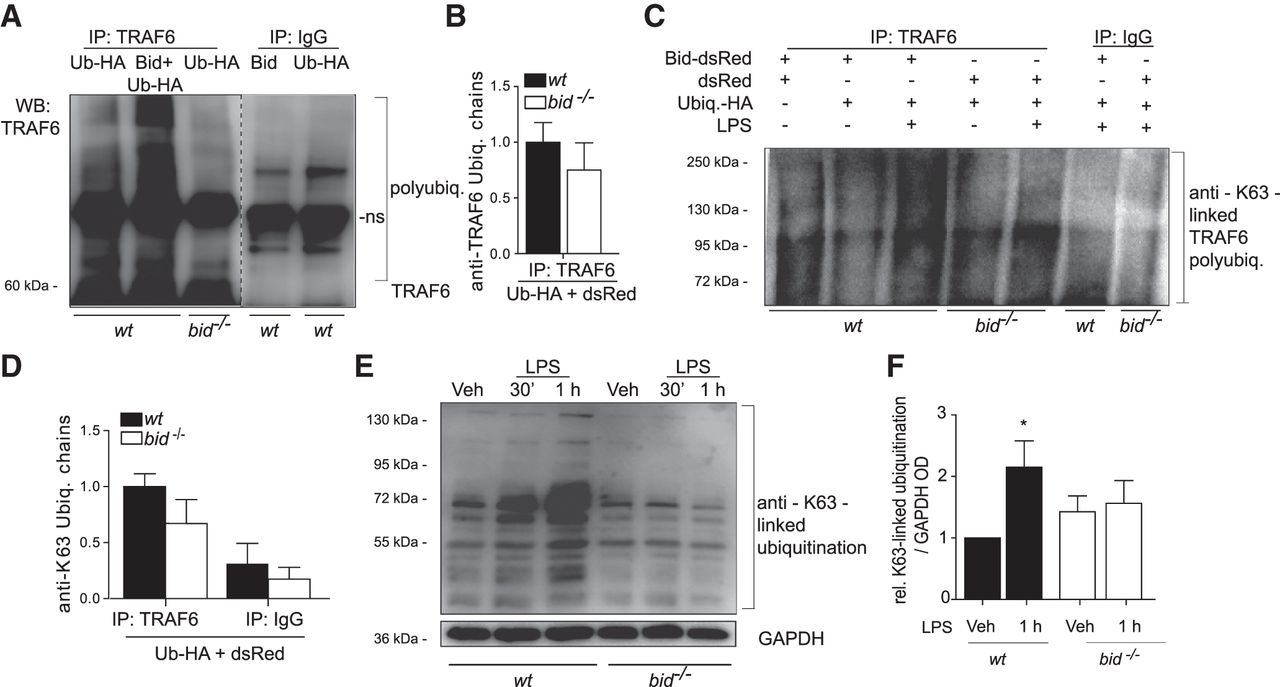
- Figure 6.
Bid promotes K63-linked polyubiquitination of TRAF6. A, TRAF6 polyubiquitination levels in wild-type and bid−/− glia. TRAF6 was immunoprecipitated and TRAF6 polyubiquitination was assessed in WT mixed glia overexpressing Bid-dsRed plus Ubiquitin-HA (HA-Ub), and wild-type glia overexpressing ubiquitin-HA plus dsRed. bid−/− glia were transfected with ubiquitin-HA plus dsRed. Immunoprecipitation of IgG was used as an immunoprecipitation control. Single membrane cut as represented by dashed line. B, Quantification of TRAF6-linked ubiquitin chains, as measured by OD in wild-type and bid−/− glia transfected with ubiquitin-HA plus dsRed (n = 2 pooled from 2 separate experiments). C, Wild-type and bid−/− glia were transfected with the following plasmids, Bid plus dsRed, ubiquitin-HA plus dsRed or Bid plus ubiquitin-HA plasmids for 24 h and subsequently stimulated with LPS for 1 h. The cells were lysed in RIPA buffer. TRAF6 was immunoprecipitated from the transfected cell lysates and the samples were analyzed by Western blot. The membrane was exposed to an anti-K63-linked ubiquitin-specific antibody, which identified the K63-linked ubiquitination of TRAF6. D, Quantification of TRAF6 K63-linked ubiquitin chains, as measured by optical density in wild-type and bid−/− glia transfected with ubiquitin-HA plus dsRed (n = 2–3 from 2–3 separate experiments). E, Representative Western blot of total K63-linked ubiquitination levels in WT and bid-deficient microglia upon LPS stimulation. F, Quantification of OD analyses of total K63-linked polyubiquitination in wild-type and bid−/− microglia following LPS stimulation (n = 3 cultures from 3 separate experiments; p = 0.050, one-way ANOVA, Dunn’s multiple-comparison post hoc test). Wild-type and bid−/− microglia were treated with LPS (100 ng/ml) for 30 min or 1 h before lysis in RIPA buffer and K63-linked ubiquitination levels were analyzed probing with anti-K63-linked ubiquitin-specific antibodies in Western blotting experiments.


Tables
Label Data structure Type of test Significance Fig. 1A Nonparametric Paired two-tailed t test n = 8–10 culturesp = 0.0156 Fig. 1B Nonparametric Paired two-tailed t test n = 8–9 culturesp= 0.007 Fig. 1E Nonparametric Paired two-tailed t test n = 6 culturesp= 0.031 Fig. 1F Nonparametric Paired two-tailed t test n = 6 culturesp= 0.031 Fig. 1H Nonparametric Paired two-tailed t test n = 3 culturesp= 0.0106 Fig. 1J Parametric One-way ANOVA, Tukey post-hoc test n = 3 culturesp= 0.0021 Fig. 1K Parametric Paired two-tailed t test n = 11 wells from 2 separate experimentsp= 0.0216 HEKTLR4 cells CFP vs SOD1G93A Fig. 2C Parametric One-way ANOVA, Bonferroni’s multiple-comparison test n = 4–6 culturesp= 0.027 Fig. 3C Parametric Three-way ANOVA, Tukey post hoc test n = 3 culturesp= 0.0147 WT vs bid Fig. 3G Parametric One-way ANOVA, Tukey’s multiple-comparison test n = 7 culturesp= 0.0162 Fig. 3H NonparametricGrubbs outlier removal Kruskal–Wallis test, Dunn’s multiple-comparison post hoc test n = 6–16 culturesDMSO LPS vs DMSO Vehp < 0.0001BI Veh vs DMSO Vehp = 0.6926BI LPS vs DMSO Vehp = 0.5933BI Veh vs DMSO LPSp < 0.0001BI LPS vs DMSO LPSp= 0.0162BI LPS vs BI Vehp = 0.0162 Fig. 4B Parametric Three-way ANOVA, Tukey post hoc test n = 3 culturesp = 0.000823WT vs bid Fig. 5F Nonparametric Kruskal–Wallis, Dunn’s multiple-comparison post hoc test p = 0.0378minus LPS vs plus LPS Fig. 6F Nonparametric Kruskal–Wallis, Dunn’s multiple-comparison post hoc test n = 3 culturesp = 0.0509
In this issue


