

Article Figures & Data
Figures
- Figure 1.
Study design and experimental task. A, Study design. B, Before the scanner session, participants rated 50 foods for their healthiness and tastiness, in two separate ratings blocks, the order of which was counterbalanced across participants. For each participant, the health- and taste-neutral food was selected as the reference food for the scanner task. C, The scanner food choice task featured the same 50 items presented as part of free and forced trials. Free and forced trials, of 8 s duration, were presented in a randomized order. After the decision trial was over, a 1 s feedback screen presented the decision that was made. This was followed by a 0.5 s blank screen. On 30 random occasions during the course of the task, a 6 s null trial with a fixation cross was presented after the blank screen.
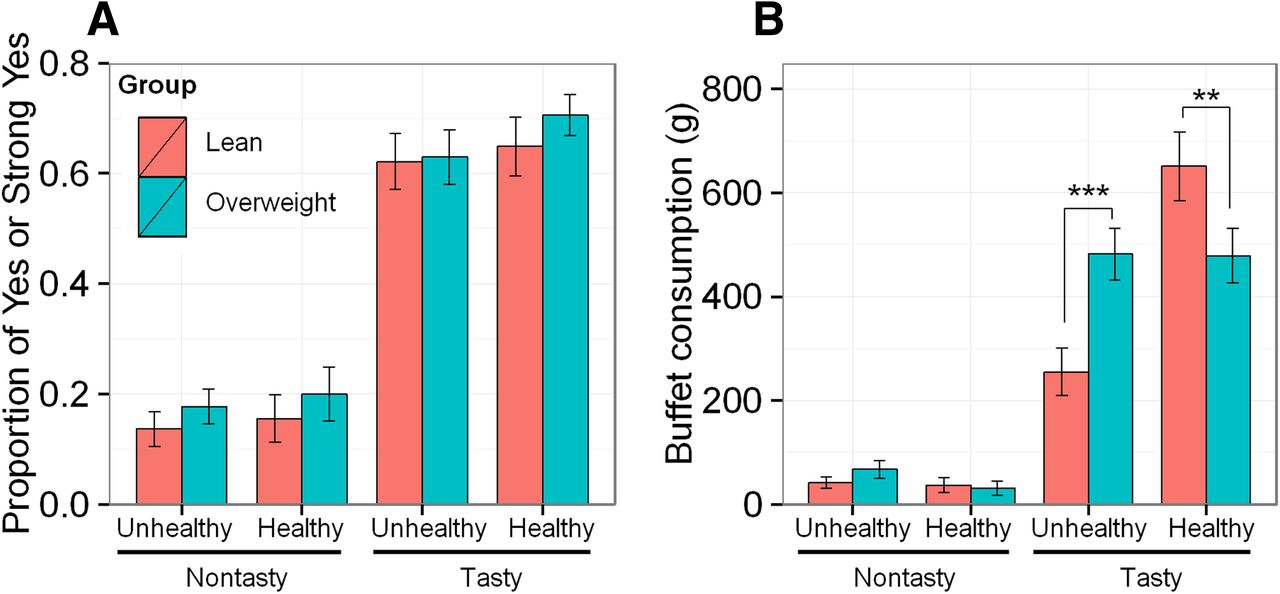
- Figure 2.
Food choices in the scanner task and in the buffet lunch. A, The proportion of acceptance of food swaps (selecting “yes” or “strong yes”) in the scanner food choice task, across four categories of foods, in lean participants (n = 23) and overweight participants (n = 40). B, Buffet consumption (expressed as the weight of consumed foods) across four food categories, in lean and overweight participants. **p < 0.01, ***p < 0.001. Error bars represent the SEM.
- Figure 3.
Neural measures of the goal value of food. A, The neural representation of goal value in the vmPFC. The results of the fMRI analysis were rendered onto a standard SPM8 T1 template image, with coronal and sagittal sections presented at the coordinates appropriate for displaying the vmPFC cluster (pFWE < 0.05, corrected at the cluster level; p < 0.001 uncorrected threshold). B, Health and taste beta value extracted from the vmPFC activity, in lean and overweight participants. Error bars represent the SEM.
- Figure 4.
Model of healthy food consumption. Visual depiction of the multiple linear regression model 2 (Table 2). A, A partial residual plot of the proportion of healthy foods consumed as a function of the neural health beta value, in lean and overweight participants. B, A partial residual plot of the proportion of healthy foods consumed as a function of BIS-11 impulsivity scores, in lean and overweight participants. Each dot represents one participant.


Tables
Measure Lean (n = 23) Overweight/obese (n = 40) t/χ2 p BMI (kg/m2) 21.88 (1.3) 30.84 (4.82) 8.70 <0.001 Age (years) 29.78 (6.00) 29.85 (5.75) 0.04 0.97 Gender Female 13 23 0.01 0.99 Male 10 17 Education University degree 13 21 0.01 0.96 No university degree 10 19 Average yearly income (£) ≤9,999 7 11 2.41 0.49 10,000–19,999 10 13 20,000–29,999 3 12 30,000–39,999 3 3 Ethnicity White 20 35 0.90 0.82 Black 1 2 Asian 2 2 Other 0 1 IQ 107.45 (12.78) 111.28 (17.45) 0.90 0.37 DEBQ Restraint 22.86 (8.35) 26.58 (5.87) 2.05 0.05 Emotional 27.23 (8.15) 31.58 (9.58) 1.80 0.08 External 30.73 (4.58) 32.45 (6.15) 1.15 0.26 Values are reported as the mean (SD) or n, unless otherwise indicated. DEBQ, Dutch Eating Behavior Questionnaire.
Food kcal/100 g Fat/100 g Saturated fat/100 g Weight/volume as served (g) Calories available Cheddar crackers 509 27.7 16.0 200 1018 Oatcake crackers 449 21.8 8.4 200 898 Chocolate mini bites 440 19.8 3.5 200 880 Eat natural cereal bar 456 24.7 16.4 200 912 Fruit pastille sweets 330 Trace 100 330 Dried mixed fruit 280 0.6 0.2 100 280 Scotch eggs 235 15.3 8.0 400 940 Broccoli and tomato quiche 215 13.2 4.3 400 860 BLT sandwich 225 10.0 2.2 354 797 Chicken salad sandwich 195 7.5 1.0 400 780 Trifle 160 5.4 3.4 600 960 Strawberry yogurt 111 2.6 1.7 600 666 Coke 42 1 L 420 Orange juice 48 1 L 480 Diet coke 1 L Water 1 L - Table 3.
Mean scores of neurocognitive measures of impulsivity in lean and overweight participants
Measure Lean Overweight t p SSRT (n = 61) 161.09 ms (39.5 ms) 172.1 ms (58 ms) −0.80 0.43e SI (n = 62) 229.03 ms (231.07 ms ) 243.71 ms (249.23 ms) 0.23 0.82f BIS-11 (n = 63) 66.74 (7.79) 62.3 (9.11) 1.96 0.06g Values are reported as the mean (SD), unless otherwise indicated.
Region Side Cluster size (voxels) Peak MNI coordinates Peak scores x y z T Z Medial frontal gyrus L/R 1556 −8 44 −4 6.3 5.55 Cuneus R 663 18 −92 20 5.25 4.78 Posterior cingulate L/R 544 −8 −46 36 4.48 4.16 p < 0.05 whole-brain FWE correction for multiple comparisons at the cluster level (p < 0.001 uncorrected threshold).
- Table 5.
Regression coefficients and corresponding p values of the best-fitting models of healthy food consumption in the buffet, as a function of neural health β value, group, and impulsivity scores
Predictor β p Model 1x Neural health beta value 0.26 0.03 Group (overweight − lean) −0.37 0.002 Model 2y BIS-11 0.04 0.83 Neural health beta value 0.22 0.03 Group (overweight − lean) −0.47 <0.001 BIS-11:Group (overweight − lean) −0.43 0.02 x F(2,59) = 9.65, p < 0.001; R 2 = 0.22, ms = 0.0596.
y F(4,55) = 12.12, p < 0.000; R 2 = 0.43, ms = 0.0451.
- Table 6.
Regression coefficients and corresponding p values of the best fitting models of healthy food consumption in the buffet, as a function of behavioral health β value, group and impulsivity scores
Predictor β P Model 1z Behavioral health beta value 0.44 <0.0001 Group (overweight − lean) −0.4 <0.001 Model 2α BIS-11 0.04 0.81 Behavioral health beta value 0.26 0.03 Group (overweight − lean) −0.47 <0.001 BIS-11 group (overweight − lean) −0.41 0.02 z F(2,59) = 17.61, p < 0.0001, R 2 = 0.35, ms = 0.0521.
α F(4,55) = 12.3, p < 0.0001, R 2 = 0.43, ms = 0.0457.
Test Data structure Type of test Test statistic p value [Confidence interval]/power a: Overweight − lean Normal distribution Linear mixed-effects model t(61) = −1.47 0.15 [−0.25, 0.04] b: Overweight – lean Normal distribution Linear mixed-effects model t(61) = 1.22 0.23 [−0.09, 0.37] c: Main effect of taste Normal distribution Linear mixed-effects model F(1,180) = 309.11 < 0.0001 1 c: Main effect of health Normal distribution Linear mixed-effects model F(1,180) = 2.78 0.1 0.39 c: Main effect of group Normal distribution Linear mixed-effects model F(1,61) = 0.74 0.39 0.14 c: Health × taste interaction Normal distribution Linear mixed-effects model F(1,180) = 0.51 0.48 0.11 c: Health × group interaction Normal distribution Linear mixed-effects model F(1,180) = 0.2 0.66 0.07 c: Taste × group interaction Normal distribution Linear mixed-effects model F(1,180) = 0.03 0.87 0.05 c: Health × taste × group interaction Normal distribution Linear mixed-effects model F(1,180) = 0.17 0.68 0.07 d: Main effect of taste Normal distribution Linear mixed-effects model F(1,180) = 1.88 0.17 0.28 d: Main effect of health Normal distribution Linear mixed-effects model F(1,180) = 0.96 0.33 0.17 d: Main effect of group Normal distribution Linear mixed-effects model F(1,61) = 1.74 0.19 0.27 d: Health × taste interaction Normal distribution Linear mixed-effects model F(1,180) = 0.37 0.54 0.09 d: Health × group interaction Normal distribution Linear mixed-effects model F(1,180) = 0.61 0.43 0.12 d: Taste × group interaction Normal distribution Linear mixed-effects model F(1,180) = 2.19 0.14 0.32 d: Health × taste × group interaction Normal distribution Linear mixed-effects model F(1,180) = 0.04 0.85 0.05 e: Overweight − lean Normal distribution Two-sample t test t(1,59) = −0.8 0.43 [−38.4, 16.4] f: Overweight – lean Normal distribution Two-sample t test t(1,60) = −0.24 0.81 [−156, 122] g: Overweight – lean Normal distribution Two-sample t test t(1,61) = 1.96 0.06 [−0.09, 8.97] h: Main effect of taste Normal distribution Linear mixed-effects model F(1,169) = 219.13 <0.0001 1 h: Main effect of health Normal distribution Linear mixed-effects model F(1,169) = 4.35 0.04 0.56 h: Main effect of group Normal distribution Linear mixed-effects model F(1,60) = 0.29 0.59 0.08 h: Health × taste interaction Normal distribution Linear mixed-effects model F(1,169) = 8.23 0.005 0.83 h: Health × group interaction Normal distribution Linear mixed-effects model F(1,169) = 13.09 0.0004 0.96 h: Taste × group interaction Normal distribution Linear mixed-effects model F(1,169) = 0.13 0.72 0.07 h: Health × taste × group interaction Normal distribution Linear mixed-effects model F(1,169) = 9.29 0.003 0.87 i: Main effect of taste Normal distribution Linear mixed-effects model F(1,162) = 135.05 < 0.0001 1 i: Main effect of health Normal distribution Linear mixed-effects model F(1,162) = 6.2 0.01 0.71 i: Main effect of group Normal distribution Linear mixed-effects model F(1,60) = 0.01 0.97 0.05 i: Health × taste interaction Normal distribution Linear mixed-effects model F(1,162) = 0.48 0.49 0.11 i: Health × group interaction Normal distribution Linear mixed-effects model F(1,162) = 8.04 0.005 0.82 i: Taste × group interaction Normal distribution Linear mixed-effects model F(1,162) = 0.04 0.84 0.05 i: Health × taste × group interaction Normal distribution Linear mixed-effects model F(1,162) = 7.06 0.009 0.77 j: Main effect of taste Normal distribution Linear mixed-effects model F(1,92) = 59.26 < 0.0001 1 j: Main effect of health Normal distribution Linear mixed-effects model F(1,92) = 41.04 < 0.0001 1 j: Main effect of group Normal distribution Linear mixed-effects model F(1,60) = 1.1 0.29 0.19 j: Health × taste interaction Normal distribution Linear mixed-effects model F(1,92) = 1.52 0.22 0.24 j: Health × group interaction Normal distribution Linear mixed-effects model F(1,92) = 3.21 0.08 0.44 j: Taste × group interaction Normal distribution Linear mixed-effects model F(1,92) = 0.59 0.44 0.12 j: Health × taste × group interaction Normal distribution Linear mixed-effects model F(1,92) = 2.52 0.12 0.36 k: Main effect of taste Normal distribution Linear mixed-effects model F(1,169) = 137.84 <0.0001 1 k: Main effect of health Normal distribution Linear mixed-effects model F(1,169) = 16.2 0.0001 0.98 k: Main effect of group Normal distribution Linear mixed-effects model F(1,60) = 0.26 0.61 0.08 k: Health × taste interaction Normal distribution Linear mixed-effects model F(1,169) = 4.76 0.03 0.59 k: Health × group interaction Normal distribution Linear mixed-effects model F(1,169) = 11.86 0.0007 0.94 k: Taste × group interaction Normal distribution Linear mixed-effects model F(1,169) = 0.05 0.83 0.06 k: Health × taste × group interaction Normal distribution Linear mixed-effects model F(1,169) = 9.98 0.002 0.89 L Normal distribution One-sample t test t(62) = 6.42 <0.0001 [0.26, 0.5] M Normal distribution One-sample t test t(62) = 0.88 0.38 [−0.04, 0.12] n: Main effect of attribute Normal distribution Linear mixed-effects model F(1,61) = 23.24 <0.0001 0.99 n: Main effect of group Normal distribution Linear mixed-effects model F(1,61) = 0.21 0.65 0.07 n: Attribute × group interaction Normal distribution Linear mixed-effects model F(1,61) = 1.54 0.22 0.24 o: Overweight − lean Normal distribution Two-sample t test t(61) = −1.69 0.09 [−0.03, 0.3] p: Overweight − lean Normal distribution Two-sample t test t(61) = 0.45 0.66 [−0.3, 0.19] q: Main effect of attribute Normal distribution Linear mixed-effects model F(1,59) = 22.5 <0.0001 0.99 q: Main effect of group Normal distribution Linear mixed-effects model F(1,59) = 0.2 0.65 0.07 q: Main effect of BIS-11 Normal distribution Linear mixed-effects model F(1,59) =0.01 0.83 0.06 q: Attribute × group interaction Normal distribution Linear mixed-effects model F(1,59) = 1.5 0.23 0.24 q: Attribute × BIS-11 interaction Normal distribution Linear mixed-effects model F(1,59) = 0.1 0.75 0.06 q: Group × BIS-11 interaction Normal distribution Linear mixed-effects model F(1,59) = 0.01 0.93 0.05 q: Attribute × group × BIS-11 interaction Normal distribution Linear mixed-effects model F(1,59) = 0.01 0.93 0.05 r Normal distribution One-sample t test t(62) = 21.53 <0.0001 [0.51, 0.61] s Normal distribution One-sample t-test t(62) = 1.92 0.06 [0, 0.15] t: Main effect of attribute Normal distribution Linear mixed-effects model F(1,61) = 100.92 <0.0001 1 t: Main effect of group Normal distribution Linear mixed-effects model F(1,61) = 0.47 0.47 0.11 t: Attribute × group interaction Normal distribution Linear mixed-effects model F(1,61) = 0.01 0.94 0.05 u: Overweight − lean Normal distribution Two-sample t test t(61) = −0.39 0.69 [−0.13, 0.19] v: Overweight − lean Normal distribution Two-sample t test t(61) = −0.73 0.47 [−0.07, 0.15] w: Main effect of attribute Normal distribution Linear mixed-effects model F(1,59) = 100.9 < 0.0001 1 w: Main effect of group Normal distribution Linear mixed-effects model F(1,59) = 0.5 0.47 0.11 w: Main effect of BIS-11 Normal distribution Linear mixed-effects model F(1,59) = 0.4 0.54 0.1 w: Attribute × group interaction Normal distribution Linear mixed-effects model F(1,59) = 0.01 0.94 0.05 w: Attribute × BIS-11 interaction Normal distribution Linear mixed-effects model F(1,59) = 3.2 0.08 0.44 w: Group × BIS-11 interaction Normal distribution Linear mixed-effects model F(1,59) = 0.2 0.65 0.07 w: Attribute × group × BIS-11 interaction Normal distribution Linear mixed-effects model F(1,59) = 0.2 0.67 0.07 x: Neural β value Normal distribution Linear model t(1,59) = 2.24 0.03 [0.02, 0.43] x: Overweight − lean Normal distribution Linear model t(1,59) = −3.24 0.002 [−0.35, −0.08] y: BIS-11 Normal distribution Linear model t(1,55) = −0.21 0.83 [−0.01, 0.01] y: Neural β value Normal distribution Linear model t(1,55) = 2.21 0.03 [0.02, 0.36] y: Overweight − lean Normal distribution Linear model t(1,55) = −4.35 <0.0001 [−0.39, −0.15] y: BIS-11 × (overweight − lean) interaction Normal distribution Linear model t(1,55) = −2.45 0.02 [−0.03, 0] z: Behavioral β value Normal distribution Linear model t(1,59) = 4.25 < 0.0001 [0.2, 0.57] z: Overweight − lean Normal distribution Linear model t(1,59) = −3.9 0.0003 [−0.36, −0.11] α: BIS-11 Normal distribution Linear model t(1,55) = 0.24 0.81 [−0.01, 0.01] α: Behavioral β value Normal distribution Linear model t(1,55) = 2.29 0.03 [0.03, 0.43] α: Overweight − lean Normal distribution Linear model t(1,55) = −4.35 < 0.0001 [−0.39, −0.15] α: BIS-11 x (overweight − lean) interaction Normal distribution Linear model t(1,55) = −2.34 0.02 [−0.03, 0]
In this issue


