

Article Figures & Data
Figures
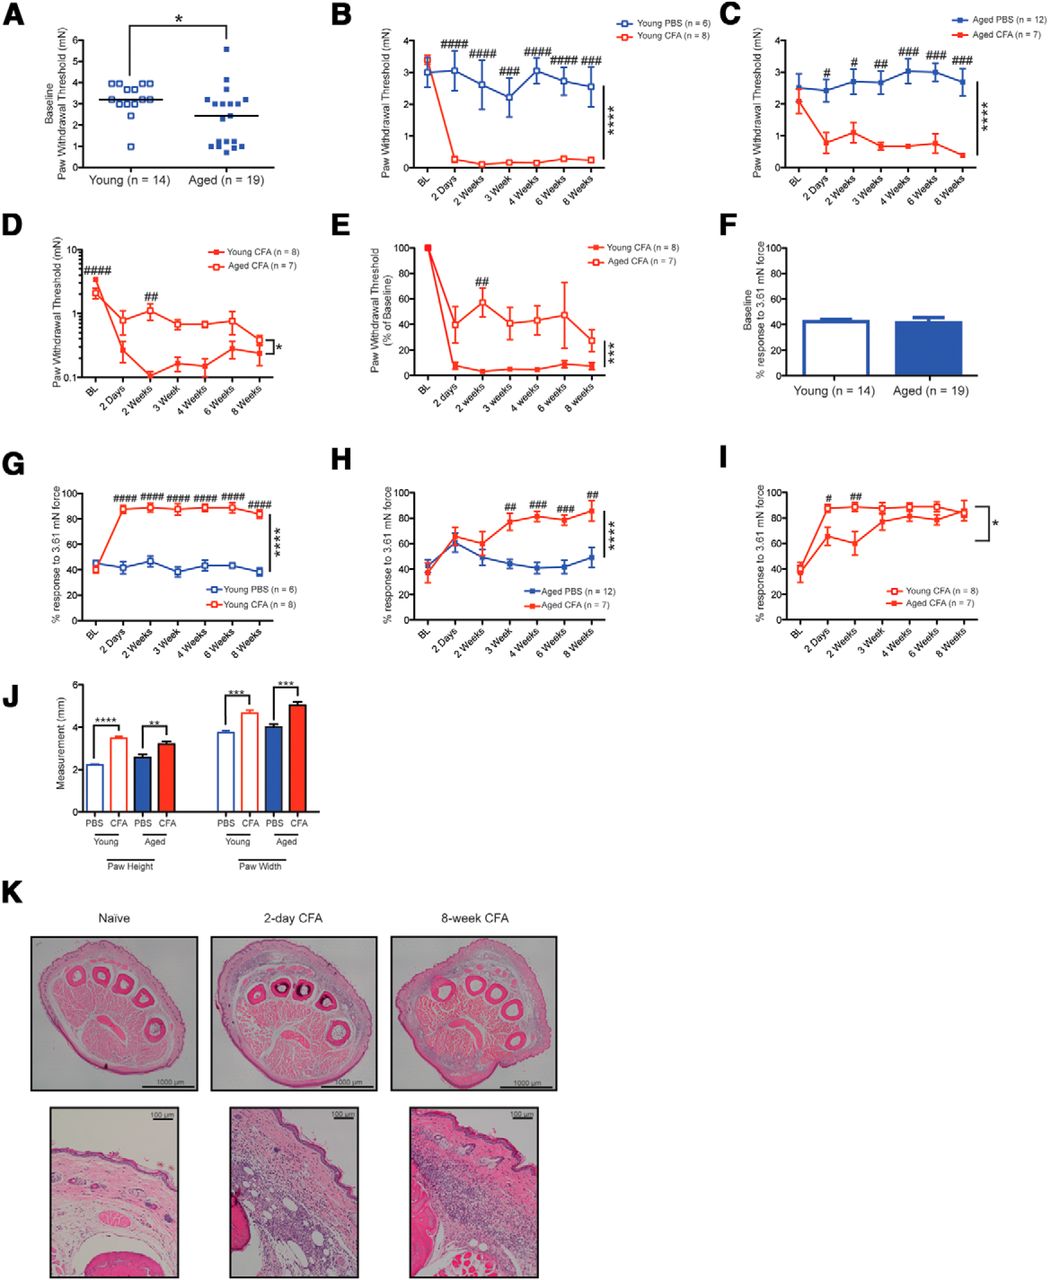
- Figure 1.
Acute and chronic inflammation sensitizes behavioral responses to mechanical stimuli to different extents in young and aged mice. A, Paw withdrawal thresholds to a mechanical stimulus are lower in aged animals (2.35 mN) compared with young animals (3.23 mN) at baseline. B, C, Injection of CFA results in a dramatic reduction in paw withdrawal thresholds both acutely and chronically in young (B) and aged (C) mice compared with PBS injection. D, Young mice exhibit a greater reduction in paw withdrawal thresholds compared with aged mice. E, As a percentage of baseline, young mice exhibit a >90% reduction in paw withdrawal thresholds, while aged mice exhibit a 40-75% reduction in paw withdrawal thresholds. F, Baseline responses to a 3.61 mN suprathreshold stimulus are similar between young and aged mice. G, H, Injection of CFA results in a significant elevation in the percentage of response to a suprathreshold 3.61 mN stimulus in both young (G) and aged (H) mice. I, In response to the injection of CFA, aged mice respond with elevations in the percentage response to a suprathreshold stimulus on a different time course than young mice. J, Chronically inflamed mice continue to exhibit significant paw swelling at 8 weeks after inflammation induction. K, Top row, H&E-stained coronal sections through the entire paw at the metatarsophalangeal joint from young animals show significant inflammatory infiltrate present at both 2 days and 8 weeks after CFA injection. Bottom row, Increased magnification of the whole-paw sections demonstrate significant infiltration of neutrophils and monocytes/macrophages at both 2 days and 8 weeks of CFA-mediated inflammation.
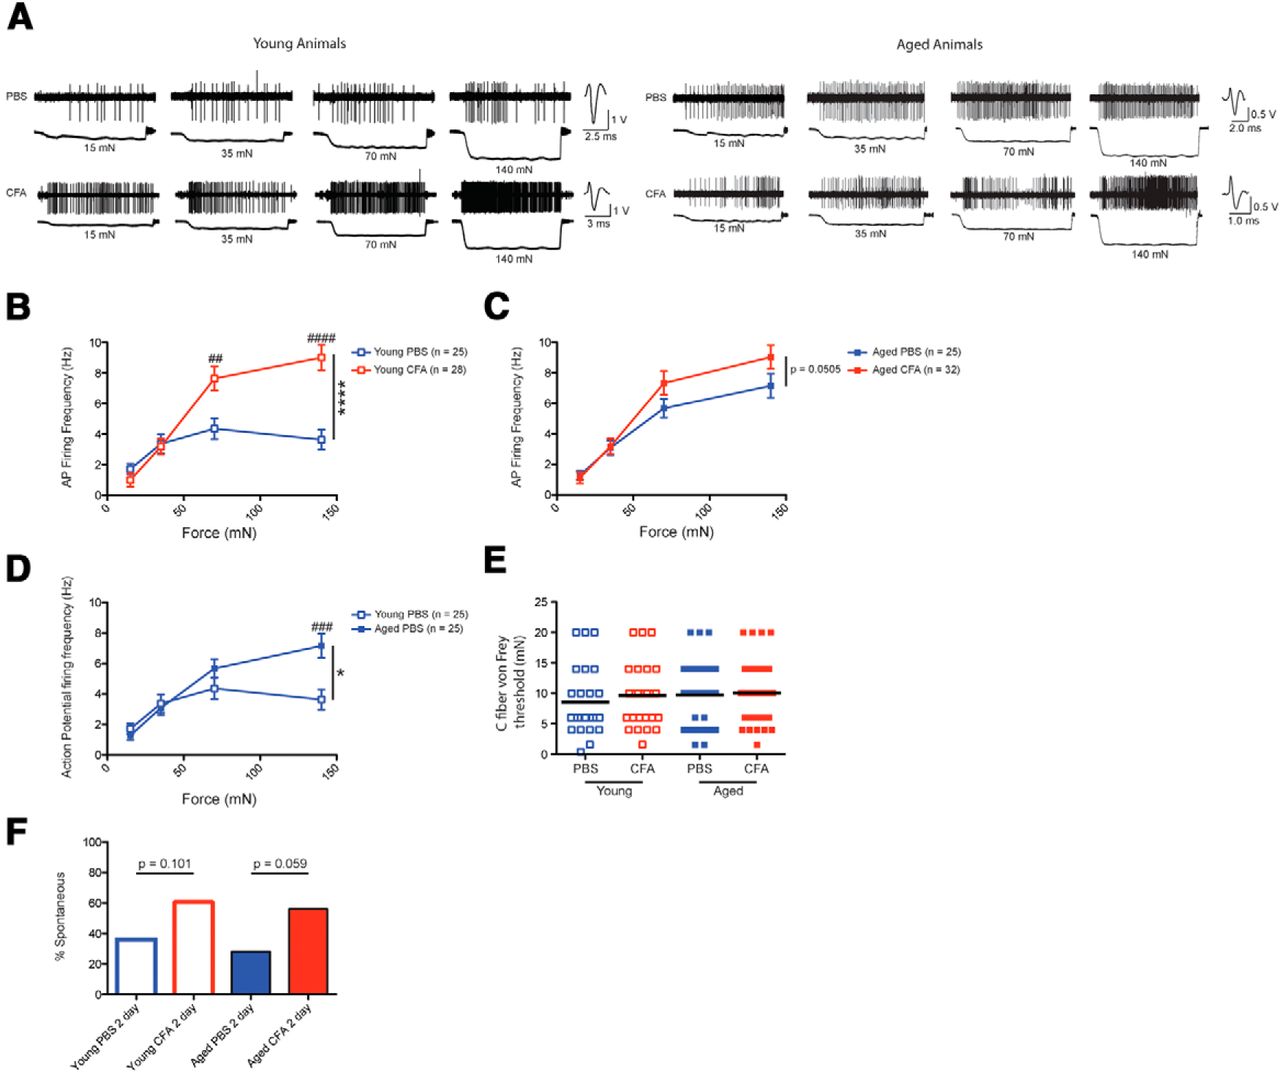
- Figure 2.
Acute inflammation sensitizes C-fiber nociceptors to mechanical force only in young animals. A, Trace examples from young animals injected with either PBS (top left) or CFA (bottom left) and aged animals injected with either PBS (top right) or CFA (bottom right). B, C-fiber nociceptors from acutely inflamed (2 day) young animals respond with significantly higher action potential firing rates in response to increasing mechanical forces. C, C-fiber nociceptors from acutely inflamed aged animals trend toward responding with increased action potential firing in response to increasing mechanical forces, but this relationship is not significant. D, At baseline, C fibers from aged animals are more sensitive to mechanical stimuli than C fibers from young animals. E, von Frey thresholds for individual C fibers were not different between the four cohorts. Each point on the graph represents the von Frey threshold of an individual C fiber, and the black bars are indicative of the group mean. F, More C fibers from acutely inflamed animals tend to have ongoing, nonevoked activity (>0.05 Hz), although this relationship is not significant.
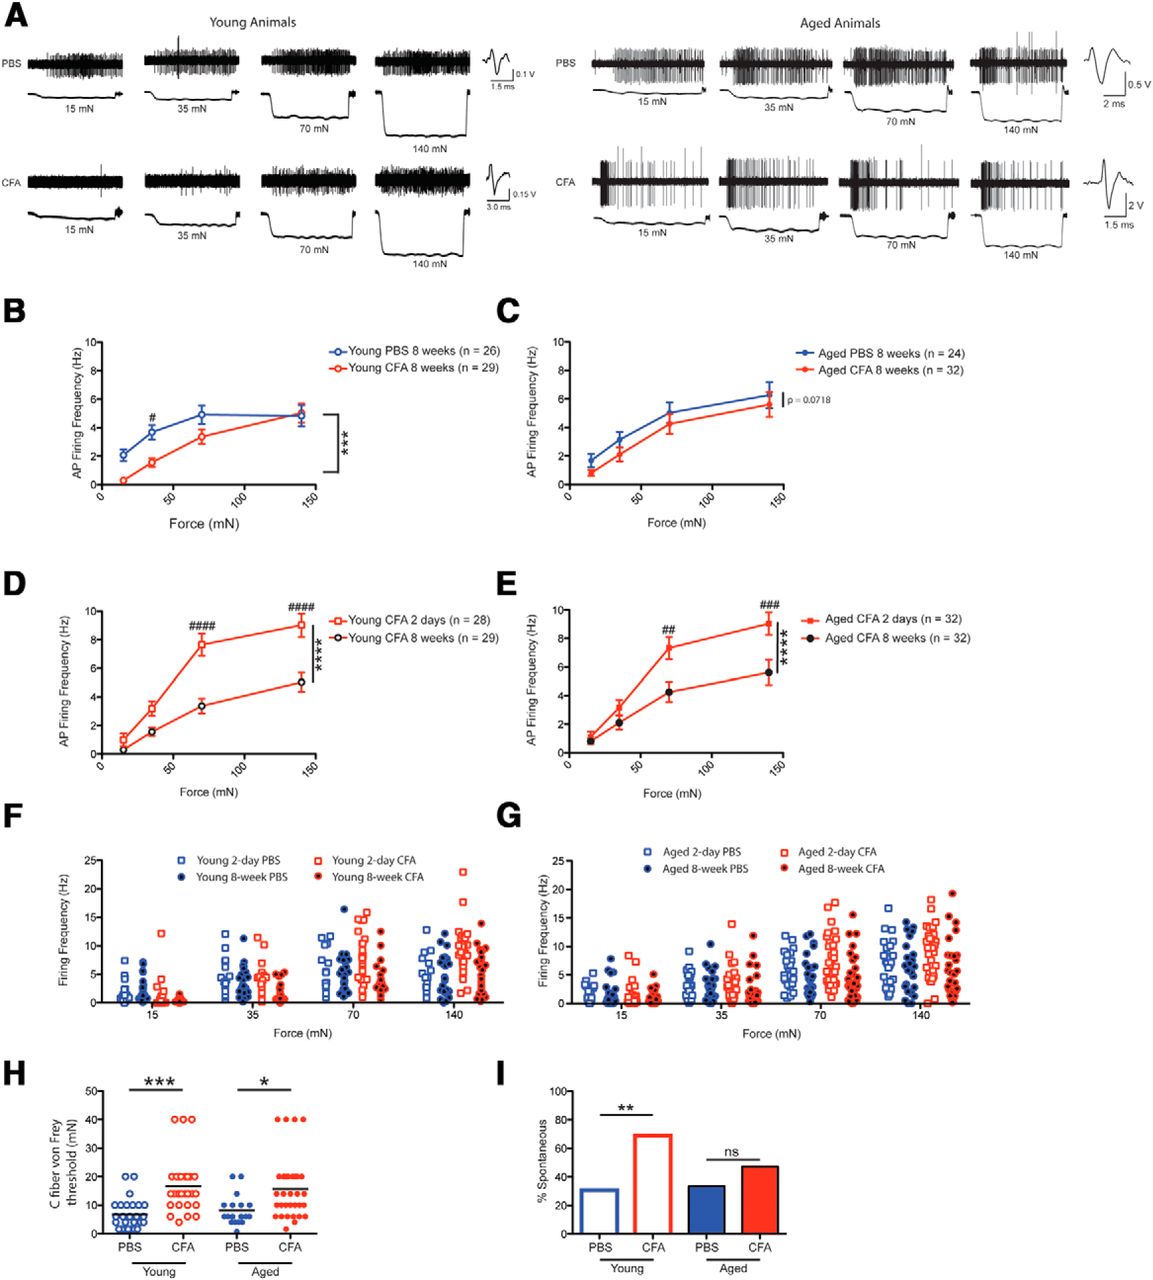
- Figure 3.
Chronic inflammation results in a desensitization of C fibers to mechanical force in young, but not aged animals. A, Trace examples from young animals injected with either PBS (top left) or CFA (bottom left) and aged animals injected with either PBS (top right) or CFA (bottom right). B, After 8 weeks of inflammation, C fibers from young animals respond with significantly lower action potential firing rates in response to increasing mechanical forces. C, After 8 weeks of inflammation, C fibers from aged animals trend toward lower firing rates in response to increasing mechanical forces. D, The firing rates of C fibers from inflamed young animals are significantly lower after 8 weeks of chronic inflammation compared with 2 days of acute inflammation. E, The firing rates of C fibers from inflamed aged animals are significantly lower after 8 weeks of chronic inflammation compared with 2 days of acute inflammation. F, G, Plots of the firing rates of individual C fibers at different forces for each cohort for young (F) and aged (G) animals. Note that after 2 days of acute inflammation the entire population of C fibers in both young and aged animals shifts toward elevated firing rates, rather than only a subpopulation of increased responders. H, von Frey thresholds for individual C fibers are elevated in both young and aged animals after 8 weeks of chronic inflammation. Each point on the graph represents the von Frey threshold of an individual C fiber, and the black bars are indicative of the group mean. I, Chronic inflammation results in an increased percentage of C fibers demonstrating ongoing, nonevoked activity in young animals, but not in aged animals.
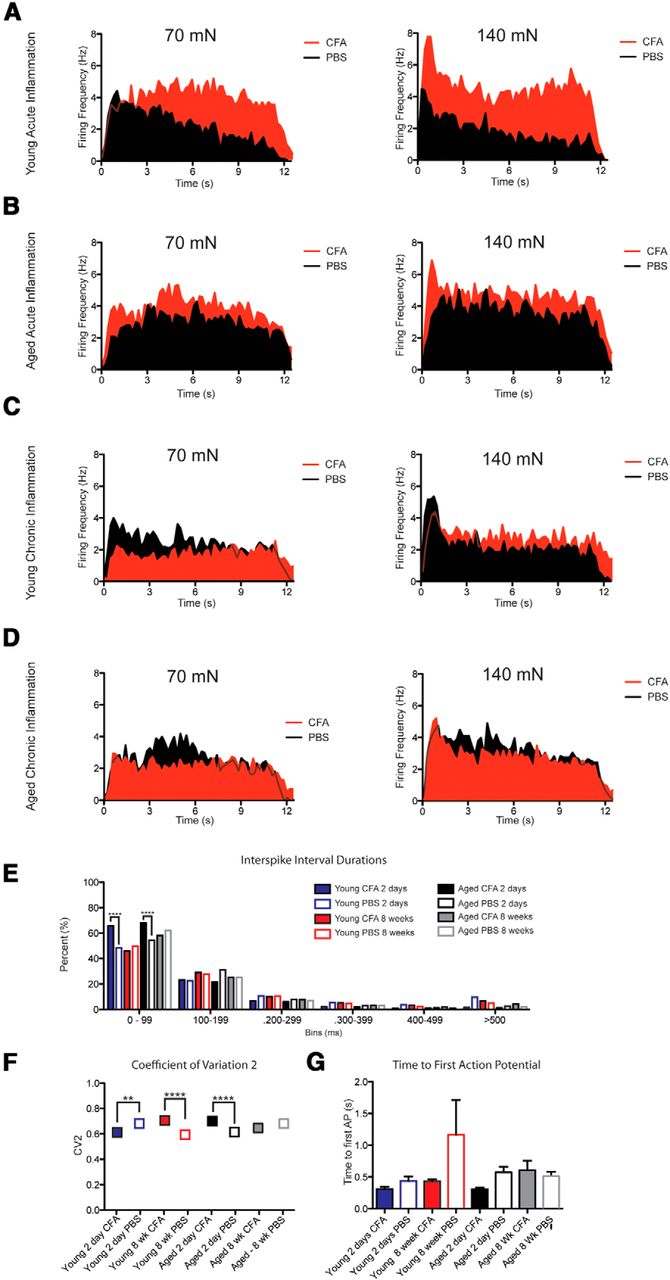
- Figure 4.
C-fiber action potential firing patterns do not explain the significant behavioral sensitization, but reduction in action potential firing rates during chronic inflammation. A–D, Grouped instantaneous firing rates over the 12 s mechanical stimulus binned into 200 ms intervals for fibers from young acutely inflamed animals (A), aged acutely inflamed animals (B), young chronically inflamed animals (C), and aged chronically inflamed animals (D). E, C fibers from acutely inflamed young and aged animals fired with a significantly higher percentage of interspike intervals between 0 and 99 ms. F, The CV2 for a 140 mN stimulus were significantly different for C fibers from acutely inflamed young and aged animals, and chronically inflamed young animals, but these relationships do not consistently demonstrate that variability may underlie the increased behavioral sensitization seen acutely and chronically. G, The time to first action potential after the onset of the mechanical stimulus is not different for any of the cohorts.
- Figure 5.
C-fiber responses to capsaicin are reduced during chronic inflammation, while behavioral sensitization to capsaicin remains intact. A, C-fiber responses to capsaicin are similar under naïve and acutely inflamed conditions in young animals, but responses are strongly attenuated during chronic inflammation. B, The number of action potentials fired by capsaicin-sensitive C fibers is also reduced after 8 weeks of chronic inflammation in young animals (although this is not statistically significant). C, In aged animals, C-fiber responses to capsaicin are similar across the naïve, acute inflamed, and chronic inflamed states. Note the low numbers that are due to the lack of aged animal availability. D, Number of action potentials fired by aged C fibers in response to capsaicin. E, Young animals exhibit sensitized pain behaviors in response to capsaicin injection during both acute inflammatory and chronic inflammatory states, despite the reduced afferent responses to capsaicin at 8 weeks.
- Figure 6.
AM fibers from young animals exhibit reduced mechanical firing rates following inflammation. A, Following both 2 day acute and 8 week chronic inflammation, AM fibers from young animals exhibit reduced firing rates in response to mechanical stimuli. B, Plots of the firing rates of individual AM fibers at different forces for each cohort of young animals. Note the loss of a population of high-responding AM fibers at the 2 day and 8 week time points. C, von Frey thresholds of individual AM fibers from young animals are elevated after 8 weeks of chronic inflammation compared with fibers from naïve animals.
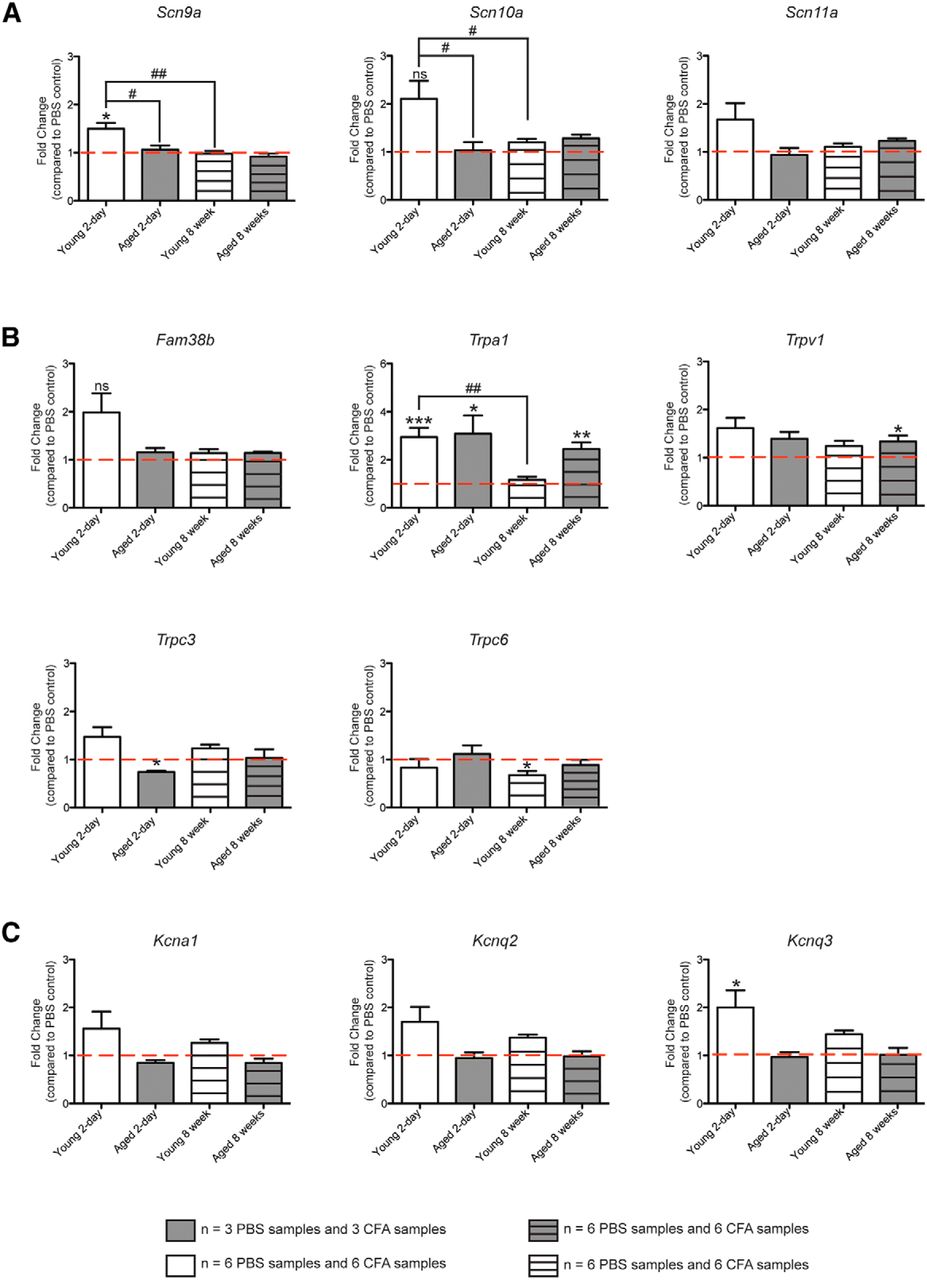
- Figure 7.
Changes in gene expression of voltage-gated and mechanosensitive ion channels do not explain the reduced action potential firing after 8 weeks of chronic inflammation. A, Gene expression for voltage-gated sodium channels NaV1.7 (Scn9a), NaV1.8 (Scn10a), and NaV1.9 (Scn11a). Bars indicate the fold change of the CFA condition over the PBS condition for each cohort. The red dotted line indicates a fold change of 1, meaning no change in expression levels between CFA and PBS conditions. *Indicates significant fold changes for the CFA vs PBS condition; #indicates significant differences in the fold change between cohorts. B, Gene expression (shown as fold change compared with PBS controls) for Piezo2 (Fam38b) and TRP channels. C, Gene expression (shown as the fold change compared with PBS controls) for voltage-gated potassium channels KV1.1 (Kcna1), KV7.2 (Kcnq2), and KV7.3 (Kcnq3).


Tables
Gene TaqMan assay ID Context sequence scn9a Mm00450762_s1 ACGAAAGCAGGAAATAGAGCTTCGG scn10a Mm00501467_m1 TCCACTCCTGGTTCTCCATATTTAT scn11a Mm00449367_m1 TCTGTAATCTCAGGTCTGAAGGTCA fam38b Mm01265861_m1 ACAAGAGCCTCTTGTGCAAGAGGAG trpa1 Mm01227437_m1 GAAGAAGGGAACACAGCACTCCACT trpv1 Mm01246302_m1 TACTTTTCTTTGTACAGTCACTGTT trpc3 Mm00444690_m1 CCTTGTAGCAGGCTGGGGAAGATTC trpc6 Mm01176083_m1 TACCCCAGCTTCCGGGGTAATGAAA kcna1 Mm00439977_s1 TGCGGCCGCACGCTCCCTGCCCCAC kcnq2 Mm00440080_m1 CCACGCCTACGTGTTCCTTTTAGTC kcnq3 Mm00548884_m1 TGTGCCCACAGCAAAGAACTCATCA tbp Mm00446971_m1 TCCCCACAGGGCGCCATGACTCCTG Data Structure Type of Test 95% Confidence Interval a Non-normally distributed Mann Whitney Test −1.982 to 0 b Normally Distributed 2-way repeated measures ANOVA BL −1.786 to 0.9921 2 Days 1.399 to 4.177 2 Weeks 1.116 to 3.894 3 Week 0.6599 to 3.438 4 Weeks 1.513 to 4.291 6 Weeks 1.053 to 3.831 8 Weeks 0.9196 to 3.698 c Normally Distributed 2-way repeated measures ANOVA BL −1.895 to 1.047 2 Days −3.114 to −0.1722 2 Weeks −3.073 to −0.1315 3 Weeks −3.467 to −0.5257 4 Weeks −3.824 to −0.8828 6 Weeks −3.708 to −0.7663 8 Weeks −3.797 to −0.8067 d Normally Distributed 2-way repeated measures ANOVA BL −2.017 to −0.6001 2 Days −0.1975 to 1.219 2 Weeks 0.2870 to 1.704 3 Weeks −0.1994 to 1.218 4 Weeks −0.1833 to 1.234 6 Weeks −0.2278 to 1.189 8 Weeks −0.5649 to 0.8520 e Normally Distributed 2-way repeated measures ANOVA BL −6.579 to 70.27 2 Days 15.50 to 92.35 2 Weeks −2.743 to 74.11 3 Weeks −0.06598 to 76.78 4 Weeks −0.1534 to 76.70 6 Weeks −18.63 to 58.22 8 Weeks −6.579 to 70.27 f Normally Distributed Student’s t-test −12.04 to 8.812 g Normally Distributed 2-way repeated measures ANOVA BL −19.12 to 9.119 2 Days 31.71 to 59.95 2 Weeks 27.96 to 56.20 3 Weeks 35.05 to 63.29 4 Weeks 31.30 to 59.54 6 Weeks 31.30 to 59.54 8 Weeks 31.30 to 59.54 h Normally Distributed 2-way repeated measures ANOVA BL −30.63 to 19.91 2 Days −20.39 to 30.15 2 Weeks −14.44 to 36.10 3 Weeks 7.705 to 58.25 4 Weeks 15.32 to 65.87 6 Weeks 11.63 to 62.18 8 Weeks 10.93 to 62.31 i Normally Distributed 2-way repeated measures ANOVA BL −17.81 to 23.52 2 Days 1.122 to 42.45 2 Weeks 8.086 to 49.41 3 Weeks −10.31 to 31.02 4 Weeks −13.34 to 27.99 6 Weeks −10.49 to 30.84 8 Weeks −22.63 to 18.70 j Normally Distributed 1-way ANOVA 0.8595 to 1.648 for Young height 0.2179 to 1.028 for Aged height 0.3473 to 1.482 for Young width 0.4451 to 1.610 for Aged height k Normally Distributed 2-way ANOVA 15.00 mN −2.979 to 1.547 35.00 mN −2.442 to 2.084 70.00 mN 1.031 to 5.556 140.0 mN 3.124 to 7.650 l Normally Distributed 2-way ANOVA 15.00 mN −2.376 to 2.028 35.00 mN −2.117 to 2.287 70.00 mN −0.5504 to 3.854 140.0 mN −0.3346 to 4.101 m Normally Distributed 2-way ANOVA 15.00 mN −1.645 to 2.507 35.00 mN −1.791 to 2.361 70.00 mN −3.398 to 0.7536 140.0 mN −5.603 to −1.451 n Non-Normally Distributed Kruskal-Wallis Test Aged CFA − 2 days vs Aged PBS − 2 days −0.3564 to 0.4208 Aged CFA − 2 days vs Young CFA − 2 days −0.3346 to 0.4188 Aged CFA − 2 days vs Young PBS − 2 days −0.2396 to 0.5376 Aged PBS − 2 days vs Young CFA − 2 days −0.3906 to 0.4105 Aged PBS − 2 days vs Young PBS − 2 days −0.2949 to 0.5285 Young CFA − 2 days vs Young PBS − 2 days −0.2937 to 0.5074 o Non-Normally Distributed Contingency Table followed by Fisher’s Exact Test 1.081 to 10.12 for Aged Odds Ratio 0.9011 to 8.377 for Young Odds Ratio (95% CI cannot be calculated for Fisher’s Exact test alone) p Normally Distributed 2-way ANOVA 15.00 mN −3.588 to 0.02884 35.00 mN −3.934 to −0.3170 70.00 mN −3.356 to 0.2608 140.0 mN −1.688 to 2.081 q Normally Distributed 2-way ANOVA 15.00 mN −3.198 to 1.455 35.00 mN −3.370 to 1.284 70.00 mN −3.109 to 1.544 140.0 mN −2.994 to 1.691 r Normally Distributed 2-way ANOVA 15.00 mN −1.302 to 2.701 35.00 mN −0.3710 to 3.632 70.00 mN 2.282 to 6.286 140.0 mN 1.971 to 6.009 s Normally Distributed 2-way ANOVA 15.00 mN −2.522 to 1.914 35.00 mN −3.274 to 1.162 70.00 mN −5.297 to −0.8607 140.0 mN −5.677 to −1.170 t Non-Normally Distributed Kruskal-Wallis Test Aging PBS vs CFA 0.1826 to 1.322 Young PBS vs CFA 0.4658 to 1.511 u Non-Normally Distributed Contingency Table followed by Fisher’s Exact Test 1.590 to 15.73 for Young Odds Ratio 0.5893 to 5.284 for Aged Odds Ratio (95% CI cannot be calculated for Fisher’s Exact test alone) v Non-Normally Distributed Contingency Table followed by Fisher’s Exact Test 1.770 to 2.348 for Young 2-day CFA vs PBS Odds Ratio 1.597 to 1.995 for Aged 2-day CFA vs PBS Odds Ratio (95% CI cannot be calculated for Fisher’s Exact test alone) w Normally Distributed One-way ANOVA CFA - 8 wk vs PBS - 8 wk 0.05562 to 0.1652 CFA 2 days vs PBS - 2 days −0.1246 to −0.01475 Aged - 8 wk PBS vs Aged 8 wk CFA −0.06385 to 0.01858 Aged 2 day CFA vs Aged 2 day PBS 0.03960 to 0.1341 x Normally Distributed One-way ANOVA Aged 8 Wk CFA vs Aged 8 Wk PBS −0.7127 to 0.9026 Aged 8 Wk CFA vs Aged 2 day CFA −0.4550 to 1.054 Aged 8 Wk CFA vs Aged 2 day PBS −0.7648 to 0.8323 Aged 8 Wk CFA vs Young 8 week CFA −0.5910 to 0.9439 Aged 8 Wk CFA vs Young 8 week PBS −1.376 to 0.2588 Aged 8 Wk CFA vs Young 2 days CFA −0.4760 to 1.073 Aged 8 Wk CFA vs Young 2 days PBS −0.6258 to 0.9712 Aged 8 Wk PBS vs Aged 2 day CFA −0.6031 to 1.012 Aged 8 Wk PBS vs Aged 2 day PBS −0.9101 to 0.7877 Aged 8 Wk PBS vs Young 8 week CFA −0.7382 to 0.9013 Aged 8 Wk PBS vs Young 8 week PBS −1.520 to 0.2131 Aged 8 Wk PBS vs Young 2 days CFA −0.6228 to 1.030 Aged 8 Wk PBS vs Young 2 days PBS −0.7712 to 0.9267 Aged 2 day CFA vs Aged 2 day PBS −1.064 to 0.5327 Aged 2 day CFA vs Young 8 week CFA −0.8905 to 0.6444 Aged 2 day CFA vs Young 8 week PBS −1.676 to −0.04072 Aged 2 day CFA vs Young 2 days CFA −0.7755 to 0.7735 Aged 2 day CFA vs Young 2 days PBS −0.9253 to 0.6717 Aged 2 day PBS vs Young 8 week CFA −0.6680 to 0.9535 Aged 2 day PBS vs Young 8 week PBS −1.451 to 0.2658 Aged 2 day PBS vs Young 2 days CFA −0.5526 to 1.082 Aged 2 day PBS vs Young 2 days PBS −0.7013 to 0.9792 Young 8 week CFA vs Young 8 week PBS −1.565 to 0.09424 Young 8 week CFA vs Young 2 days CFA −0.6650 to 0.9091 Young 8 week CFA vs Young 2 days PBS −0.8145 to 0.8069 Young 8 week PBS vs Young 2 days CFA 0.02128 to 1.693 Young 8 week PBS vs Young 2 days PBS −0.1269 to 1.590 Young 2 days CFA vs Young 2 days PBS −0.9432 to 0.6916 y Normally Distributed Chi Square followed by Fisher’s exact test 1.342 to 24.34 for naive vs 8-week CFA Odds Ratio 1.111 to 21.82 for 2-day CFA vs 8-week CFA Odds Ratio (95% CI cannot be calculated for Fisher’s Exact test alone) z Normally Distributed 1-way ANOVA Naive vs 2-day CFA −31.44 to 46.29 Naive vs 8-week CFA −21.96 to 85.90 2-day CFA vs 8-week CFA −30.92 to 80.01 aa Normally Distributed Chi Square 0.2197 to 31.37 for naïve vs 2-day Odds Ratio 0.03641 to 6.866 for 2-day vs 8-week Odds Ratio 0.1677 to 10.27 for naïve vs 8-week Odds Ratio (95% CI cannot be calculated for Fisher’s Exact test alone) bb Normally Distributed 1-way ANOVA Naive vs 2-day −99.31 to 0.3113 Naive vs 8-week −90.56 to 9.061 2-day vs 8-week −41.06 to 58.56 cc Normally Distributed 2-way ANOVA Naive vs 2-day Force 15.00 −8.125 to 1.035 35.00 −7.587 to 1.573 70.00 −7.013 to 2.147 140.0 −6.602 to 2.701 Naive vs 8 week Force −7.934 to 2.113 15.00 −8.314 to 1.732 35.00 −8.317 to 1.729 70.00 −7.230 to 2.816 140.0 −7.934 to 2.113 2-day vs 8 week Force 15.00 −4.665 to 5.935 35.00 −5.584 to 5.017 70.00 −6.161 to 4.440 140.0 −5.619 to 5.106 dd Non-Normally Distributed Kruskall Wallis Test Naïve 2-day 8-week Lower 95% CI 0.4476 0.7617 0.9286 Upper 95% CI 0.8724 1.083 1.929 ee Normally Distributed Student’s t-test for PBS vs CFA for each time point and gene −0.9854 to −0.1312 Young 2-day Nav1.7 −1.848 to 0.07474 Young 2-day Nav1.8 −1.643 to 0.4202 Young 2-day Nav1.9 −1.886 to 0.2060 Young 2-day Piezo2 −2.157 to −0.7731 Young 2-day TRPA1 −1.294 to 0.06031 Young 2-day TRPV1 −1.014 to 0.1110 Young 2-day TRPC3 0.007134 to 1.246 Young 2-day TRPC6 −1.581 to 0.6142 Young 2-day Kv1.1 −1.399 to 0.07587 Young 2-day Kv7.2 −1.710 to −0.06359 Young 2-day Kv7.3 −0.6277 to 0.7177 Young 8-week Nav1.7 −0.9606 to 0.4572 Young 8-week Nav1.8 −0.8359 to 0.6292 Young 8-week Nav1.9 −1.141 to 0.8441 Young 8-week Piezo2 −0.7882 to 0.4815 Young 8-week TRPA1 −0.9529 to 0.4529 Young 8-week TRPV1 −1.469 to 0.8719 Young 8-week TRPC3 −0.5417 to 1.498 Young 8-week TRPC6 −0.7716 to 0.1383 Young 8-week Kv1.1 −1.292 to 0.4155 Young 8-week Kv7.2 −1.370 to 0.3438 Young 8-week Kv7.3 −0.6742 to 0.5142 Aged 2-day Nav1.7 −0.9797 to 0.9464 Aged 2-day Nav1.8 −0.9318 to 1.192 Aged 2-day Nav1.9 −0.8022 to 0.4022 Aged 2-day Piezo2 −2.579 to −0.4873 Aged 2-day TRPA1 −1.068 to 0.08780 Aged 2-day TRPV1 0.02838 to 0.9250 Aged 2-day TRPC3 −0.5024 to 1.082 Aged 2-day TRPC6 −0.07159 to 0.5116 Aged 2-day Kv1.1 −0.4090 to 0.6290 Aged 2-day Kv7.2 −0.4557 to 0.5357 Aged 2-day Kv7.3 −0.3108 to 0.5842 Aged 8-week Nav1.7 −0.7250 to 0.02833 Aged 8-week Nav1.8 −0.6878 to 0.1078 Aged 8-week Nav1.9 −0.7805 to 0.3605 Aged 8-week Piezo2 −1.981 to −0.4358 Aged 8-week TRPA1 −0.7546 to −0.03539 Aged 8-week TRPV1 −0.6783 to 0.8150 Aged 8-week TRPC3 −1.052 to 0.8521 Aged 8-week TRPC6 −0.1824 to 0.8290 Aged 8 week Kv1.1 −0.5183 to 0.6183 Aged 8 week Kv7.2 −0.4955 to 0.6255 Aged 8 week Kv7.3 ff Normally Distributed One-way ANOVA Nav1.7 Aged 2-day vs Aged 8 weeks −0.2611 to 0.5441 Aged 2-day vs Young 2-day −0.8386 to −0.03346 Aged 8 weeks vs Young 8 week −0.3855 to 0.2719 Young 2-day vs Young 8 week 0.1920 to 0.8494 Nav1.8 Aged 2-day vs Aged 8 weeks −1.284 to 0.7893 Aged 2-day vs Young 2-day −2.104 to −0.03105 Aged 8 weeks vs Young 8 week −0.7631 to 0.9298 Young 2-day vs Young 8 week 0.05728 to 1.750 Nav1.9 Aged 2-day vs Aged 8 weeks −1.233 to 0.6500 Aged 2-day vs Young 2-day −1.694 to 0.1896 Aged 8 weeks vs Young 8 week −0.6290 to 0.9088 Young 2-day vs Young 8 week −0.1685 to 1.369 Piezo2 Aged 2-day vs Aged 8 weeks −1.071 to 1.067 Aged 2-day vs Young 2-day −1.880 to 0.2578 Aged 8 weeks vs Young 8 week −0.8390 to 0.9063 Young 2-day vs Young 8 week −0.03008 to 1.715 TRPA1 Aged 2-day vs Aged 8 weeks −0.8925 to 2.265 Aged 2-day vs Young 2-day −1.406 to 1.752 Aged 8 weeks vs Young 8 week −0.04212 to 2.536 Young 2-day vs Young 8 week −0.4714 to 3.050 TRPV1 Aged 2-day vs Aged 8 weeks −0.6561 to 0.7992 Aged 2-day vs Young 2-day −0.9202 to 0.5352 Aged 8 weeks vs Young 8 week −0.4682 to 0.7201 Young 2-day vs Young 8 week −0.2041 to 0.9841 TRPC3 Aged 2-day vs Aged 8 weeks −1.036 to 0.4285 Aged 2-day vs Young 2-day −1.465 to −0.0002279 Aged 8 weeks vs Young 8 week −0.8156 to 0.3804 Young 2-day vs Young 8 week −0.3868 to 0.8092 TRPC6 Aged 2-day vs Aged 8 weeks −0.3808 to 0.8767 Aged 2-day vs Young 2-day −0.3464 to 0.9110 Aged 8 weeks vs Young 8 week −0.3308 to 0.6959 Young 2-day vs Young 8 week −0.3651 to 0.6616 Kv1.1 Aged 2-day vs Aged 8 weeks −0.9476 to 1.019 Aged 2-day vs Young 2-day −1.693 to 0.2736 Aged 8 weeks vs Young 8 week −1.234 to 0.3716 Young 2-day vs Young 8 week −0.4887 to 1.117 Kv7.2 Aged 2-day vs Aged 8 weeks −0.9518 to 0.8372 Aged 2-day vs Young 2-day −1.666 to 0.1225 Aged 8 weeks vs Young 8 week −1.099 to 0.3614 Young 2-day vs Young 8 week −0.3847 to 1.076 Kv7.3 Aged 2-day vs Aged 8 weeks −1.049 to 1.010 Aged 2-day vs Young 2-day −2.029 to 0.02973 Aged 8 weeks vs Young 8 week −1.274 to 0.4071 Young 2-day vs Young 8 week −0.2940 to 1.387
In this issue


