

Article Figures & Data
Figures
- Figure 1.
Meta-analysis results. Widespread reading disability group differences in gray matter volume reported across 11 voxel-based studies of reading disability are displayed on the MNI T1 image (top). SDM meta-analysis results demonstrated relatively consistent effects within left superior temporal sulcus, left orbitofrontal cortex, and right cerebellar hemisphere (bottom; red, p < 0.005, yellow p < 0.001, uncorrected). Jednoróg et al. (2015) was not included in the meta-analysis and did not observe cortical effects for p < 0.001 peak and p < 0.05 cluster extent thresholds. The yellow clusters were normalized into the study-specific DARTEL space of the multisite data to extract average gray matter volume estimates for the dimensional and group difference analyses.
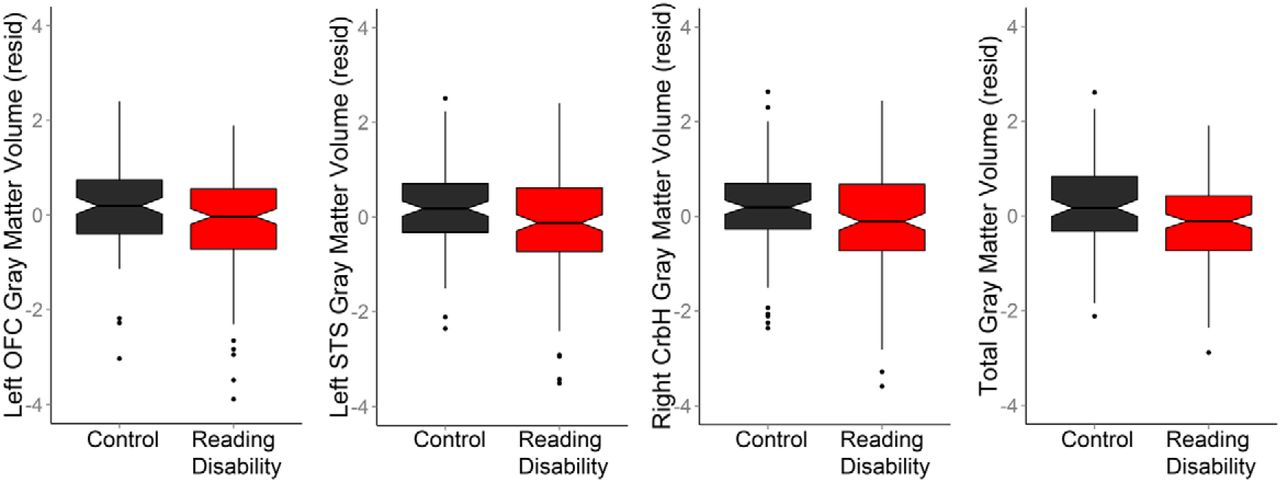
- Figure 2.
Reading disability group differences in gray matter within meta-analysis ROI (n = 255). Significantly lower gray matter volume [adjusted for age, age2, gender, and site (resid)] was observed in reading disability cases compared to controls within left OFC (including pars orbitalis), and left STS. There were not significant reading disability group differences in right cerebellar hemisphere (CrbH) ROI gray matter volume, perhaps because of the increased gray matter volume variance in the reading disability group. The ROI group differences in gray matter volume were statistically dependent on total gray matter volume.
- Figure 3.
Gray matter variance in control and reading disability groups. A, Representative sections shows standard deviations across voxels for the smoothed gray matter images (residualized smoothed GM: after removing variance for gender, age, and research site; corrected for total GM: after removing variance for gender, age, research site and total gray matter volume). B, A voxelwise Levene test (uncorrected for multiple comparisions) demonstrated brain regions where there were reading disability group differences in gray matter variance [red: reading disability (RD) > control (CTL); blue: CTL>RD].
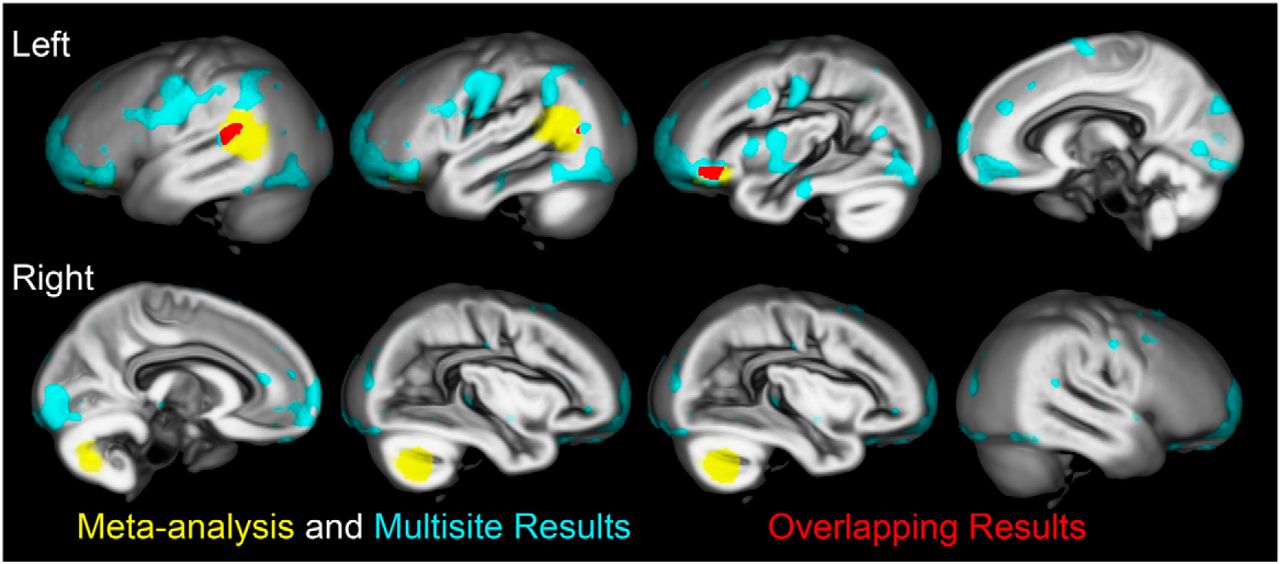
- Figure 4.
Multisite and meta-analysis results. The multisite voxel-based reading group comparison results (cyan) are presented with the meta-analysis results (yellow) from voxel-based dyslexia studies on the study specific DARTEL gray matter template (all clusters p < 0.001, uncorrected). The multisite group comparison included covariates for age, age2, gender, and research site. The left hemisphere overlap of results (red) from each analysis falls within the left posterior superior temporal sulcus and left orbitofrontal cortex. All cyan clusters were no longer present using the p < 0.001 uncorrected threshold when total gray matter volume was included as a covariate.


Tables
First author Control sample size Dyslexic sample size Coordinate space Mean age dyslexia cases Gender ratio M/F Statistical significance Brambati et al., 2004 11 10 Talairach 31.6 47 0.006 Brown et al., 2001 14 16 Talairach 24.5 30 0.05 Eckert et al., 2005 13 13 MNI 11.4 100 0.001 Jednoróg et al., 2013 35 46 MNI 10.3 48 0.00004 Kronbichler et al., 2008 15 13 MNI 15.9 100 0.004 Menghini et al., 2008 10 10 MNI 40.7 10 ^0.005 Raschle et al., 2011 10 10 MNI 5.9 50 0.0002 Silani et al., 2005 32 32 Talairach ∼24.4 100 0.009 Steinbrink et al., 2008 8 8 MNI 20.1 75 ^0.05 FDR Tamboer et al., 2015 37 57 MNI 20.6 7 ^0.05 Vinckenbosch et al., 2005 14 10 Talairach 17–30 100 0.0006 Thresholds are reported as uncorrected thresholds based on the reported t or Z-scores, except for ^ three studies for which only the statistical threshold was reported. Ages were rounded or ∼ estimated from the mean age of multiple groups or reported as a range if mean ages were not provided.
- Table 2.
Control and reading disability behavioral summaries (mean and SD) before (n=293) and after (n=255) discriminant function selection of cases
Site Control Reading disability (n=Control/RD)
(n=129/164)VC WID WA PC Age VC WID WA PC Age 1 (n=36/45) 107.81 (14.19) 105.56 (11.89) 105.61 (10.26) 101.74 (10.26) 10.11 (1.38) 91.40 (14.33) 82.31 (10.22) 87.18 (8.41) 84.73 (12.35) 9.91 (1.65) 2 (n=34/28)† 105.86 (4.03) 110.85 (10.18) 110.24 (11.37) 112.94 (8.65) 12.51 (3.06) 106.01 (4.04) 81.93 (7.58) 87.79 (7.58) 87.11 (11.24) 14.27 (1.68) 3 (n=15/15)^ 117.40 (14.97) 117.07 (17.44) 115.60 (15.98) 109.93 (9.39) 9.33 (2.02) 96.75 (8.55) 84.13 (7.51) 86.60 (7.69) 82.53 (9.57) 9.27 (2.02) 4 (n=10/16) 121.09 (16.41) 106.80 (17.71) 118.10 (15.24) 111.10 (14.36) 11.93 (1.89) 102.20 (13.73) 82.44 (8.86) 88.13 (8.07) 84.66 (9.47) 9.99 (1.87) 5 (n=19/39) 115.84 (14.07) 115.47 (14.16) 112.42 (12.38) 107.63 (13.59) 9.37 (2.66) 107.73 (11.07) 77.44 (9.56) 89.03 (10.11) 76.87 (15.89) 10.10 (1.67) 6 (n=15/21)‡ 117.66 (12.75) 114.80 (7.51) 112.93 (9.10) 94.06 (4.09) 10.71 (3.42) 106.85 (13.43) 95.19 (11.51) 98.90 (9.57) 93.94 (3.82) 10.82 (3.49) All cases 111.77 (13.39) 110.92 (13.18) 110.82 (12.34) 106.35 (11.76) 10.75 (2.73) 101.30 (13.39) 82.91 (10.69) 89.26 (9.44) 84.24 (12.88) 10.77 (2.59) Discriminant function analysis selected groups
(n=Control/RD)
(n=105/150)1 (n=23/43) 113.30 (11.24) 112.83 (7.89) 111.04 (8.06) 106.38 (9.28) 10.15 (1.38) 89.56 (11.71) 81.58 (9.85) 86.63 (8.19) 83.16 (10.14) 9.90 (1.65) 2 (n=32/26)† 105.94 (3.98) 111.94 (9.46) 111.16 (11.06) 113.09 (9.00) 12.52 (3.12) 105.88 (4.03) 80.96 (6.90) 86.96 (7.11) 86.50 (11.40) 14.19 (1.71) 3 (n=14/15)^ 118.43 (14.97) 118.93 (16.48) 117.64 (14.40) 111.36 (7.89) 9.38 (2.09) 96.75 (8.55) 84.13 (7.51) 86.60 (7.69) 82.53 (9.57) 9.27 (2.02) 4 (n=7/16) 123.27 (19.04) 115.57 (10.95) 121.57 (15.14) 117.86 (8.92) 11.54 (2.04) 102.20 (13.73) 82.44 (8.86) 88.13 (8.07) 84.66 (9.47) 9.99 (1.87) 5 (n=15/39) 117.13 (14.10) 120.20 (11.94) 116.27 (10.93) 111.63 (12.25) 9.46 (3.00) 107.73 (11.07) 77.44 (9.56) 89.03 (10.11) 76.87 (15.89) 10.10 (1.67) 6 (n=14/11)‡ 118.51 (12.75) 115.86 (6.54) 113.93 (8.55) 94.10 (4.06) 10.64 (3.54) 107.81 (16.61) 85.91 (6.36) 92.55 (7.50) 94.18 (3.66) 9.98 (3.68) Selected cases 113.65 (12.66) 115.01 (10.74) 113.79 (11.19) 108.97 (10.97) 10.83 (2.90) 100.52 (13.27) 81.06 (9.00) 87.90 (8.49) 83.01 (12.46) 10.65 (2.51) RD, reading disability; VC, verbal comprehension; WID, word identification; WA, word attack; PC, passage comprehension.
†This site had complete verbal comprehension missingness. Younger controls were recruited to have reading level matches for the reading impaired cases and this produced a group difference in age (p < 0.05) that remained significant after discriminant function assignment of cases to reading groups.
^Gender was missing for 1 case.
‡ This site had complete passage comprehension missingness. Significant group differences were observed for all variables between reading disability and control groups (p < 0.001), with the exception of age (n.s.). There were no significant differences in the distribution of gender within sites or across the multisite sample before or after discriminant function analysis selection of cases. The standardized scores are age-normed values.
Site Manufacturer Field strength, T Image dimensions, mm Slice thickness, mm TR, ms TE, ms Flip angle , deg 1 Siemens 1.5 256 × 256×200 0.80† 25.00 4.60 30‡ 2 GE 3.0 256 × 256×124 1.20 9.00 2.00 15 3 Siemens 3.0 240 × 256×176 0.90 2250* 3.96 9 4 Siemens 3.0 128 × 256×256 1.33 6.00 2.90 8 5 Siemens 3.0 256 × 256×160 1.00 1600^ 3.37 15 6 Philips 3.0 256 × 256×100 1.00 9.88 4.59 8 †0.8 mm gap.
‡Five of 66 cases had TR= 30 and flip angle=35. Note that the long TRs for Sites 3 and 5 were due to the use of inversion recovery.
*Inversion time = 900.
^Inversion time = 640.
- Table 4.
Pearson correlations between gray matter regions from the meta-analysis and behavioral measures across all 293 cases
Word attack Word identification Passage comprehension Verbal comprehension Left Orbitofrontal Cortex (resid) 0.17** 0.17** 0.20*** 0.11 Confidence Intervals 0.05–0.29 0.05–0.28 0.07–0.32 0.01–0.21 Left Superior Temporal Sulcus (resid) 0.16* 0.17** 0.19** 0.10 Confidence Intervals 0.03–0.27 0.06–0.28 0.08–0.30 0.00–0.21 Right Cerebellar Hemisphere (resid) 0.15* 0.11 0.17** 0.16** Confidence Intervals 0.02–0.27 −0.01 to 0.24 0.04–0.29 0.05–0.27 Total Gray Matter (resid) 0.20*** 0.19*** 0.23*** 0.21*** Confidence Intervals 0.07–0.32 0.06–0.31 0.11–0.34 0.10–0.32 Shaded cells indicate correlations that survive Bonferroni correction for the number of ROI and behavior correlations (0.05/12, p < 0.004); (resid) gray matter volume residualized for site, gender, age, and age2.
*p < 0.05, **p < 0.01, ***p < 0.001.
- Table 5.
Cohen’s d effect sizes for the reading disability group comparisons with and without cases exhibiting evidence of OWL LD based on combined verbal comprehension and total gray matter volume values that were below the combined percentile cutoffs
Left OFC Left STS Right CrbH No cases removed (N=255) 0.34 0.37 0.24 Cases <15th/25th percentile removed (N=245) 0.31 0.33 0.18 Cases <25th percentile removed (N=243) 0.28 0.29 0.16 Cases <30th percentile removed (N=240) 0.28 0.26 0.15 Cases <37th percentile removed (N=234) 0.28 0.27 0.12 The 15th/25th percentile thresholds for classification of OWL LD were used for verbal comprehension and total gray matter volume, respectively. These thresholds were chosen based on the size of group differences reported in the literature for those variables. Otherwise, the same percentile threshold was used for both variables. The Cohen’s d values were calculated based on the mean and SD of the ROI gray matter volumes for each reading disability group.
In this issue


