
Main menu

  • HOME
  • CONTENT
    • Early Release
    • Featured
    • Current Issue
    • Issue Archive
    • Blog
    • Collections
    • Podcast
  • TOPICS
    • Cognition and Behavior
    • Development
    • Disorders of the Nervous System
    • History, Teaching and Public Awareness
    • Integrative Systems
    • Neuronal Excitability
    • Novel Tools and Methods
    • Sensory and Motor Systems
  • ALERTS
  • FOR AUTHORS
  • ABOUT
    • Overview
    • Editorial Board
    • For the Media
    • Privacy Policy
    • Contact Us
    • Feedback
  • SUBMIT

User menu

Search

  • Advanced search
eNeuro

eNeuro

Advanced Search


  • HOME
  • CONTENT
    • Early Release
    • Featured
    • Current Issue
    • Issue Archive
    • Blog
    • Collections
    • Podcast
  • TOPICS
    • Cognition and Behavior
    • Development
    • Disorders of the Nervous System
    • History, Teaching and Public Awareness
    • Integrative Systems
    • Neuronal Excitability
    • Novel Tools and Methods
    • Sensory and Motor Systems
  • ALERTS
  • FOR AUTHORS
  • ABOUT
    • Overview
    • Editorial Board
    • For the Media
    • Privacy Policy
    • Contact Us
    • Feedback
  • SUBMIT
PreviousNext
Research ArticleMethods/New Tools, Novel Tools and Methods

Realistic Numerical and Analytical Modeling of Light Scattering in Brain Tissue for Optogenetic Applications

Guy Yona, Nizan Meitav, Itamar Kahn and Shy Shoham
eNeuro 4 January 2016, 3 (1) ENEURO.0059-15.2015; DOI: https://doi.org/10.1523/ENEURO.0059-15.2015
Guy Yona
1Autonomous Systems Program (TASP)
  • Find this author on Google Scholar
  • Find this author on PubMed
  • Search for this author on this site
Nizan Meitav
2Faculty of Biomedical Engineering
  • Find this author on Google Scholar
  • Find this author on PubMed
  • Search for this author on this site
Itamar Kahn
3Rappaport Faculty of Medicine and Institute, Technion - Israel Institute of Technology, Haifa, 31096, Israel
  • Find this author on Google Scholar
  • Find this author on PubMed
  • Search for this author on this site
  • ORCID record for Itamar Kahn
Shy Shoham
2Faculty of Biomedical Engineering
  • Find this author on Google Scholar
  • Find this author on PubMed
  • Search for this author on this site
  • Article
  • Figures & Data
  • Info & Metrics
  • eLetters
  • PDF
Loading

Article Figures & Data

Figures

  • Tables
  • Figure 1.
    • Download figure
    • Open in new tab
    • Download powerpoint
    Figure 1.

    Graphical depiction of the BSF calculation process: the distribution of the scattered photons ksc(z,ρ,τ) is a product of the spatial distribution h(z,ρ,τ) and the temporal dispersion distribution G(z,τ) (Eq. 1). The time-dependent distribution is integrated over time to obtain the intensity values ksc(z,ρ), and added to the distribution of the unscattered photons kusc(z,ρ) for the total distribution k(z,ρ) (Eq. 4), called the BSF. Note that the equations also include absorption effects that were omitted from the figure for simplicity.

  • Figure 2.
    • Download figure
    • Open in new tab
    • Download powerpoint
    Figure 2.

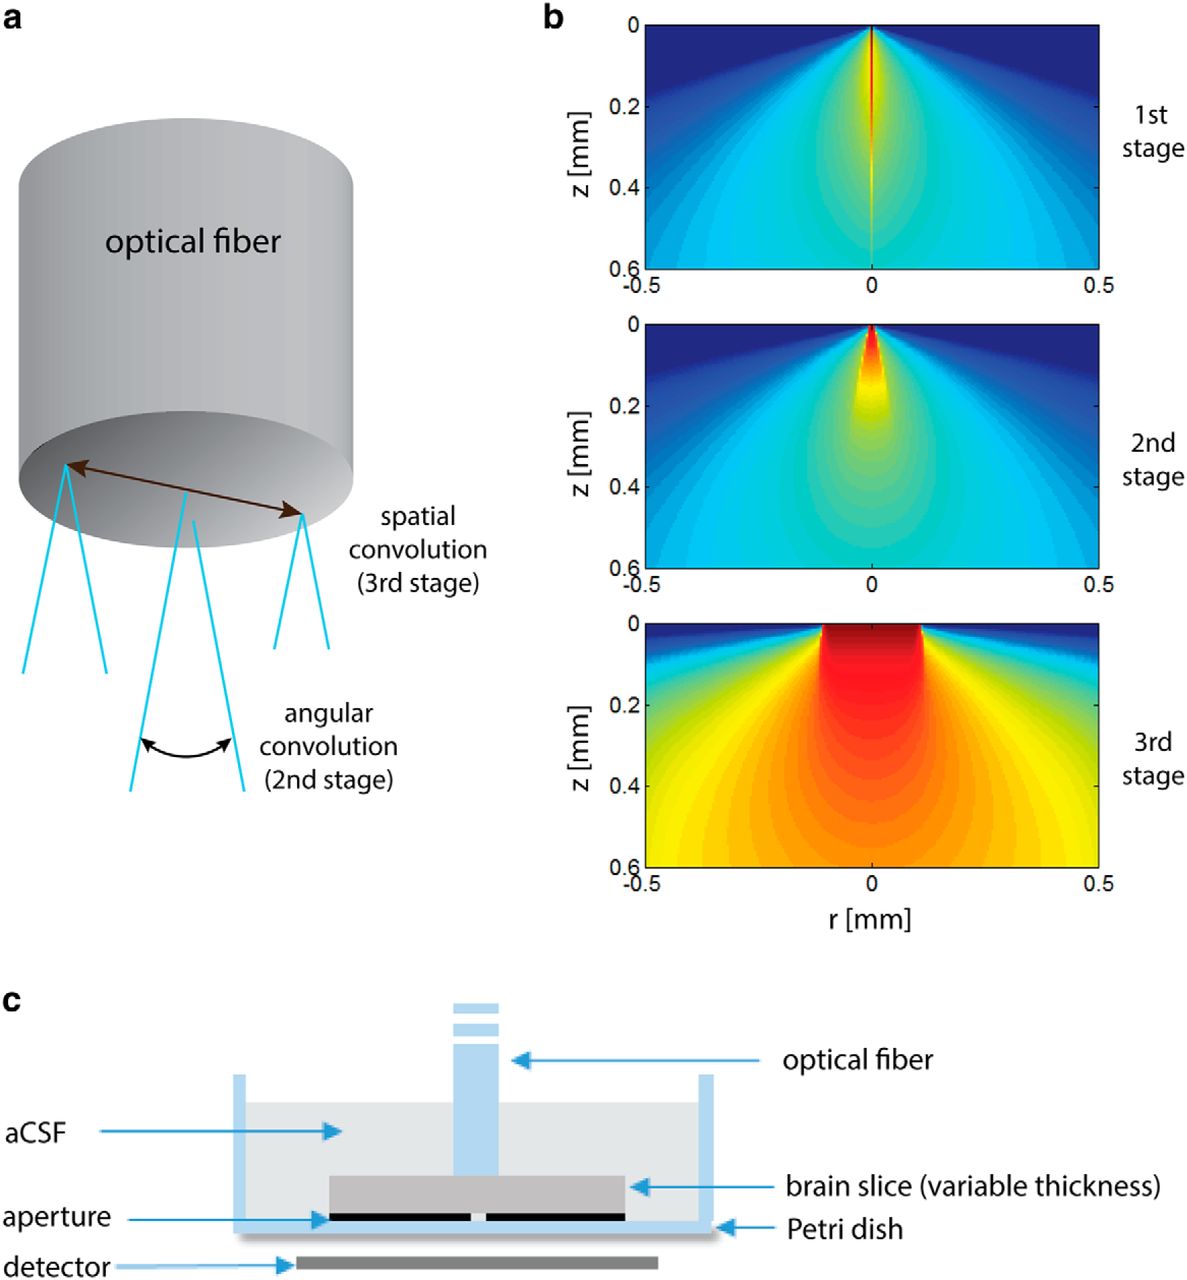
    a, Simulation procedure: the 1st stage is the calculation of a 3D pencil-beam response, the 2nd stage is the angular convolution of the pencil beam response, and the 3rd stage is a spatial convolution with the fiber tip area. b, Simulation outcomes of the various simulation steps. For better visualization, all of the figures are in log scale. c, Illustration of the experimental setup cross-section.

  • Figure. 3.
    • Download figure
    • Open in new tab
    • Download powerpoint
    Figure. 3.

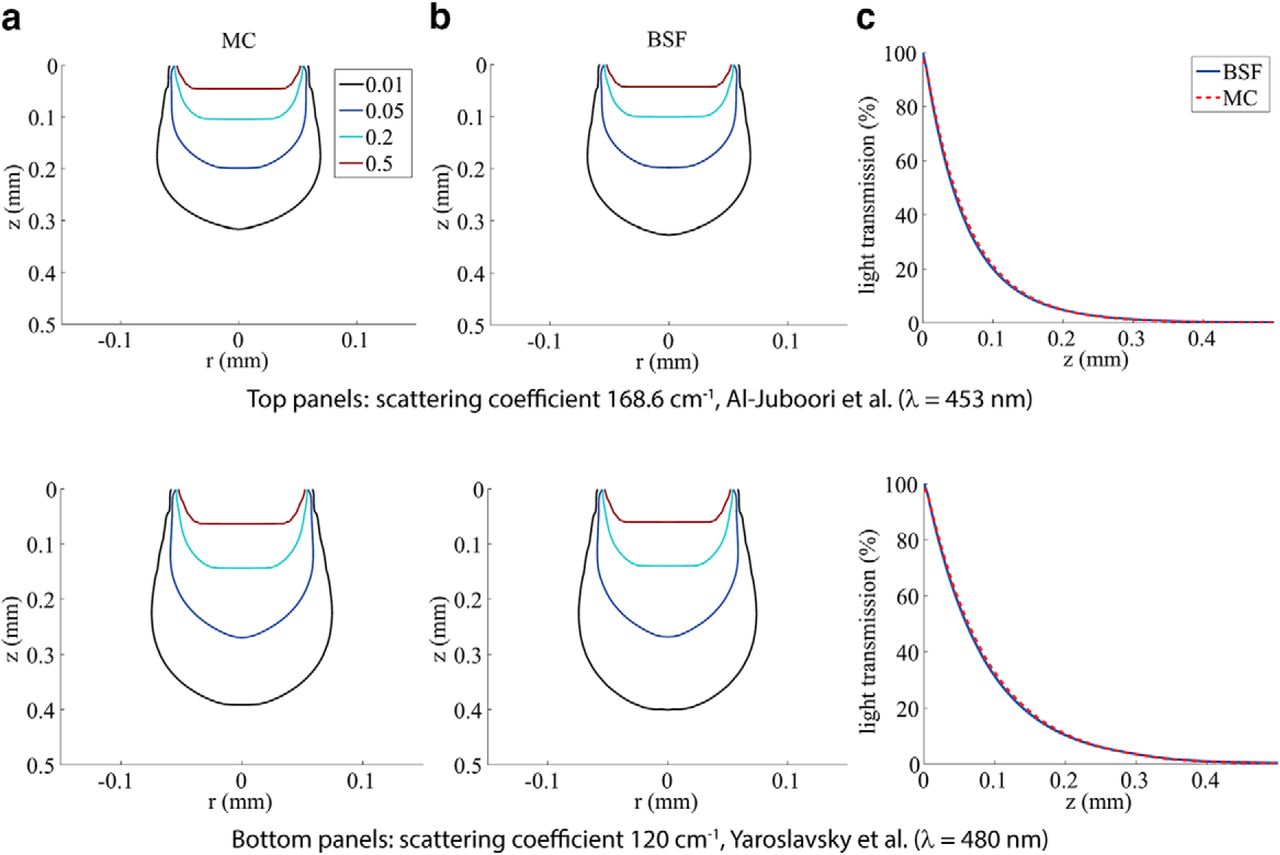
    Comparisons of MC and BSF methods for two different tissue-scattering parameter settings: µs =168.6 cm−1 (top; from Al-Juboori et al. 2013) and µs =120 cm−1 (bottom; from Yaroslavsky et al. 2002). a, Contour maps of the light distribution in the tissue, created using the MC method. b, Contours created using the BSF method. The iso-intensity lines are at 50, 20, 5, and 1% of maximum. c, Light transmission curves along the z-axis.

  • Figure. 4.
    • Download figure
    • Open in new tab
    • Download powerpoint
    Figure. 4.

    Transmission of light along the z-axis, comparing published experimental results (red dotted curves) with BSF method (blue curves). a, Best-fit curves to measured data from Aravanis et al. (2007). b, Experimental data from Al-Juboori et al. (2013) measured from the peduncopontine tegmental nucleus; the optical parameters used for the BSF curve are explained in the text.

  • Figure. 5.
    • Download figure
    • Open in new tab
    • Download powerpoint
    Figure. 5.

    Experimental results: light transmission in a mouse cortex along the z-axis (a) and the radial axis (b) at 300 μm (blue) and 600 μm (red). The solid lines are the best fit of the BSF model. c, Surface plot of the simulated light distribution in the slice, obtained with BSF model using the experimentally estimated parameters (µs = 211 cm−1, g = 0.86), with overlaid experimental measurements (colors matched to a and b). Light transmission is in log scale. d, Contour map of the simulated light distribution.

Tables

  • Figures
    • View popup
    Table 1.

    Brain tissue optical parameters

    SourceBrain sampleWavelength, nmScattering coefficient, cm−1Anisotropy factor
    Our experimentAdult mouse cortex, (5 months old)4732110.86
    Aravanis et al. (2007)Mouse cortex47360.70.885
    Al-Juboori et al. (2013)Mouse subcortical, (6–8 weeks old)453168.6—
    Azimipour et al. (2014)Rat cortex532∼170∼0.9
    Yaroslavsky et al. (2002)Human gray matter4801200.88
    • View popup
    Table 2.

    The illuminated tissue volumes for various commercial optical fibers

    Fiber propertiesVolume illuminated (10−3 Embedded Image mm3), %
    NADiameter, µm>50>20>5>1
    0.1250.020.040.090.20
    0.22500.060.140.340.79
    0.221050.290.681.483.28
    0.222001.072.565.5313.7
    0.223653.628.7119.561.7
    0.372001.052.525.5214.3
    0.392001.052.515.5014.4
    0.393002.395.7512.738.1
    0.394004.3010.423.379.4
    0.484004.7610.323.179.0
    • Threshold is in percentage of maximal illumination.

Back to top

In this issue

eneuro: 3 (1)
eNeuro
Vol. 3, Issue 1
January/February 2016
  • Table of Contents
  • Index by author
Email

Thank you for sharing this eNeuro article.

NOTE: We request your email address only to inform the recipient that it was you who recommended this article, and that it is not junk mail. We do not retain these email addresses.

Enter multiple addresses on separate lines or separate them with commas.
Realistic Numerical and Analytical Modeling of Light Scattering in Brain Tissue for Optogenetic Applications
(Your Name) has forwarded a page to you from eNeuro
(Your Name) thought you would be interested in this article in eNeuro.
CAPTCHA
This question is for testing whether or not you are a human visitor and to prevent automated spam submissions.
Print
View Full Page PDF
Citation Tools
Realistic Numerical and Analytical Modeling of Light Scattering in Brain Tissue for Optogenetic Applications
Guy Yona, Nizan Meitav, Itamar Kahn, Shy Shoham
eNeuro 4 January 2016, 3 (1) ENEURO.0059-15.2015; DOI: 10.1523/ENEURO.0059-15.2015

Citation Manager Formats

  • BibTeX
  • Bookends
  • EasyBib
  • EndNote (tagged)
  • EndNote 8 (xml)
  • Medlars
  • Mendeley
  • Papers
  • RefWorks Tagged
  • Ref Manager
  • RIS
  • Zotero
Respond to this article
Share
Realistic Numerical and Analytical Modeling of Light Scattering in Brain Tissue for Optogenetic Applications
Guy Yona, Nizan Meitav, Itamar Kahn, Shy Shoham
eNeuro 4 January 2016, 3 (1) ENEURO.0059-15.2015; DOI: 10.1523/ENEURO.0059-15.2015
Reddit logo Twitter logo Facebook logo Mendeley logo
  • Tweet Widget
  • Facebook Like
  • Google Plus One

Jump to section

  • Article
    • Abstract
    • Significance Statement
    • Introduction
    • Methods
    • Results
    • Discussion
    • Footnotes
    • References
    • Synthesis
  • Figures & Data
  • Info & Metrics
  • eLetters
  • PDF

Keywords

  • beam-spread function
  • light scattering
  • Monte Carlo
  • optogenetics

Responses to this article

Respond to this article

Jump to comment:

No eLetters have been published for this article.

Related Articles

Cited By...

More in this TOC Section

Methods/New Tools

  • Bicistronic expression of a high-performance calcium indicator and opsin for all-optical stimulation and imaging at cellular resolution
  • A Toolbox of Criteria for Distinguishing Cajal–Retzius Cells from Other Neuronal Types in the Postnatal Mouse Hippocampus
  • Superficial Bound of the Depth Limit of Two-Photon Imaging in Mouse Brain
Show more Methods/New Tools

Novel Tools and Methods

  • Bicistronic expression of a high-performance calcium indicator and opsin for all-optical stimulation and imaging at cellular resolution
  • A Toolbox of Criteria for Distinguishing Cajal–Retzius Cells from Other Neuronal Types in the Postnatal Mouse Hippocampus
  • Superficial Bound of the Depth Limit of Two-Photon Imaging in Mouse Brain
Show more Novel Tools and Methods

Subjects

  • Novel Tools and Methods

  • Home
  • Alerts
  • Visit Society for Neuroscience on Facebook
  • Follow Society for Neuroscience on Twitter
  • Follow Society for Neuroscience on LinkedIn
  • Visit Society for Neuroscience on Youtube
  • Follow our RSS feeds

Content

  • Early Release
  • Current Issue
  • Latest Articles
  • Issue Archive
  • Blog
  • Browse by Topic

Information

  • For Authors
  • For the Media

About

  • About the Journal
  • Editorial Board
  • Privacy Policy
  • Contact
  • Feedback
(eNeuro logo)
(SfN logo)

Copyright © 2023 by the Society for Neuroscience.
eNeuro eISSN: 2373-2822

The ideas and opinions expressed in eNeuro do not necessarily reflect those of SfN or the eNeuro Editorial Board. Publication of an advertisement or other product mention in eNeuro should not be construed as an endorsement of the manufacturer’s claims. SfN does not assume any responsibility for any injury and/or damage to persons or property arising from or related to any use of any material contained in eNeuro.