

Article Figures & Data
Figures
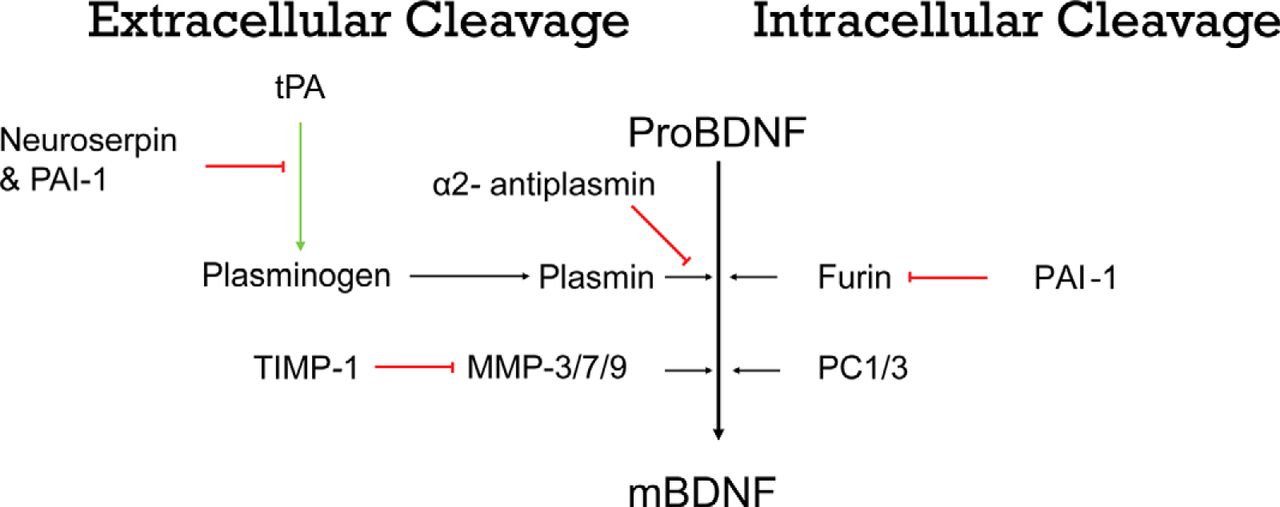
- Figure 1.
Schematic representation of different proteins involved in the cleavage of BDNF through extracellular (left panels) and intracellular (right panels) mechanisms. ProBDNF can be cleaved intracellularly within the endoplasmic reticulum by furin and in regulated secretory vesicles by proconvertase enzymes (PC1/3). ProBDNF can also be cleaved extracellularly by MMPs (−3/−7/−9) or by components of the tPA/plasmin proteolytic cascade. The activity of these proteases is tightly regulated by a number of inhibitors, including PAI-1, which inhibits both extracellular and intracellular cleavage; TIMPs, which inhibit MMPs; and neuroserpin and A2AP, which inhibit the tPA/plasmin proteolytic cascade. Red bars indicate inhibition, and green bars indicate activation.
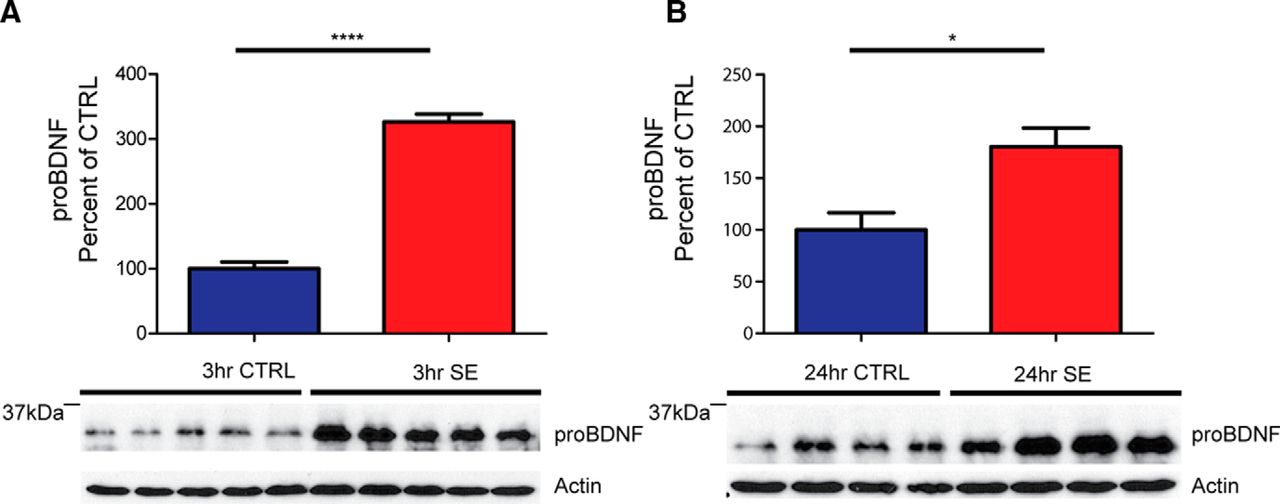
- Figure 2.
ProBDNF protein levels are elevated acutely after pilocarpine-induced SE in WT C57BL/6J mice. A, Bottom, Representative Western blot of whole hippocampal protein homogenates from WT mice killed 3 h after the induction of SE or time-matched saline controls probed with proBDNF (1:1000) and anti-actin antibodies. Top, Densitometry analysis of proBDNF protein abundance. Ratio of proBDNF/actin at 3 h after SE (N = 5), expressed as the percentage change relative to mean values (±SEM) of the control group (N = 5; ****p < 0.001). B, Bottom, Representative Western blot of whole hippocampal protein homogenates from WT mice killed 24 h after the induction of SE or time-matched saline controls probed with proBDNF (1:1000) and anti-actin antibodies. Top, Ratio of proBDNF/actin at 24 h after SE (N = 4) expressed as the percentage change relative to mean values of the control group (N = 4; *p < 0.05).
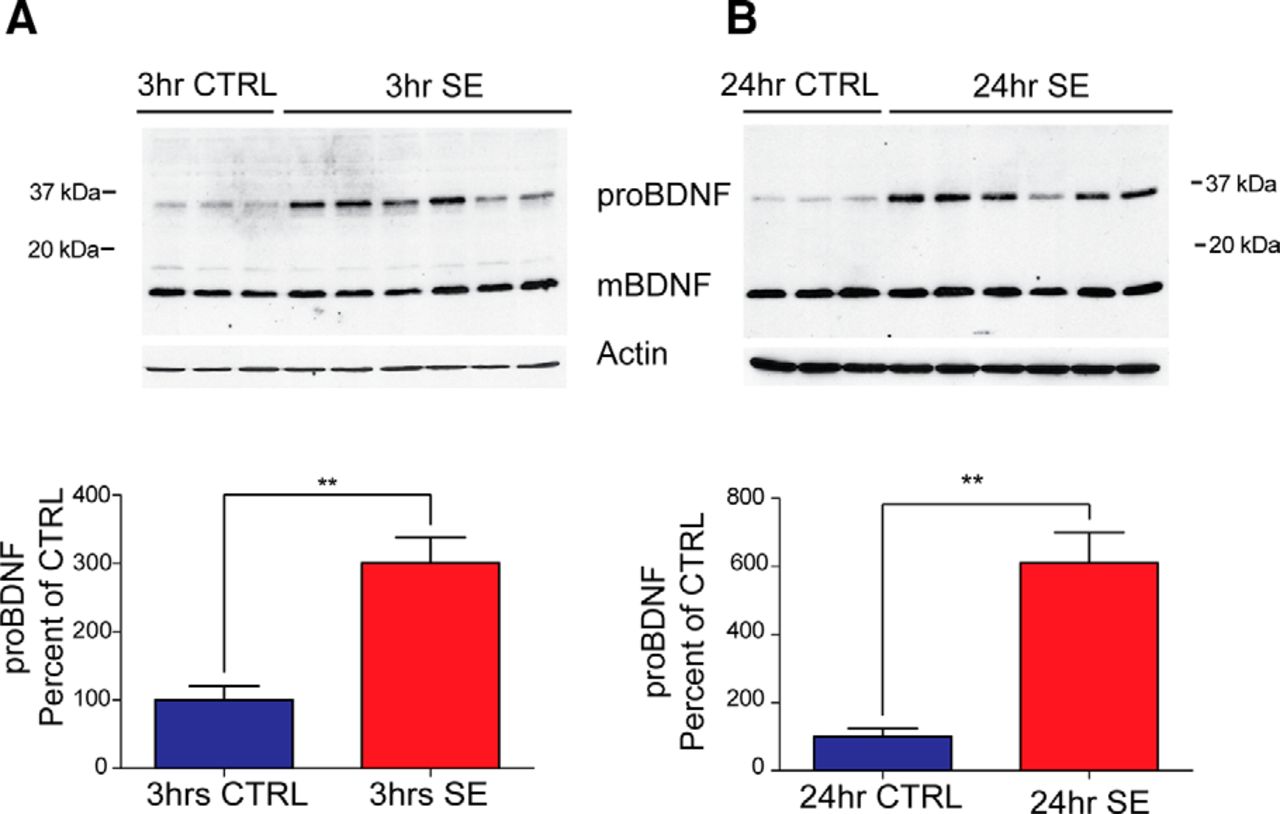
- Figure 3.
ProBDNF levels are elevated in BDNF-HA-tagged mice in the first 24 h after pilocarpine-induced SE. A, Top, Representative Western blot of whole hippocampal protein homogenates from BDNF-HA mice killed 3 h after the induction of SE or time-matched saline controls probed with anti-HA (1:3000) and anti-actin antibodies. Bottom, Densitometry analysis of proBDNF protein abundance. Ratio of proBDNF/actin at 3 h after SE (N = 6) expressed as the percentage change relative to mean values (±SEM) of the control group (N = 3; **p < 0.001). B, Top, Representative Western blot of whole hippocampal protein homogenates from BDNF-HA mice probed with anti-HA (1:3000) and anti-actin antibodies killed 24 h after the induction of SE or time-matched saline controls. Bottom, Densitometry analysis of proBDNF protein abundance at 24 h after SE. Ratio of proBDNF/actin at 24 h post-SE (N = 6) expressed as the percentage change relative to mean values of control group (N = 3; **p < 0.01). Densitometry analysis of mBDNF protein abundance (mBDNF/actin) showed no significant difference between the control and SE group at either time point.
- Figure 4.
BDNF protein is expressed in neurons and astrocytes of hippocampus after pilocarpine-induced SE. A, Representative confocal images of hippocampal subfields from HA-tagged mice 3 h after SE and an age- and handling-matched control (20× magnification; scale bar, 100 µm) shows the presence of HA immunoreactivity in principal cells, glia, and mossy fiber layers. The first column shows anti-HA (green) immunoreactivity with DAPI (blue) in each condition. The second column demonstrates the colocalization of immunoreactivity for HA (green) and the neuronal marker MAP2 (red). The third column demonstrates colocalization of immunoreactivity for HA (green) and the glial marker GFAP (red). B, High-magnification confocal image of CA3 hippocampal subfield (63× magnification; scale bar, 20 µm). White arrowheads correspond to neuronal localization of HA immunoreactivity in pyramidal cells of CA3; blue arrowheads correspond to the localization of HA immunoreactivity in mossy fibers. SL, Stratum lucidum; SP, stratum pyramidale. C, High-magnification confocal image of CA3 hippocampal subfield (63× magnification; scale bar, 20 µm), demonstrating glial expression of BDNF.
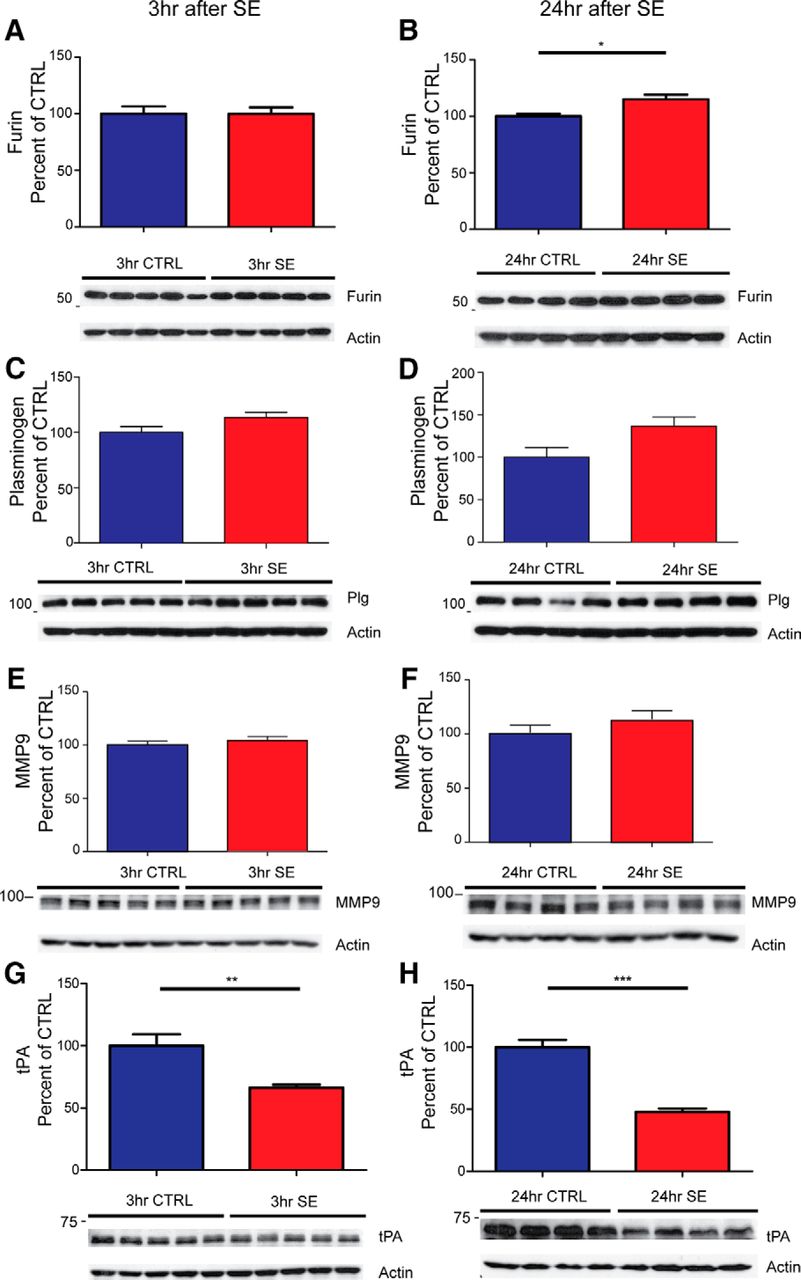
- Figure 5.
Enzymes involved in the processing of proBDNF are altered after pilocarpine-induced SE. Representative Western blots of whole hippocampal protein homogenates from WT mice killed 3 h (left panels) and 24 h (right panels) after the induction of SE or time-matched saline controls. Densitometry analysis of abundance of different cleavage proteins normalized to actin and expressed as the percentage change relative to mean values of the control group (±SEM). A–H, Anti-furin (1:1000; A, B); anti-plasminogen (1:3000; C, D); anti-MMP9 (1:2000; E, F); anti-tPA (1:1000; G, H). The sample size for 3 h is N = 5 in each group and for 24 h is N = 4 in each group. *p < 0.05, **p < 0.01, ***p < 0.001; t test.
- Figure 6.
Inhibitors of proBDNF processing are altered after pilocarpine SE. Representative Western blots of whole hippocampal protein homogenates from WT mice killed 3 h (left panels) and 24 h (right panels) after the induction of SE or time-matched saline controls. Densitometry analysis of abundance of different inhibitor proteins normalized to actin and expressed as the percentage change relative to mean values of the control group (±SEM). A–H, Anti-A2AP (1:2000; A, B); anti-neuroserpin (1:2000; C, D); anti-TIMP-1 (1:1000; E, F); and anti-PAI-1 (1:1000; G, H). The sample size for 3 h is N = 5 in each group, and for 24 h it is N = 4 in each group. **p < 0.01, ***p < 0.001; t test.
- Figure 7.
ProBDNF, PAI-1, and tPA levels at 3 and 7 d following SE. A–C, Right, Representative Western blots of whole hippocampal protein homogenates from WT mice killed 3 d (top panels) or 7 d (bottom panels) after the induction of SE or time-matched saline controls probed with antibodies against proBDNF (A), PAI-1 (B), or tPA (C). Left, Densitometry analysis of abundance of proBDNF (A), PAI-1 (B), or tPA (C) normalized to actin and expressed as the percentage change relative to mean values of control group (±SEM). Anti-proBDNF (1:2000; A); anti-PAI-1 (1:1000; B); and anti-tPA (1:11,000; C). N = 4 for all control groups, and N = 8 for all 7 d SE groups. For 3 d SE groups, N = 4 for proBDNF and N = 5 for PAI-1 and tPA (*p < 0.05, ***p < 0.001; t test was used for all analyses except PAI at 3 d, for which the Mann–Whitney (nonparametric) test was used due to a non-normal dataset).
- Figure 8.
PAI-1 Inhibition reduces proBDNF levels after pilocarpine SE. Right, Representative Western blots of protein homogenates from hippocampal slices from individual WT mice removed 24 h after SE then incubated for 4 h in aCSF containing the PAI-1 inhibitor tiplaxtinin (370 μm; Inhibitor +) or vehicle (DMSO; Inhibitor −), probed with anti-proBDNF (1:2000) or anti-actin antibodies. Left, Densitometry analysis of abundance of proBDNF normalized to actin in homogenates from vehicle-treated (CTRL) and tiplaxtinin-treated (Inhibitor) slices for each animal (N = 5). Tiplaxtinin treatment resulted in a significant reduction in proBDNF levels compared with vehicle treatment (p < 0.05, t test).


Tables
Data structure Type of test Power Figure 2A Increased proBDNF 3 h post-SE (HA immunoreactivity) Normal distribution Student’s t test 0.9775 Figure 2B Increased proBDNF 24 h post-SE (HA immunoreactivity) Normal distribution Student’s t test 0.9917 Figure 3A Increased proBDNF 3 h post-SE (commercial BDNF antibodies) Normal distribution Student’s t test 1.0000 Figure 3B Increased proBDNF 24 h post-SE (commercial BDNF antibodies) Normal distribution Student’s t test 0.9104 Figure 5A No change in furin 3 h post-SE Normal distribution Student’s t test 0.0511 Figure 5B Significant increase in furin 24 h post-SE Normal distribution Student’s t test 0.9198 Figure 5C No change in plasminogen 3 h post-SE Normal distribution Student’s t test 0.5067 Figure 5D No change in plasminogen 24 h post-SE Normal distribution Student’s t test 0.6526 Figure 5E No change in MMP-9 3 h post-SE Normal distribution Student’s t test 0.1905 Figure 5F No change in MMP-9 24 h post-SE Normal distribution Student’s t test 0.2765 Figure 5G Significant reduction in tPA 3 h post-SE Normal distribution Student’s t test 0.9394 Figure 5H Significant reduction in tPA 24 h post-SE Normal distribution Student’s t test 1.0000 Figure 6A No change in A2AP 3 h post-SE Normal distribution Student’s t test 0.5646 Figure 6B No change in A2AP 24 h post-SE Normal distribution Student’s t test 0.1068 Figure 6C Reduction in neuroserpin at 3 h post-SE Normal distribution Student’s t test 0.9961 Figure 6D No change in neuroserpin at 24 h post-SE Normal distribution Student’s t test 0.0744 Figure 6E No change in 23 kDa nonglycosylated TIMP-1 at 3 h post-SE Normal distribution Student’s t test 0.1867 Figure 6E No change in 28 kDa glycosylated TIMP-1 at 3 h post-SE Normal distribution Student’s t test 0.5007 Figure 6F No change in 23 kDa nonglycosylated TIMP-1 at 24 h post-SE Normal distribution Student’s t test 0.6078 Figure 6F Significant reduction in 28 kDa glycosylated TIMP-1 at 24 h post-SE Normal distribution Student’s t test 0.9987 Figure 6G Significant increase in PAI-1 at 3 h post-SE Normal distribution Student’s t test 0.9601 Figure 6H Significant increase in PAI-1 at 24 h post-SE Normal distribution Student’s t test 1.0000 Figure 7A Increased proBDNF 3 d post-SE (commercial BDNF antibodies) Normal distribution Student’s t test 0.971 Figure 7A Increased proBDNF 7 d post-SE (commercial BDNF antibodies) Normal distribution Student’s t test 1.000 Figure 7B Increased PAI-1 3 d post-SE (commercial BDNF antibodies) Non-normal distribution Mann–Whitney test N/A Figure 7B No change in PAI-1 7 d post-SE (commercial BDNF antibodies) Normal distribution Student’s t test 0.985 Figure 7C No change in tPA 3 d post-SE (commercial BDNF antibodies) Normal distribution Student’s t test 0.981 Figure 7C Increased tPA 7 d post-SE (commercial BDNF antibodies) Normal distribution Student’s t test 1.000 Figure 8 PAI-1 inhibition reduces proBDNF levels after pilocarpine SE N/A Paired t test 0.995
In this issue


