

Article Figures & Data
Figures
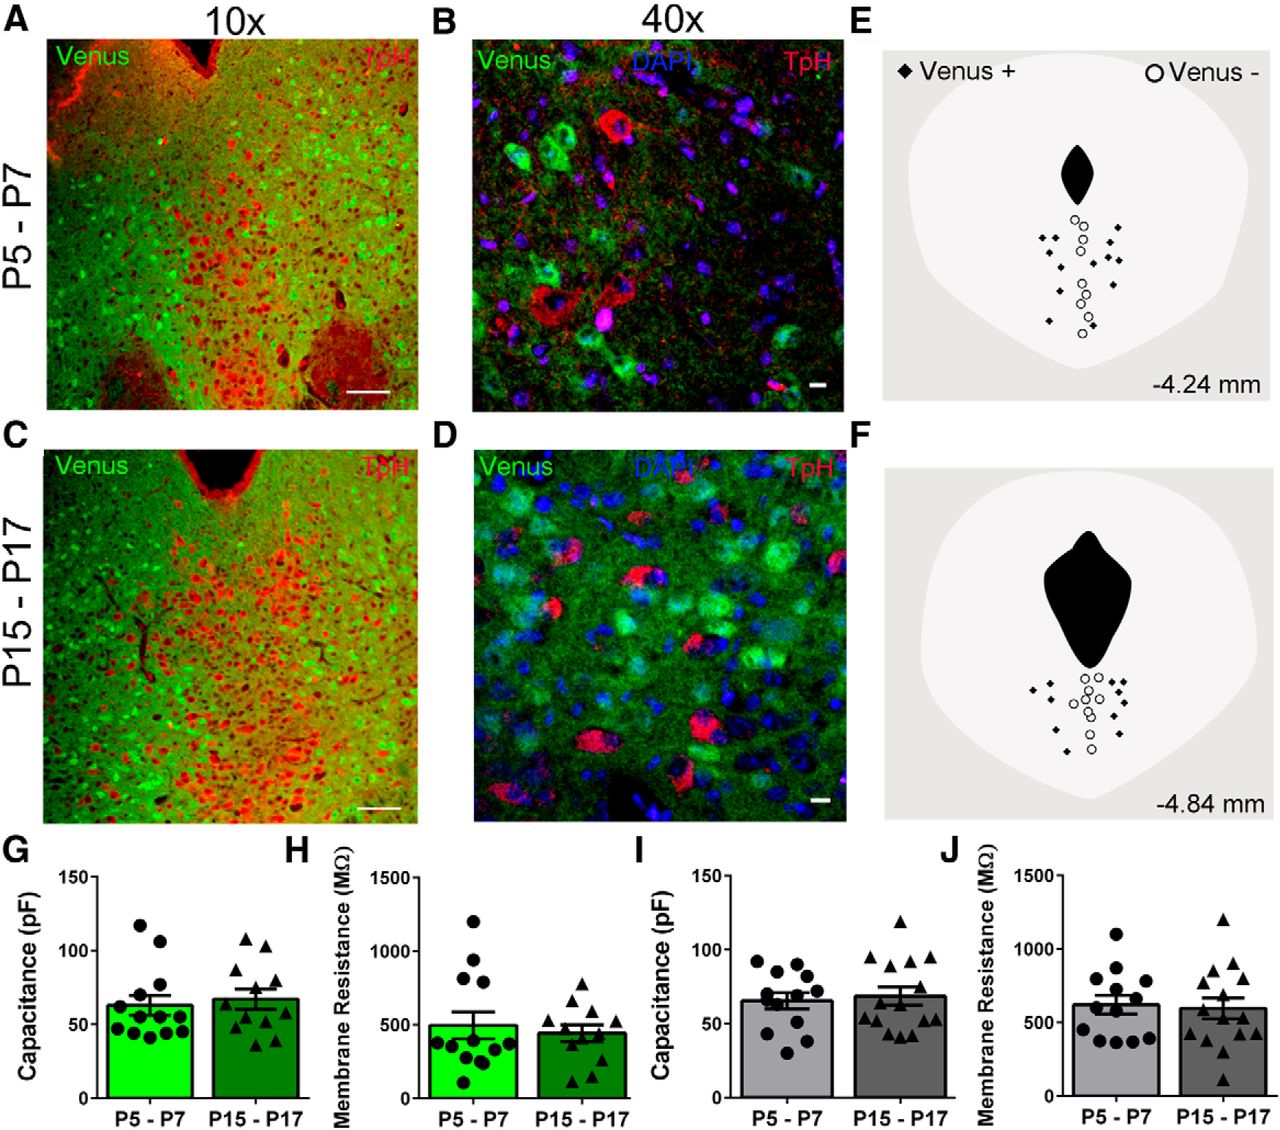
- Figure 1.
Distribution and passive membrane characteristics of Venus+ and Venus− neurons. Immunohistochemistry of GABAergic neurons expressing Venus (green) and 5-HT neurons labeled with mouse anti-tryptophan hydroxylase (TpH; 1:500) and goat anti-mouse IgG-Alexa Fluor 555 antibodies (1:1000; red). A, C, Representative 10× images of the entire DR are shown for P5–P7 and P15–P17. Scale bar, 100 μm. B, D, Higher-magnification confocal images of boundary areas between midline and lateral areas taken from separate immunolabeled sections show that majority of neurons either express GABA (Venus, green) or serotonin (TpH, red; nuclei, blue). Scale bar, 10 μm. E, F, Representative locations of recordings from Venus+ and Venus− neurons in sections approximately −4.24 mm (E) and −4.84 mm (F) away from bregma. G–J, Membrane capacitance and resistance are shown for Venus+ (G, H) and Venus− (I, J) neurons.
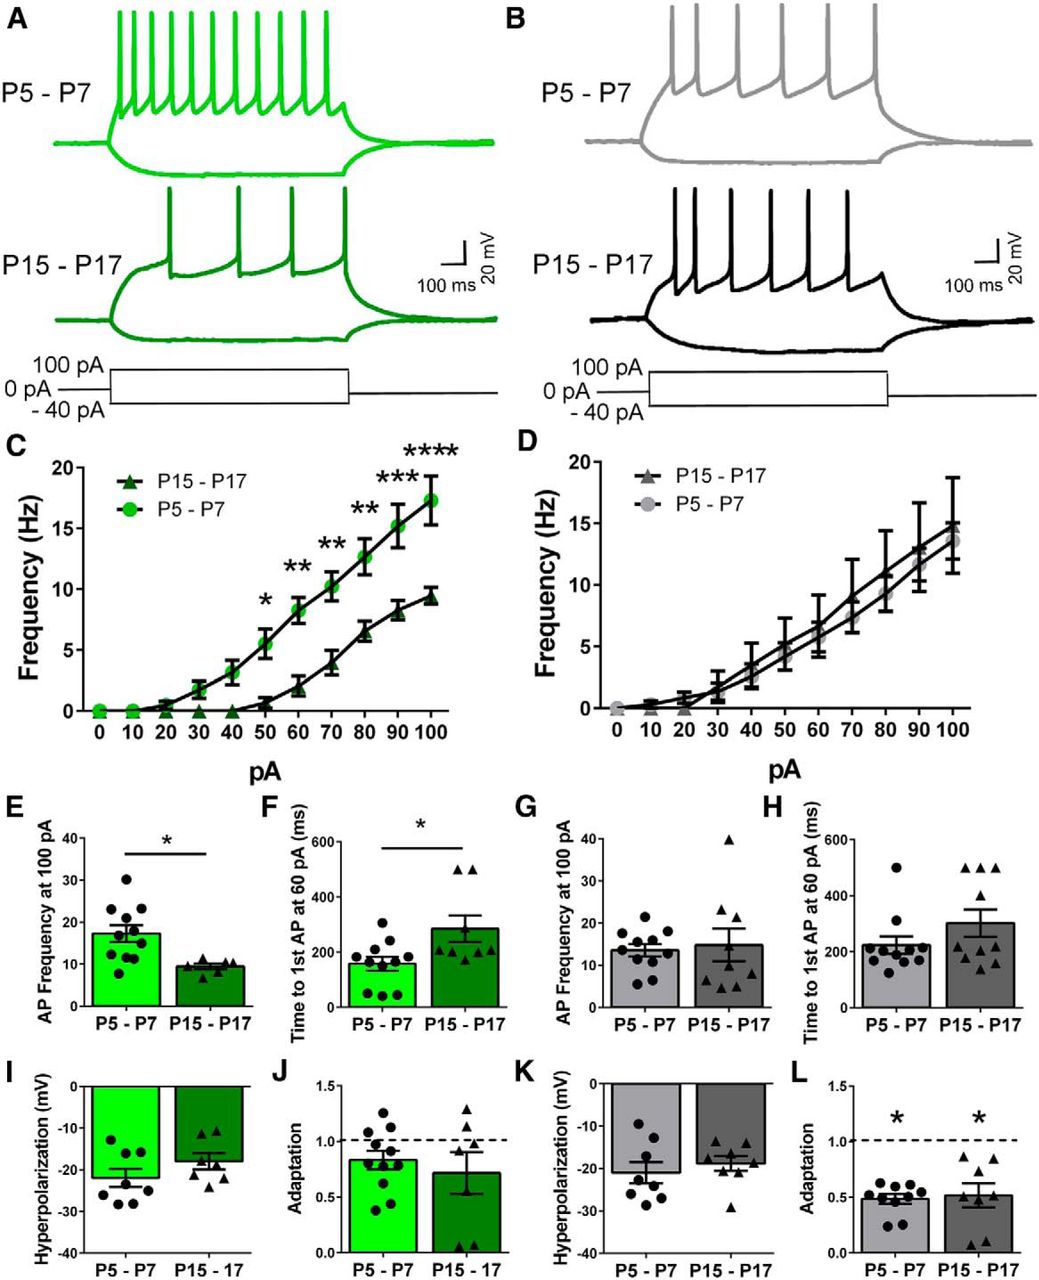
- Figure 2.
Excitability of Venus+ and Venus− neurons. A, B, Representative traces of hyperpolarizing and depolarizing potentials are shown for Venus+ (A) and Venus− (B) neurons at both ages elicited by either a −40 or 100 pA current injection. C, D, Giving sequential current injections and recording the action potential frequency, we generated input–output curves for both Venus+ (C) and Venus− (D) neurons at the indicated age ranges (two-way ANOVA/Sidak test, *p < 0.05, **p < 0.01, ***p < 0.001, ****p < 0.0001). E–H, Excitability was assessed by measuring the action potential firing frequency with 100 pA injected and the time to the first action potential when 60 pA was injected in both Venus+ (E, F) and Venus− (G, H) neurons. I, K, Hyperpolarization was measured as the negative peak membrane potential evoked by −40 pA injection in Venus+ (I) and Venus− (K) neurons at both ages. J, L, Adaptation was measured by dividing the instantaneous frequency of the last two action potentials by the instantaneous frequency of the first two action potentials when 100 pA was injected into Venus+ (J) and Venus− (L) neurons at both ages.
- Figure 3.
Action potential properties of Venus+ and Venus− neurons. The first action potential that was generated from the 70 pA current injection from each cell was then averaged together to generate the action potential traces. A, B, The averaged action potentials traces are shown for Venus+ (A) and Venus− (B) neurons at P5–P7 and P15–P17. C–F, We generated the phase plots by comparing the ΔV/Δt versus the membrane potential (mV) for each Venus+ (C, D) or Venus− (E, F) neuron at both ages. G–J, We also measured the depolarizing and repolarizing slopes of the action potentials from Venus + (G, H) and Venus− (I, J) neurons. The individual action potentials were used to measure the action potential properties. K–R, We used the Mini-Analysis software AP waveform analysis 2 to measure the action potential threshold (K, M), duration (L, N), peak amplitude (O, Q), and AHP (P, R).
- Figure 4.
sEPSCs in Venus+ and Venus− neurons. A, B, Representative currents and averaged currents from individual cells are shown for both Venus+ (A) and Venus− (B) neurons. The cumulative probability plots from all the cells were averaged together to generate the cumulative probability plots shown for each parameter. Pooled data are shown in the inset bar graph. C–H, The interevent interval (C, D), peak amplitude (E, F), and rise time (G, H) are shown as a cumulative probability plot, and averaged data in the inset bar graphs for both Venus+ and Venus− neurons. I, J, The averaged sEPSC for each cell was fitted with a double exponential function to calculate the decay rates for Venus+ (I) and Venus− (J) neurons.
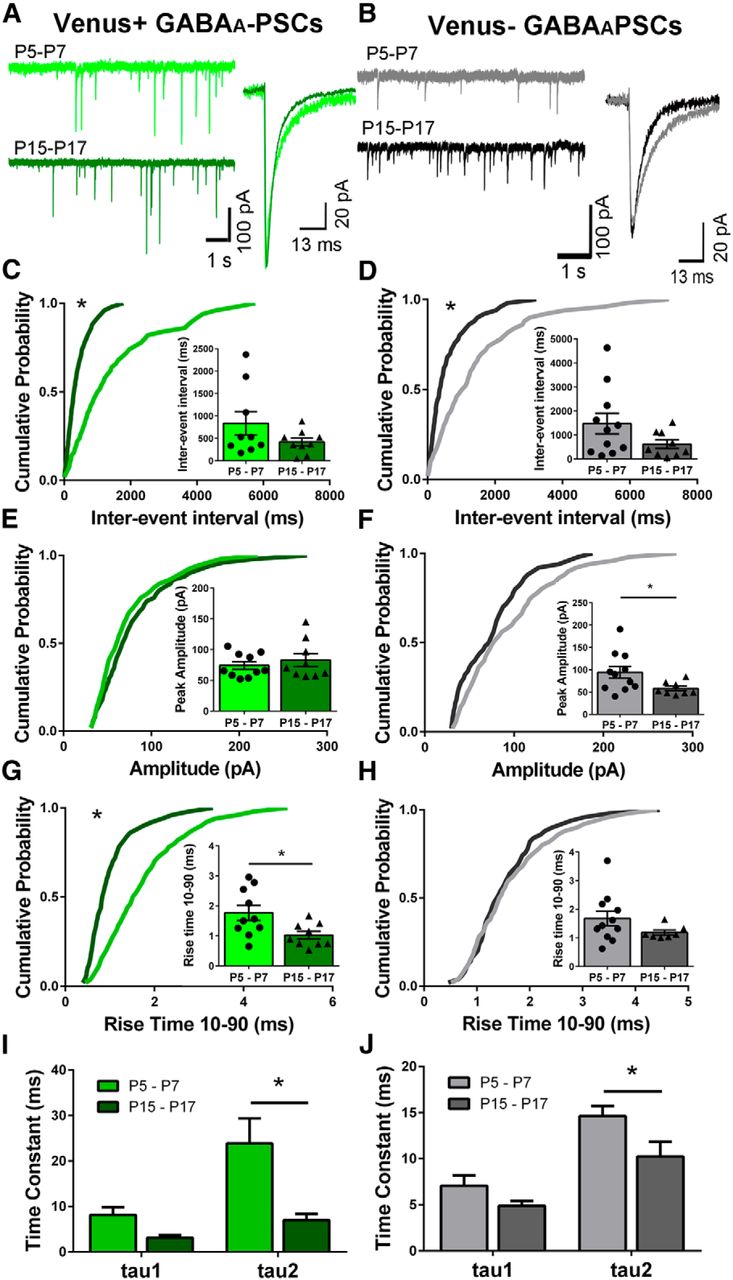
- Figure 5.
GABAA-sPSCs in Venus+ and Venus− neurons. A, B, Representative traces and averaged currents from individual cells are shown for Venus+ (A) and Venus− (B) neurons. The cumulative probability plots from all the cells were averaged together to generate the cumulative probability plots shown for each parameter. Pooled data are shown in the inset bar graph. C–H, The interevent interval (C, D), peak amplitude (E, F), and rise time (G, H) are shown as a cumulative probability plot, and averaged data are shown in the inset bar graphs for both Venus+ and Venus− neurons. I, J, The averaged GABAA-PSC for each cell was fitted with a double exponential curve to calculate the decay rates for Venus+ (I) and Venus− (J) neurons.


Tables
Normal distribution? Type of test 95% CI Figure a No Mann-Whitney test −13.00 to 25.00 Figure 1G b Yes Unpaired t test −14.21 to 20.48 Figure 1I c Yes Unpaired t test −279.7 to 174.3 Figure 1H d Yes Unpaired t test −224.5 to 174.9 Figure 1J e Yes Two-way ANOVA/Sidak test Figure 2C 0 −4.748 to 4.748 10 −4.748 to 4.748 20 −4.281 to 5.215 30 −3.008 to 6.488 40 −1.593 to 7.903 50 0.09514–9.591 60 1.460–10.96 70 1.515–11.01 80 1.362–10.86 90 2.179–11.67 100 3.075–12.57 f Yes Two-way ANOVA/Sidak test Figure 2D 0 −7.016 to 7.016 10 −6.714 to 7.319 20 −6.151 to 7.881 30 −7.393 to 6.640 40 −7.934 to 6.099 50 −8.022 to 6.011 60 −7.914 to 6.119 70 −8.757 to 5.276 80 −8.829 to 5.204 90 −8.425 to 5.608 100 −8.268 to 5.765 g Yes Unpaired t test −13.78 to −1.867 Figure 2E h Yes Unpaired t test 20.16–234.1 Figure 2F i Yes Unpaired t test −6.829 to 9.331 Figure 2G j No Mann-Whitney test −30.40 to 285.4 Figure 2H k Yes Unpaired t test −2.389 to 10.40 Figure 2I l Yes Unpaired t test −0.3530 to 0.01819 Figure 2J Yes Unpaired t test −0.7454 to 0.1780 Figure 2J m Yes Unpaired t test −4.370 to 8.690 Figure 2K n Yes Unpaired t test −0.6123 to −0.4160 Figure 2L Yes Unpaired t test −0.7372 to −0.2279 Figure 2L o Yes Unpaired t test −12.07 to 4.312 Figure 3E p Yes Unpaired t test −4.155 to 7.648 Figure 3F q Yes Unpaired t test −16.31 to 4.093 Figure 3G r Yes Unpaired t test −11.55 to 7.828 Figure 3H s Yes Unpaired t test −0.4426 to 0.2965 Figure 3I t No Mann-Whitney test −1.600 to 0.6000 Figure 3J u Yes Unpaired t test −7.116 to 8.198 Figure 3K v Yes Unpaired t test −8.008 to 5.609 Figure 3L w Yes Unpaired t test −443.2 to 415.8 Figure 4C x Yes Unpaired t test −335.8 to 754.5 Figure 4D y No Mann-Whitney test −15.70 to 3.638 Figure 4E z Yes Unpaired t test -33.27 to -5.591 Figure 4F aa Yes Unpaired t test −0.2000 to 0.3147 Figure 4G bb Yes Unpaired t test −0.07351 to 0.4604 Figure 4H cc Yes Two-way ANOVA/Sidak test tau1 2.265 to −2836 Figure 4I tau2 4.608 to −0.902 dd Yes Two-way ANOVA/Sidak test tau1 −0.043 to −1.006 Figure 4J tau2 −1.069 to −2.061 ee Yes Unpaired t test −999.6 to 170.1 Figure 5C ff Yes Unpaired t test −1916 to 205.6 Figure 5D gg Yes Unpaired t test −16.17 to 33.75 Figure 5E hh Yes Unpaired t test −70.48 to −1.596 Figure 5F ii Yes Unpaired t test −1.353 to −0.1316 Figure 5G jj No Mann-Whitney test −1.062 to 0.2104 Figure 5H kk Yes Two-way ANOVA/Sidak test tau1 −4.499 to 14.47 Figure 5I ll tau2 6.488–27.19 ff2 Yes Two-way ANOVA/Sidak test tau1 −1.403 to 5.741 Figure 5J gg1 tau2 0.3881–8.439
In this issue


