
Main menu

  • HOME
  • CONTENT
    • Early Release
    • Featured
    • Current Issue
    • Issue Archive
    • Blog
    • Collections
    • Podcast
  • TOPICS
    • Cognition and Behavior
    • Development
    • Disorders of the Nervous System
    • History, Teaching and Public Awareness
    • Integrative Systems
    • Neuronal Excitability
    • Novel Tools and Methods
    • Sensory and Motor Systems
  • ALERTS
  • FOR AUTHORS
  • ABOUT
    • Overview
    • Editorial Board
    • For the Media
    • Privacy Policy
    • Contact Us
    • Feedback
  • SUBMIT

User menu

Search

  • Advanced search
eNeuro

eNeuro

Advanced Search


  • HOME
  • CONTENT
    • Early Release
    • Featured
    • Current Issue
    • Issue Archive
    • Blog
    • Collections
    • Podcast
  • TOPICS
    • Cognition and Behavior
    • Development
    • Disorders of the Nervous System
    • History, Teaching and Public Awareness
    • Integrative Systems
    • Neuronal Excitability
    • Novel Tools and Methods
    • Sensory and Motor Systems
  • ALERTS
  • FOR AUTHORS
  • ABOUT
    • Overview
    • Editorial Board
    • For the Media
    • Privacy Policy
    • Contact Us
    • Feedback
  • SUBMIT
PreviousNext
Research ArticleNew Research, Integrative Systems

Distribution, Amplitude, Incidence, Co-Occurrence, and Propagation of Human K-Complexes in Focal Transcortical Recordings

Rachel A. Mak-McCully, Burke Q. Rosen, Matthieu Rolland, Jean Régis, Fabrice Bartolomei, Marc Rey, Patrick Chauvel, Sydney S. Cash and Eric Halgren
eNeuro 2 September 2015, 2 (4) ENEURO.0028-15.2015; DOI: https://doi.org/10.1523/ENEURO.0028-15.2015
Rachel A. Mak-McCully
1Department of Neurosciences, University of California, San Diego, San Diego, California 92093
  • Find this author on Google Scholar
  • Find this author on PubMed
  • Search for this author on this site
Burke Q. Rosen
2Department of Radiology, University of California, San Diego, San Diego, California 92093
  • Find this author on Google Scholar
  • Find this author on PubMed
  • Search for this author on this site
Matthieu Rolland
2Department of Radiology, University of California, San Diego, San Diego, California 92093
  • Find this author on Google Scholar
  • Find this author on PubMed
  • Search for this author on this site
Jean Régis
4Aix-Marseille Université, Marseille 13385, France
5INSERM, Institut de Neurosciences des Systèmes UMR 1106, Marseille 13005, France
6Assistance Publique–Hôpitaux de Marseille, Timone Hospital, Marseille 13005, France
  • Find this author on Google Scholar
  • Find this author on PubMed
  • Search for this author on this site
Fabrice Bartolomei
4Aix-Marseille Université, Marseille 13385, France
5INSERM, Institut de Neurosciences des Systèmes UMR 1106, Marseille 13005, France
6Assistance Publique–Hôpitaux de Marseille, Timone Hospital, Marseille 13005, France
  • Find this author on Google Scholar
  • Find this author on PubMed
  • Search for this author on this site
Marc Rey
4Aix-Marseille Université, Marseille 13385, France
5INSERM, Institut de Neurosciences des Systèmes UMR 1106, Marseille 13005, France
6Assistance Publique–Hôpitaux de Marseille, Timone Hospital, Marseille 13005, France
  • Find this author on Google Scholar
  • Find this author on PubMed
  • Search for this author on this site
Patrick Chauvel
4Aix-Marseille Université, Marseille 13385, France
5INSERM, Institut de Neurosciences des Systèmes UMR 1106, Marseille 13005, France
6Assistance Publique–Hôpitaux de Marseille, Timone Hospital, Marseille 13005, France
  • Find this author on Google Scholar
  • Find this author on PubMed
  • Search for this author on this site
Sydney S. Cash
7Department of Neurology, Massachusetts General Hospital and Harvard Medical School, Harvard University, Boston, Massachusetts 02114
  • Find this author on Google Scholar
  • Find this author on PubMed
  • Search for this author on this site
  • ORCID record for Sydney S. Cash
Eric Halgren
1Department of Neurosciences, University of California, San Diego, San Diego, California 92093
2Department of Radiology, University of California, San Diego, San Diego, California 92093
3Department of Psychiatry, University of California, San Diego, San Diego, California 92093
  • Find this author on Google Scholar
  • Find this author on PubMed
  • Search for this author on this site
  • Article
  • Figures & Data
  • Info & Metrics
  • eLetters
  • PDF
Loading

Article Figures & Data

Figures

  • Tables
  • Figure 1.
    • Download figure
    • Open in new tab
    • Download powerpoint
    Figure 1.

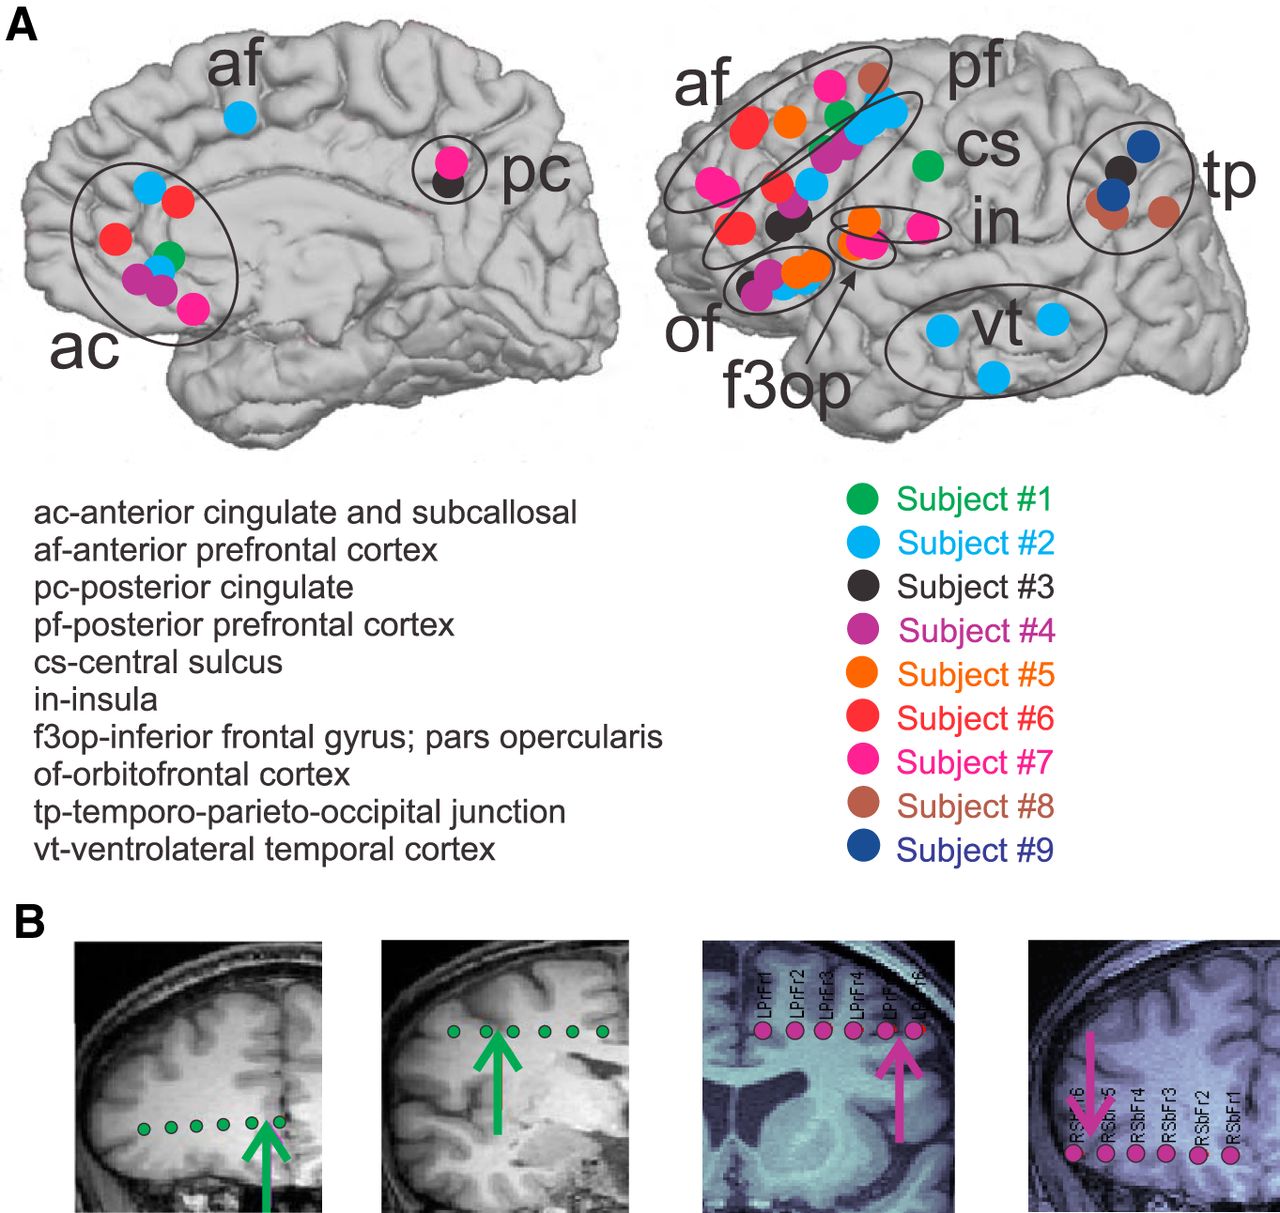
    Bipolar SEEG contacts. A, Bipolar SEEG contacts, color coded by subject, are marked by circles on the medial (left) and lateral (right) surfaces of the brain. Bipolar SEEG contacts are grouped into 1 of 10 anatomical groups, as demarcated by black circles and/or one of the following labels: ac (anterior cingulate and subcallosal); af (anterior prefrontal cortex); pc (posterior cingulate); pf (posterior prefrontal cortex); cs (central sulcus); in (insula); f3op (inferior frontal gyrus; pars opercularis); of (orbitofrontal cortex); tp (temporo-parieto-occipital junction); vt (ventrolateral temporal cortex). B, Example SEEG electrodes for subject 1 (green) and subject 4 (purple) are superimposed on the subjects’ MRIs. The arrows indicate the location of the bipolar contact pair chosen on each electrode. From the MRI, it is possible to see that the two contacts in each pair are spanning the local cortical mantle.

  • Figure 2.
    • Download figure
    • Open in new tab
    • Download powerpoint
    Figure 2.

    Example KC localizations, waveforms, and down state confirmations. KCs are plotted from representative sites across the cortical areas sampled. Individual KCs for each bipolar location are plotted in black with the average KC overlaid in red. The number of individual KCs plotted is listed above the waveforms. Below the KC waveforms, time frequency plots from 5 to 120 Hz with a −1.5 to −0.5 s baseline relative to the most negative peak of the KC at time zero indicate a significant drop (p < 0.01, uncorrected) in high gamma power at the time of the KC. Arrows indicate the bipolar locations where the plotted waveforms and time–frequency plots were recorded. Circles indicate the subject color-coded bipolar channel locations, as in Figure 1. The four additional red squares indicate sites where KCs were located, but not included for additional analysis because they were part of an epileptic region or potentially in entorhinal cortex.

  • Figure 3.
    • Download figure
    • Open in new tab
    • Download powerpoint
    Figure 3.

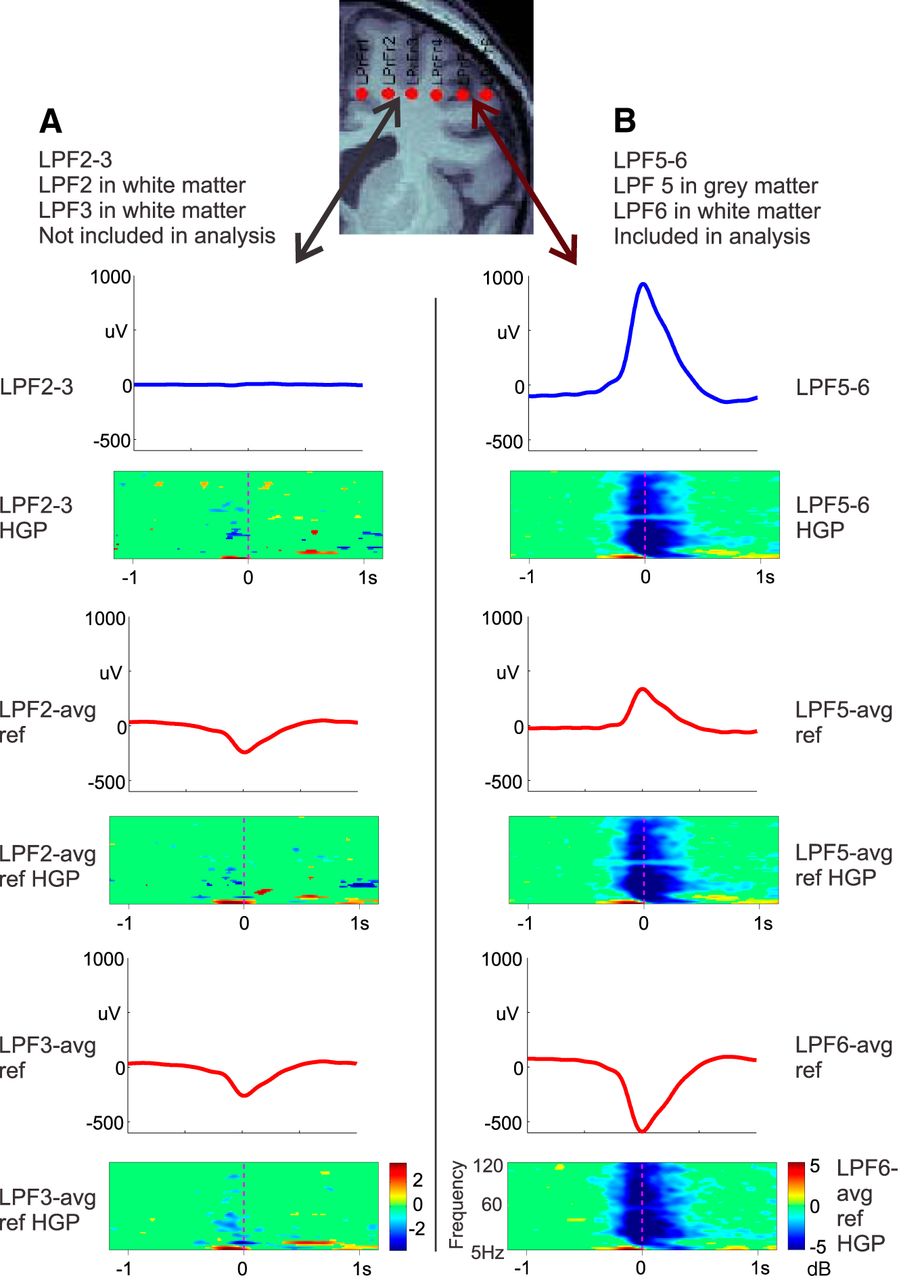
    Bipolar versus common average reference recordings. Bipolar KC recordings (blue waveforms) were compared with monopolar KC recordings (red waveforms) referenced to a common average reference (T3, T5, F3, C3, P3, O1, F4, C4, P4, O2, T4, and T6) as in Wennberg (2010). Two pairs of adjacent contacts located on the same electrode of subject 4 were examined. A, Bipolar (blue) and referential (red) recordings from two adjacent contacts, both located in the white matter, as confirmed by MRI. Bipolar recordings show no KCs, but referential recordings do, despite the fact that no decrease in high gamma power is present in the time–frequency plots below each waveform. Thus, referential recordings show KCs even when they are not locally generated. B, Bipolar (blue) and referential (red) recordings from two adjacent contacts that span the gray matter, as confirmed by MRI. Both bipolar and referential recordings show KCs, together with decreased high gamma power. All recordings were averaged with respect to the peaks of KCs identified in the bipolar recordings in B.

  • Figure 4.
    • Download figure
    • Open in new tab
    • Download powerpoint
    Figure 4.

    KC amplitudes vary across the cortex. A, The average amplitude of manual KCs at each channel, color coded by subject, is highly variable across the cortex. However, no significant effects are found when a linear mixed-effects model is applied. B, The addition of KC-like activity shows a similar pattern, but with the increased sample, the same linear mixed-effects model now finds that the anterior prefrontal channels highlighted by the blue circle are ∼30% smaller than the orbitofrontal reference (p = 0.045). Black circles in the top right indicate the amplitude scale represented by the size of each circle.

  • Figure 5.
    • Download figure
    • Open in new tab
    • Download powerpoint
    Figure 5.

    KC occurrence rates vary across the cortex. A, Manually marked KCs color coded for each subject. The size of the circle indicates the KC occurrence rate at each location, normalized to the maximum KC occurrence rate seen on any channel for that subject. Black circles in the top right indicate this normalized occurrence rate scale. Locations identified by a linear mixed-effects model to have a significantly higher occurrence rate than the orbitofrontal reference are highlighted by pink circles. Locations identified as occurring significantly less frequently are highlighted by blue circles. B, KC-like activity in addition to manually marked KCs. The locations showing a lower occurrence rate are the same as in A. The locations showing a higher occurrence rate differ with the addition of the template-detected KCs.

  • Figure 6.
    • Download figure
    • Open in new tab
    • Download powerpoint
    Figure 6.

    Observed manual KCs versus those expected under the null hypothesis of independent occurrence, for representative nights for each subject. A, KC events observed for each subject were classified into two groups: KCs with one participating channel (light orange); and KCs with two or more participating channels (dark orange). B, KC events derived from simulating an expected distribution for each subject were classified into the same two groups: one channel (light purple); and two or more channels (dark purple). For all subjects, there are more KCs that occur only in one channel expected under the null hypothesis than were actually observed. These distributions are tested statistically using a Fisher’s exact test, and these results are listed in Table 3.

  • Figure 7.
    • Download figure
    • Open in new tab
    • Download powerpoint
    Figure 7.

    Lack of systematic sequential order in KCs. Sequence pairs that are significant with manually marked KCs are plotted with red arrows, while sequence pairs that are significant only after the addition of KC-like activity are plotted with blue arrows. Sequence pairs tested but not significant are plotted in yellow. A, Subject 3 has electrodes in frontal and parietal cortices, but only shows significant sequences within the frontal lobe, and only after the addition of KC-like activity. B, Subject 2 shows a large number of significant sequence pairs (16) in manually marked KCs, the majority of which lead to the temporal lobe (11). This pattern is strengthened with the addition of KC-like activity (18 of 29 additional significant pairs). A variety of other significant sequences are seen within the frontal lobe.

  • Figure 8.
    • Download figure
    • Open in new tab
    • Download powerpoint
    Figure 8.

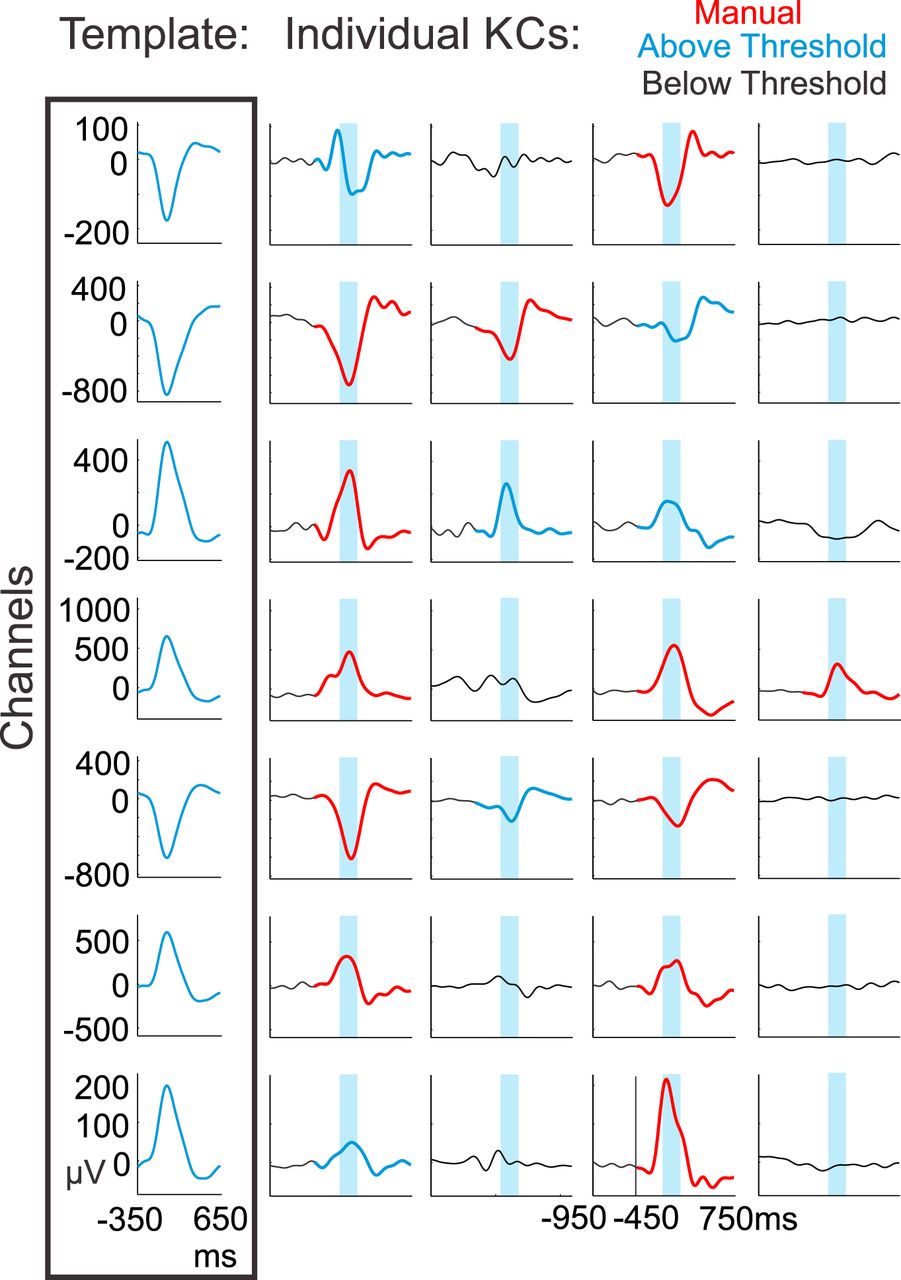
    Template application to detect KC-like activity. Channel-specific templates were created for each subject by averaging from −350 to +650 ms on the most negative peak at time zero over the manually detected KCs in each channel (box at left). The channel-specific templates were then applied when a manually marked KC occurred in at least one channel. The templates were applied from −450 to +750 ms, with time zero representing the average time between the first and last manually chosen channel peaks within a KC. Four such examples from subject 6 are plotted vertically. Manually marked KCs are plotted in red. The maximum value of the sliding inner product between the signal and the template was taken over the blue highlighted window. If the value was above the 99th percentile of the null distribution for that channel and corresponded to the largest (or smallest) peak over the entire 1200 ms window, the KC was recorded as KC-like activity (KCs in blue), and if it was below the threshold, it was not (signal in black).

  • Figure 9.
    • Download figure
    • Open in new tab
    • Download powerpoint
    Figure 9.

    Manually detected KCs have smaller pre-KC period variance and larger amplitude than template-detected KCs. A, The probability density of variance in the pre-KC period (−1.4 to −0.4 s prior to peak) is plotted for the null times (black), manually detected KCs (red), and template-detected KCs (blue) for each of subject 1’s four channels. B, The KC peak amplitude probability density of null times (black), manually detected KCs (red), and template-detected KCs (blue) are plotted for the same four channels as in A. C, For each channel, the manually detected (red circles) and template-detected (blue triangles) z-scores were calculated for the KC peak amplitude and the pre-KC period variance referenced to the null values. A line connects the manually detected and template-detected values for each channel. A green line indicates that the amplitude of template-detected KCs is smaller than that of manually detected KCs in that channel; a black line indicates the opposite relationship. On the right is an expansion of the lower left corner, which is outlined by a gray box.

  • Figure 10.
    • Download figure
    • Open in new tab
    • Download powerpoint
    Figure 10.

    Including KC-like activity increases multichannel KC participation. The addition of KC-like activity (blue columns) to the manually marked KCs (red columns) increased the number of channels that were participating in KCs for all subjects. A, In subjects where a small number of manually marked KCs included the participation of all channels, the addition of KC-like activity increased the percentage of such KCs. B, Subjects who did not show maximum channel participation with manually marked KCs displayed KCs that included all channels after the addition of KC-like activity. In subjects 2 and 6 (pictured), and subject 3 (not pictured), the classification of KCs using a 200 ms crawl window slightly shifted the distribution of manual multichannel participation to the right (gray columns), but not to the extent of the addition of KC-like activity (blue columns).

  • Figure 11.
    • Download figure
    • Open in new tab
    • Download powerpoint
    Figure 11.

    Anterior-to-posterior contact pair distance versus KC latency delay. A, The distance between anterior-to-posterior channel pairs was plotted as a function of the average KC latency difference between the two channels, for all contact pairs (black circles and red triangles). The linear mixed-model regression between anterior-to-posterior distance and delay for all pairs is plotted as a purple line (p = 0.007), and, after excluding the temporal pairs (plotted with red triangles), is plotted as a green line (p = 0.08). B, The distance between the same anterior-to-posterior channel pairs as in A was plotted as a function of each individual KC latency difference (black circles and red triangles). A linear mixed-model regression calculated to determine whether a significant relationship existed for individual KCs on these pairs was significant at p < 10−4 (purple line). Excluding the temporal pairs plotted with red triangles, the linear mixed-model regression was still significant at p = 0.003 (green line).

  • Figure 12.
    • Download figure
    • Open in new tab
    • Download powerpoint
    Figure 12.

    Comparison of N2 and N3 KCs. A, Waveforms of averaged N2 and N3 KCs overlaid for subject 1’s four channels exhibit highly similar KC morphology. B, Multichannel KC participation is not consistently greater in N2 or N3. The percentage of KCs occurring in each number of channels for N2 (red) and N3 (blue) are plotted for subjects 4, 6, and 9. Subjects 6 and 9 show N2 KCs involving more channels, but this is not the pattern seen in all subjects, as shown with subject 4. When a χ2 test was performed for each subject on these distributions, only subjects 6 (p = 0.011) and 9 (p = 0.000056) exhibited significant differences.

  • Figure 13.
    • Download figure
    • Open in new tab
    • Download powerpoint
    Figure 13.

    Summary of current KC findings compared with previous views. A, Previous scalp EEG and intracranial studies of the KC and isolated SOs (i.e., KCs) find the KCs with the largest amplitudes in midline prefrontal regions (orange star), as well as strong (blue arrow), one-directional (faded orange background) propagation from anterior to posterior cortical regions. B, Our current findings indicate that when measured locally, KCs are actually smallest in amplitude in anterior prefrontal regions (orange star). KCs may co-occur (uniform yellow background) across variably small or large areas of cortex (stars and arrows). Propagation may occur from anterior to temporal regions (gray arrow), but also occurs in a variety of patterns across the cortex (groups of colored arrows). This variability in KC onset, extent, and spread could be used by the cortex during replay to consolidate memories encoded with correspondingly variable spatiotemporal encoding patterns.

Tables

  • Figures
    • View popup
    Table 1.

    Demographic and clinical information for all patients studied

    SubjectGenderAge (years)HandednessClinical diagnosisPathologic diagnosisImagingFocusIQ (FSIQ)
    1M45LCPS; bitemporalNo pathology obtainedLeft and right mesial temporal lobes83
    2F58RCPS; possible generalized epilepsyNo pathologyobtainedLikely generalized80
    3F45RCPS; multifocalMultifocal: temporal, parietal, occipitalTemporalAverage
    4F65RCPS; temporal lobe epilepsy with two foci: left mesial temporal structures and right subfrontal regionNo pathology obtainedRight subfrontal and anterior temporal101
    5F27RRight temporal lobe epilepsyNo pathology obtainedRight hippocampal sclerosisHippocampus, entorhinal cortex, amygdalaAverage
    6F32RLeft temporal lobe epilepsyNon-specific gliosisNormalHippocampus, entorhinal cortex, amygdala77
    7F23RRight temporal lobe epilepsyType I focal dysplasiaNormalHippocampus, entorhinal cortex,anterior insula86
    8F28RRight temporal occipital epilepsyType II focal dysplasiaFocal cortical dysplasia in right fusiformFusiform gyrus, entorhinal cortexAverage
    9F50RRight temporal occipital epilepsyNo pathology obtainedNormalRight fusiform gyrus110
    • FSIQ, Full Scale Intelligence Quotient; CPS, Complex Partial Seizures.

    • View popup
    Table 2.

    Mean and SD of maximum KC peak differences between manually chosen KCs for each night for each subject

    SubjectChannels (n)Mean of maximum KC peak differences (ms)SD (ms)
    1461.149.5
    2139959.6
    3586.359.5
    4766.354.1
    5
    N1524.823.8
    N2527.826.4
    N3532.227.7
    6
    N1771.348.5
    N2766.445.6
    N3781.252.8
    N4760.354
    7
    N1868.659.1
    N2863.257.2
    N3873.461.2
    N4877.763.1
    N5870.751.1
    N6874.959.7
    8
    N1449.853.4
    N2479.242
    N3467.559.7
    9
    N1295.259.4
    N22115.20
    N3252.239
    N4278.683
    • View popup
    Table 3.

    Fisher’s exact test for co-occurrence for one channel and two or more channels; three or more channels; four or more channels; and five or more channels for all nights for all subjects

    Subject1 Channel and ≥2 channels1 Channel and ≥3 channels1 Channel and ≥4 channels1 Channel and ≥5 channels
    1< 2.2E-169.49E-120.000445
    2< 2.2E-16< 2.2E-16< 2.2E-16< 2.2E-16
    3< 2.2E-16< 2.2E-166.24E-090.00493
    4< 2.2E-16< 2.2E-165.38E-08
    5
    N1< 2.2E-16
    N25.40E-14
    N32.96E-130.0135
    6
    N1< 2.2E-16< 2.2E-16< 2.2E-161.10E-15
    N2< 2.2E-16< 2.2E-16< 2.2E-16< 2.2E-16
    N3< 2.2E-16< 2.2E-16< 2.2E-161.25E-15
    N43.92E-100.0125
    7
    N1< 2.2E-162.33E-06
    N2< 2.2E-161.20E-05
    N3< 2.2E-161.61E-050.0140
    N4< 2.2E-162.00E-08
    N59.50E-06
    N68.09E-08
    8
    N1< 2.2E-160.000355
    N20.00227
    N30.000107
    9
    N10.215
    N20.497
    N30.000312
    N40.0140
    • Bonferroni correction at p < 0.05 was applied across all tests. Values in bold are significant after this Bonferroni correction.

Back to top

In this issue

eneuro: 2 (4)
eNeuro
Vol. 2, Issue 4
July/August 2015
  • Table of Contents
  • Index by author
Email

Thank you for sharing this eNeuro article.

NOTE: We request your email address only to inform the recipient that it was you who recommended this article, and that it is not junk mail. We do not retain these email addresses.

Enter multiple addresses on separate lines or separate them with commas.
Distribution, Amplitude, Incidence, Co-Occurrence, and Propagation of Human K-Complexes in Focal Transcortical Recordings
(Your Name) has forwarded a page to you from eNeuro
(Your Name) thought you would be interested in this article in eNeuro.
CAPTCHA
This question is for testing whether or not you are a human visitor and to prevent automated spam submissions.
Print
View Full Page PDF
Citation Tools
Distribution, Amplitude, Incidence, Co-Occurrence, and Propagation of Human K-Complexes in Focal Transcortical Recordings
Rachel A. Mak-McCully, Burke Q. Rosen, Matthieu Rolland, Jean Régis, Fabrice Bartolomei, Marc Rey, Patrick Chauvel, Sydney S. Cash, Eric Halgren
eNeuro 2 September 2015, 2 (4) ENEURO.0028-15.2015; DOI: 10.1523/ENEURO.0028-15.2015

Citation Manager Formats

  • BibTeX
  • Bookends
  • EasyBib
  • EndNote (tagged)
  • EndNote 8 (xml)
  • Medlars
  • Mendeley
  • Papers
  • RefWorks Tagged
  • Ref Manager
  • RIS
  • Zotero
Respond to this article
Share
Distribution, Amplitude, Incidence, Co-Occurrence, and Propagation of Human K-Complexes in Focal Transcortical Recordings
Rachel A. Mak-McCully, Burke Q. Rosen, Matthieu Rolland, Jean Régis, Fabrice Bartolomei, Marc Rey, Patrick Chauvel, Sydney S. Cash, Eric Halgren
eNeuro 2 September 2015, 2 (4) ENEURO.0028-15.2015; DOI: 10.1523/ENEURO.0028-15.2015
Reddit logo Twitter logo Facebook logo Mendeley logo
  • Tweet Widget
  • Facebook Like
  • Google Plus One

Jump to section

  • Article
    • Abstract
    • Significance Statement
    • Introduction
    • Materials and Methods
    • Results
    • Discussion
    • Acknowledgments
    • Footnotes
    • References
    • Synthesis
  • Figures & Data
  • Info & Metrics
  • eLetters
  • PDF

Keywords

  • depth recordings
  • k-complex
  • memory
  • SEEG
  • sleep

Responses to this article

Respond to this article

Jump to comment:

  • Transcortical polarity inversion and choice of bipolar or referential EEG montages
    Richard Wennberg
    Published on: 05 January 2017
  • Published on: (5 January 2017)
    Page navigation anchor for Transcortical polarity inversion and choice of bipolar or referential EEG montages
    Transcortical polarity inversion and choice of bipolar or referential EEG montages
    • Richard Wennberg, Professor of Medicine (Neurology), University of Toronto

    This fascinating paper suggests the existence of small, focal K-complexes in human sleep, adding to growing evidence that sleep may be a focal phenomenon (Krueger et al., 2008). I would just like to briefly respond to the authors’ criticisms of my previous paper examining the large intracranial fields associated with classical scalp EEG K-complexes (Wennberg, 2010).

    Mak-McCully et al. (2015) argue that my presentation of intracranial EEG in a common average reference montage was ambiguous, and that the resultant waveforms could be interpreted to suggest K-complex generation in subcortical white matter. However, such an interpretation would be incompatible with analysis of the combined intracranial/extracranial field in its entirety (and entirely at odds with my own interpretation in the paper). The reasons behind the choice of using the average reference – for the specific purposes of that study – were explained in the paper’s Methods, and comparative examples of other referential derivations (linked ears, O2, Sp2, FCz) were provided in a Supplementary figure (Wennberg, 2010).

    The bipolar transcortical derivations in Mak-McCully et al. (2015) are perfectly valid, and their Figure 3 showing a dorsal frontal K-complex depicts an intracranial electrical field identical to those presented in Wennberg (2010) and more recently in Voysey et al. (2015). Nevertheless, the bipolar derivations do not provide information not already present in the referential recording...

    Show More

    This fascinating paper suggests the existence of small, focal K-complexes in human sleep, adding to growing evidence that sleep may be a focal phenomenon (Krueger et al., 2008). I would just like to briefly respond to the authors’ criticisms of my previous paper examining the large intracranial fields associated with classical scalp EEG K-complexes (Wennberg, 2010).

    Mak-McCully et al. (2015) argue that my presentation of intracranial EEG in a common average reference montage was ambiguous, and that the resultant waveforms could be interpreted to suggest K-complex generation in subcortical white matter. However, such an interpretation would be incompatible with analysis of the combined intracranial/extracranial field in its entirety (and entirely at odds with my own interpretation in the paper). The reasons behind the choice of using the average reference – for the specific purposes of that study – were explained in the paper’s Methods, and comparative examples of other referential derivations (linked ears, O2, Sp2, FCz) were provided in a Supplementary figure (Wennberg, 2010).

    The bipolar transcortical derivations in Mak-McCully et al. (2015) are perfectly valid, and their Figure 3 showing a dorsal frontal K-complex depicts an intracranial electrical field identical to those presented in Wennberg (2010) and more recently in Voysey et al. (2015). Nevertheless, the bipolar derivations do not provide information not already present in the referential recordings; they simply augment amplitude by maximizing the voltage difference between the two depth electrode contacts making up the bipolar channel, one on the electronegative, superficial side of the cortical dipole layer (Gloor, 1985) and the other on the electropositive underside of the cortical mantle. The transcortical bipolar channel thus represents, in essence, a local active reference recording. That the same information is present in both bipolar and referential derivations is emphasized by the authors’ own methods: to identify contacts for reformatting into transcortical bipolar channels Mak-McCully et al. (2015) first “examined for successive contacts which recorded polarity-inverted spontaneous activity” along a given depth electrode – in referential recordings.

    References

    Gloor P (1985) Neuronal generators and the problem of localization in electroencephalography: application of volume conductor theory to electroencephalography. J Clin Neurophysiol 2:327-354.

    Krueger JM, Rector DM, Roy S, Van Dongen HPA, Belenky G, Panksepp J (2008) Sleep as a fundamental property of neuronal assemblies. Nat Rev Neurosci 9:910-919.

    Mak-McCully RA, Rosen BQ, Rolland M, Régis J, Bartolomei F, Rey M, Chauvel P, Cash SS, Halgren E (2015) eNeuro 2(4) e0028-15.2015 doi: 10.1523/ENEURO.0028-15.2015

    Voysey Z, Martín-López D, Jiménez-Jiménez D, Selway RP, Alarcón G, Valentín A (2015) Electrical stimulation of the anterior cingulate gyrus induces responses similar to K-complexes in awake humans. Brain Stimul 8:881-890.

    Wennberg R (2010) Intracranial cortical localization of the human K-complex. Clin Neurophysiol 121:1176-1186.

    Show Less
    Competing Interests: None declared.

Related Articles

Cited By...

More in this TOC Section

New Research

  • Pituitary Adenylate Cyclase Activating Polypeptide (PACAP) of the Bed Nucleus of the Stria Terminalis Mediates Heavy Alcohol Drinking in Mice
  • Internet-connected cortical organoids for project-based stem cell and neuroscience education
  • Modeling synaptic integration of bursty and beta oscillatory inputs in ventromedial motor thalamic neurons in normal and parkinsonian states
Show more New Research

Integrative Systems

  • A Novel Flp Reporter Mouse Shows That TRPA1 Expression Is Largely Limited to Sensory Neuron Subsets
  • A Network Model of the Modulation of γ Oscillations by NMDA Receptors in Cerebral Cortex
  • Socially Mediated Shift in Neural Circuits Activation Regulated by Synergistic Neuromodulatory Signaling
Show more Integrative Systems

Subjects

  • Integrative Systems

  • Home
  • Alerts
  • Visit Society for Neuroscience on Facebook
  • Follow Society for Neuroscience on Twitter
  • Follow Society for Neuroscience on LinkedIn
  • Visit Society for Neuroscience on Youtube
  • Follow our RSS feeds

Content

  • Early Release
  • Current Issue
  • Latest Articles
  • Issue Archive
  • Blog
  • Browse by Topic

Information

  • For Authors
  • For the Media

About

  • About the Journal
  • Editorial Board
  • Privacy Policy
  • Contact
  • Feedback
(eNeuro logo)
(SfN logo)

Copyright © 2023 by the Society for Neuroscience.
eNeuro eISSN: 2373-2822

The ideas and opinions expressed in eNeuro do not necessarily reflect those of SfN or the eNeuro Editorial Board. Publication of an advertisement or other product mention in eNeuro should not be construed as an endorsement of the manufacturer’s claims. SfN does not assume any responsibility for any injury and/or damage to persons or property arising from or related to any use of any material contained in eNeuro.