

Article Figures & Data
Figures
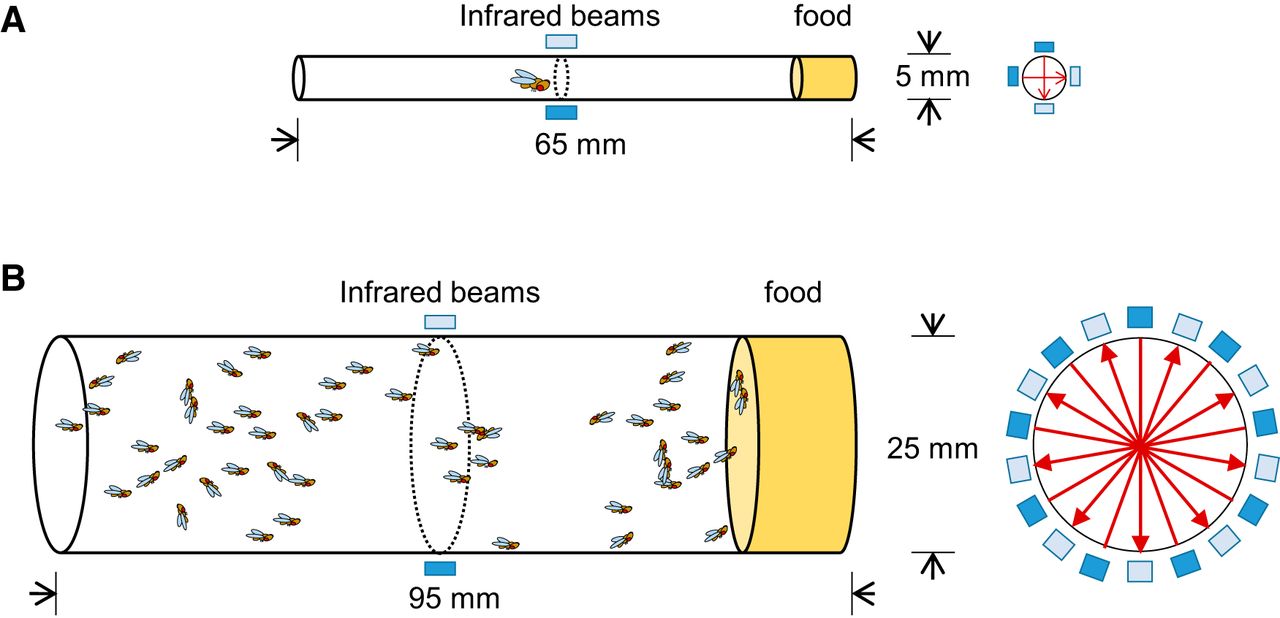
- Figure 1.
Diagrams of DAM2 and LAM25H systems. A, DAM2 apparatus. Left, Side view of DAM2 sleep tube (5 × 65 mm) for individual fly recording showing location of infrared beams and food. Right, Cross-section of the tube with the orientation of the two infrared beams. B, LAM25H apparatus. Left, Side view of LAM25H vial (25 × 95 mm) for population recording showing location of infrared beams and food. Right, Cross-section of the vial with the orientation of the nine infrared beams. Dark blue bars and light blue bars indicate transmitters and receivers. Red arrow lines indicate how pairs of infrared beam sensors work, as well as the coverage of the cross-sectional area.
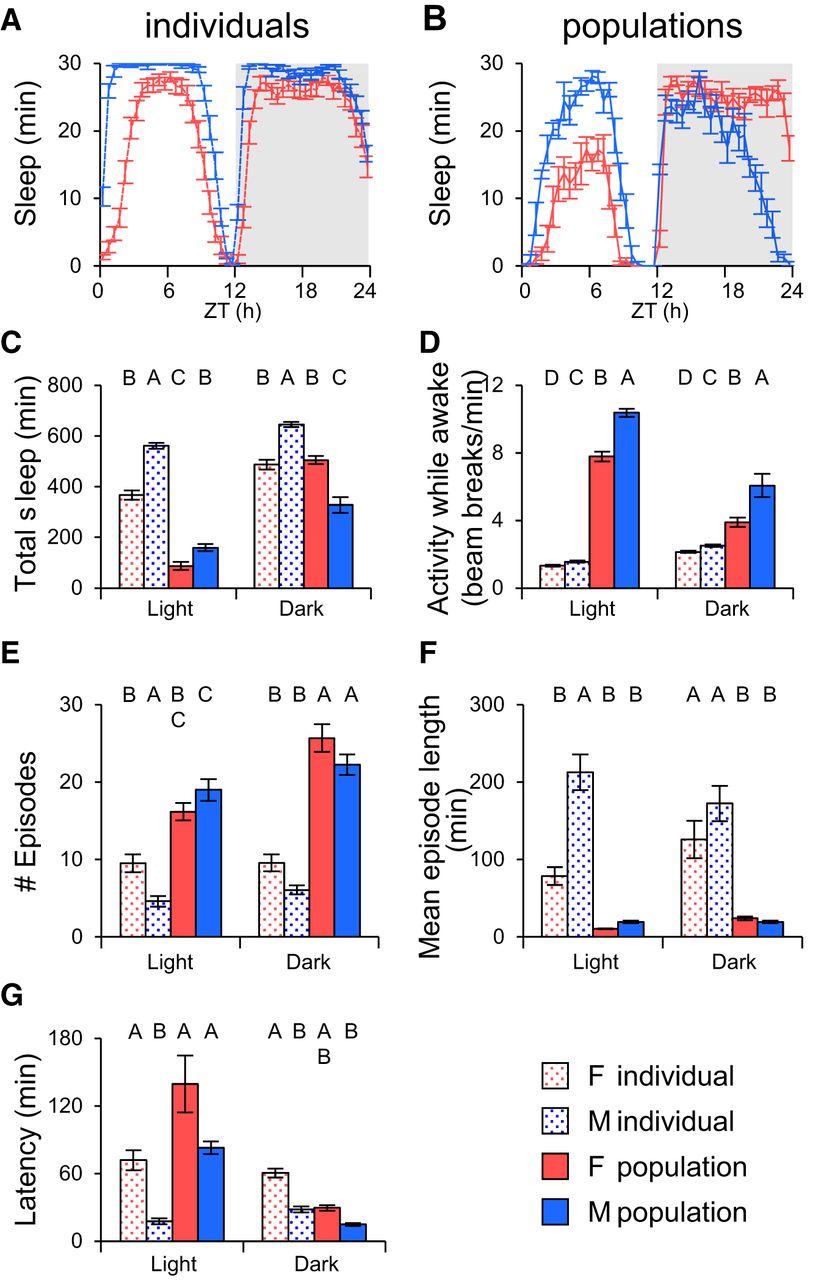
- Figure 2.
Populations of flies exhibit sleep patterns distinct from individual flies. A, Individual fly sleep for males and females. B, Sleep in populations of males and females. C, Quantification of total sleep from A and B. Individual males slept more than females. In populations males slept longer during the day, but less at night. D, Activity levels during wake periods. Males had more beam breaks than females in populations. E, Number of sleep episodes. Individual females had more sleep episodes than males, but populations were indistinguishable. F, Mean episode length. Females had shorter episodes than individual males, but no significant difference was detected in populations. G, Sleep Latency. Individual male flies took shorter time to fall asleep after light transitions than individual female flies, but no significant difference was found between populations of males and females. n = 32 for individuals and n = 8 groups for populations. Statistically similar groups are marked by the same letter, with different letters indicating significant differences between groups. F, female; M, male; ZT, Zeitgeber time.
- Figure 3.
Populations exhibit homeostatic rebound sleep after mechanical sleep deprivation. A, Sleep profiles of individual female flies (n = 48 and n = 43 for non-SD and SD, respectively) were recorded using DAM2. B, Sleep profiles of groups of 50 female flies (n = 16 groups for both non-SD and SD) were captured using LAM25H. Red bar indicates the sleep deprivation period in both experiments. In B, the absence of data points for the SD groups during the SD period is because of the need to remove the population vials from the monitor during shaking (see Materials and Methods). C, Quantification of recovery day sleep. Day time sleep increased significantly on the recovery day after 12 h of sleep deprivation by mechanical shaking. Sleep changes were normalized to the baseline day. Δ Total sleep: total sleep changes. ZT, Zeitgeber time; SD, sleep deprivation. ***p < 0.0001; n.s., no significant difference.
- Figure 4.
Suppression of sleep by starvation generates rebound sleep in populations. Sleep patterns generated by starvation in female (A) and male (B) flies in populations. C, Total daytime and nighttime sleep changes are plotted as mean ± SEM. Male flies’ sleep was reduced significantly during the day and night, but female flies’ sleep was significantly suppressed only in the night. Red bar indicates the starvation period. Twenty-four hour starvation-induced sleep loss was compensated after feeding on the recovery day. Δ Total sleep: total sleep changes. n = 8 for all conditions. ***p < 0.0001; n.s., no significant difference. ZT, Zeitgeber time; F, female; M, male.
- Figure 5.
amn1 Mutant flies housed in populations show a fragmented sleep pattern, similar to that of amn1 individuals. Sleep profiles of amn1 mutant flies compared with wild-type Canton S flies in individuals (A) and populations (B), respectively. C, Quantification of data. amn1 mutant flies slept less than wild-type flies in population as well as individuals. D, Activity during waking. Populations of mutant flies were hyperactive during the light period but hypoactive in the dark compared with controls; however, no difference was detected in individual flies. E, Number of sleep episodes. Sleep episodes increased significantly in populations of amn1 mutant flies compared with controls at night consistent with individuals, but exhibited the opposite phenotype during light period. F, Episode length. Populations of mutant flies did not show significant difference in sleep episode length where individual mutant flies decreased dramatically compared to wild-type. G, Latency. amn1 mutant flies exhibited similar latency compared to wild type flies at night in both individuals and populations. n = 8 groups for both wild-type and amn1 populations. n = 31 and n = 32, respectively, for wild-type and amn1 individuals. ZT, Zeitgeber time.
- Figure 6.
Populations of flies sleep better with complete food. Sleep profiles for populations of females (A) and males (B) on different food. C, Quantification of total sleep. Both female and male populations of flies slept significantly longer when on standard fly food compared with sucrose during the day, but there was no statistically significant difference during the night. D, Activity while awake. Complete food significantly increased activity levels during daytime wake periods in males, and at night in females. E, Number of sleep episodes. F, Sleep bout length. Females, but not males, had significantly consolidated sleep at night, i.e., fewer but longer sleep episodes. G, Latency. Females fell asleep faster on the complete food than on the sucrose agar food, whereas males exhibited similar latency on both food media. n = 8 groups for all conditions. ZT, Zeitgeber time; F, female; M, male.
- Figure 7.
Sleep is affected by population size and social behavior. A, Sleep profiles for female populations of different sizes. B, Sleep profiles for populations of males and females (1:1 ratio of sexes). C, Quantification of total sleep. Total sleep was decreased significantly with increasing number of flies and mixed populations with the same number of total flies exhibit lower sleep than populations of female flies. D, Activity while awake. Increasing the number of flies increases population activity. E, Number of sleep episodes. The number of episodes scales with population size in opposite directions for female only and mixed populations. F, Sleep latency does not change significantly with population size. n = 5–6 groups for all conditions. ZT, Zeitgeber time.
- Figure 8.
The ratio of male–female flies in mixed populations affect total sleep. Two experiments were done to test the effects of changes in sex ratio. A, Different ratios from 0 to 100% male were tested. Data are quantified in B. C, Small changes in ratios around the extremes were tested. Data are quantified in D. Mixed populations of flies had generally lower sleep than female or male same sex populations. Small changes in the number of males or females affected sleep most significantly at the extremes. To view sleep profiles clearly, error bars were omitted from A and C. n = 5–7 groups for all conditions. ZT, Zeitgeber time.
- Figure 9.
Olfactory input modulates sleep amount by influencing social interactions. Sleep profiles of individual female (A) or male (B) flies. C, Quantification of data. Orco2 mutants slept significantly less than w controls during the day, and male Orco2 mutants slept longer than w males at night. No significant difference was detected between individual female Orco2 mutants and w. n = 30–32 for all genotypes. Population sleep profiles for female (D), male (E), and 1:1 mixed-sex populations (F). G, Quantification of data. Total sleep in populations of Orco2 mutant flies was similar to w controls within the male and female groups during the day and night. However, mixed female and male populations of Orco2 mutants exhibited drastically elevated sleep compared with w controls during the night. n = 5–6 groups for all genotypes. ZT, Zeitgeber time; F, female; M, male.


Tables
Source of variation Group (inhividual vs population) Gender (female vs male) Interaction Data DFn, DFd F p F p F p Fig. 2 C Total sleep LP 1,76 123.7 <0.0001 86.91 <0.0001 0.02634 0.8715 DP 1,76 31.3 <0.0001 4.876 0.0302 47.18 <0.0001 D Activity LP 1,76 4077 <0.0001 138.6 <0.0001 96.81 <0.0001 DP 1,76 162.6 <0.0001 37.59 <0.0001 18.87 <0.0001 E Episodes LP 1,76 54.01 <0.0001 0.5425 0.4637 7.293 0.0085 DP 1,76 136.5 <0.0001 6.303 0.0142 0.0005116 0.982 F Episode Length LP 1,76 24.88 <0.0001 7.44 0.0079 5.683 0.0196 DP 1,76 14.44 0.0003 0.3828 0.5379 0.5838 0.4472 G Latency LP 1,76 34.82 <0.0001 24.25 <0.0001 0.008889 0.9251 DP 1,76 20.44 <0.0001 24.45 <0.0001 3.326 0.0721 Group (individual vs population) Genotype (CS vs amn) Interaction DFn, DFd F P value F P value F P value Fig. 5 C Total sleep LP 1,75 137.1 <0.0001 40.04 <0.0001 3.423 0.0682 DP 1,75 15.68 0.0002 23.11 <0.0001 6.523 0.0127 D Activity LP 1,75 1109 <0.0001 381.8 <0.0001 349 <0.0001 DP 1,75 47.74 <0.0001 13.6 0.0004 15.01 0.0002 E Episodes LP 1,75 15.46 0.0002 2.376 0.1274 41.79 <0.0001 DP 1,75 329.4 <0.0001 38.07 <0.0001 0.01136 0.9154 F Episode Length LP 1,75 21.08 <0.0001 7.887 0.0063 7.276 0.0086 DP 1,75 13.87 0.0004 5.469 0.022 4.202 0.0439 G Latency LP 1,75 24.08 <0.0001 13.03 0.0006 2.635 0.1088 DP 1,75 8.588 0.0045 0.3053 0.5822 2/133 0.1483 Gender (female vs male) Food (complete vs sucrose agar) Interaction Fig. 6 C Total sleep LP 1, 28 2.333 0.1379 127.2 <0.0001 33.64 <0.0001 DP 1, 28 70.01 <0.0001 53.7 <0.0001 0.07586 0.785 D Activity LP 1, 28 120.1 <0.0001 52.35 <0.0001 49.79 <0.0001 DP 1, 28 3.479 0.0727 11.21 0.0023 4.778 0.0373 E Episodes LP 1, 28 1.56 0.222 2.644 0.1151 0.7603 0.3907 DP 1, 28 15.58 0.0005 60.54 <0.0001 41.7 <0.0001 F Episode Length LP 1, 28 5.165 0.0309 23.54 <0.0001 0.8725 0.3583 DP 1, 28 50.2 <0.0001 55.13 <0.0001 42.32 <0.0001 G Latency LP 1, 28 1.581 0.219 42.69 <0.001 8.79 0.0061 DP 1, 28 15.49 0.0005 34.96 <0.0001 26.79 <0.0001 Gender (female vs mixed) Size (10 vs 50 vs 100) Interaction Fig. 7 C Total sleep 24h 1,26/2,26/2,26 123.8 <0.0001 150.2 <0.0001 8.481 0.0015 D Activity 24h 1,26/2,26/2,26 82.69 <0.0001 86.37 <0.0001 15.01 <0.0001 E Episodes 24h 1,26/2,26/2,26 115.4 <0.0001 11.75 0.0002 116.8 <0.0001 F Latency 24h 1,26/2,26/2,26 3.249 0.0550 3.807 0.0619 2.859 0.0754 Gender (female vs male) Genotype (w vs Orco2) Interaction Fig. 9 C Total sleep LP 1,21 252.2 <0.0001 56.03 <0.0001 0.1074 0.7436 DP 1,21 34.61 <0.0001 0.4748 0.4921 11.13 0.0011 gender (female vs male. vs Mixed) genotype (w vs Orco2) interaction G Total sleep LP 2,26/1,26/2,26 281.4 <0.0001 4.992 0.0343 4.884 0.0158 DP 2,26/1,26/2,26 117.2 <0.0001 218.9 <0.0001 80.17 <0.0001 Total Sleep Activity Episode Mean Episode Length Latency LP DP LP DP LP DP LP DP LP DP Fig. 2 Parametric Parametric Parametric Parametric Nonparametric Nonparametric Parametric Nonparametric Nonparametric Noparametric Female individual vs male individual <0.0001 <0.0001 0.0339 0.0494 0.0028 0.2822 <0.0001 0.1557 0.0002 <0.0001 Female individual vs female population <0.0001 0.3704 <0.0001 <0.0001 0.1393 0.001 0.1941 0.0155 0.3077 0.0576 Female individual vs male population 0.2067 <0.0001 <0.0001 <0.0001 0.0269 0.0073 0.2151 0.0016 >0.9999 <0.0001 Male individual vs female population <0.0001 0.0379 <0.0001 <0.0001 <0.0001 <0.0001 <0.0001 <0.0001 <0.0001 >0.9999 Male individual vs male population <0.0001 <0.0001 <0.0001 <0.0001 <0.0001 <0.0001 <0.0001 <0.0001 0.0016 0.1597 Female population vs male population <0.0001 <0.0001 <0.0001 <0.0001 >0.9999 >0.9999 0.8482 >0.9999 >0.9999 0.1533 Fig. 5 Parametric Nonparametric Parametric Parametric Parametric Parametric Nonparametric Nonparametric Nonparametric Nonparametric CS population vs amn1 population 0.0143 0.0246 <0.0001 0.0003 0.0001 0.0008 >0.9999 >0.9999 0.4977 >0.9999 CS population vs CS individual <0.0001 0.9612 <0.0001 <0.0001 <0.0001 <0.0001 <0.0001 <0.0001 0.0588 0.0105 CS population vs amn1 individual 0.0006 >0.9999 <0.0001 <0.0001 0.0007 <0.0001 0.0999 0.1171 >0.9999 0.0791 amn1 population vs CS individual <0.0001 <0.0001 <0.0001 0.0754 0.1481 <0.0001 <0.0001 <0.0001 <0.0001 0.3603 amn1 population vs amn1 individual <0.0001 0.0107 <0.0001 0.0754 0.1481 <0.0001 0.0402 0.0043 0.0123 >0.9999 CS individual vs amn1 individual <0.0001 0.0158 0.3428 0.8361 <0.0001 <0.0001 <0.0001 0.0001 0.046 >0.9999 Fig. 6 Parametric Nonparametric Parametric Parametric Parametric Parametric Nonparametric Nonparametric Nonparametric Complete female vs complete male <0.0001 0.0363 <0.0001 0.8222 N/A <0.0001 0.352 0.0394 >0.9999 >0.9999 Complete female vs sugar-agar female <0.0001 0.0791 0.9001 0.0032 N/A <0.0001 0.0016 0.0109 <0.0001 0.0002 Complete female vs sugar-agar male <0.0001 <0.0001 0.0299 0.6616 N/A <0.0001 0.1516 <0.0001 0.0012 0.7302 Complete male vs sugar-agar female <0.0001 >0.9999 <0.0001 0.0048 N/A 0.0336 0.0002 >0.9999 0.0148 0.0056 Complete male vs sugar-agar male 0.0012 0.1409 < 0.0001 0.6616 N/A 0.3574 0.0388 0.559 0.0911 > 0.9999 Sugar-agar female vs sugar-agar male 0.0053 0.0681 0.0299 0.031 N/A 0.1661 0.0909 >0.9999 >0.9999 0.0535 Fig. 7 Parametric (24 h) Parametric (24 h) Parametric (24 h) DP 50 female vs 10 female <0.0001 0.0759 <0.0001 N/A 50 female vs 100 female 0.0035 0.0197 0.9473 N/A 50 female vs male+female 50 <0.0001 <0.0001 <0.0001 N/A 50 female vs male+female 10 0.0247 0.3499 0.0056 N/A 50 female vs male+female 100 <0.0001 <0.0001 <0.0001 N/A 10 female vs 100 female <0.0001 <0.0001 <0.0001 N/A 10 female vs male+female 50 <0.0001 <0.0001 0.9473 N/A 10 female vs male+female 10 0.0066 0.3499 <0.0001 N/A 10 female vs male+female 100 <0.0001 <0.0001 <0.0001 N/A 100 female vs male+female 50 0.0007 0.0157 <0.0001 N/A 100 female vs male+female 10 <0.0001 0.0007 0.0056 N/A 100 female vs male+female 100 0.0001 <0.0001 <0.0001 N/A male+female 50 vs male+female 10 <0.0001 <0.0001 0.0001 N/A male+female 50 vs male+female 100 0.0123 0.0005 <0.0001 N/A male+female 10 vs male+female 100 <0.0001 <0.0001 <0.0001 N/A Fig. 9C Parametric Nonparametric w female vs w male <0.0001 0.3464 w female vs Orco female <0.0001 >0.9999 w female vs Orco male <0.0001 <0.0001 w male vs Orco female 0.0001 0.0219 w male vs Orco male <0.0001 0.0173 Orco female vs Orco male <0.0001 <0.0001 Fig. 9G Parametric Parametric w female vs w male < 0.0001 0.3837 w female vs w male+female 0.8275 <0.0001 w female vs Orco female 0.5287 0.0043 w female vs Orco male <0.0001 0.0012 w female vs Orco male+female 0.1766 0.061 w male vs w male+female <0.0001 <0.0001 w male vs Orco female <0.0001 0.1477 w male vs Orco male 0.0545 0.061 w male vs Orco male+female <0.0001 0.5044 w male+female vs Orco female 0.5287 <0.0001 w male+female vs Orco male <0.0001 <0.0001 w male+female vs Orco male+female 0.1105 <0.0001 Orco female vs Orco male <0.0001 0.6037 Orco female vs Orco male+female 0.0156 0.5044 Orco male vs Orco male+female <0.0001 0.3319 Data Test df t/U p Fig. 3C Non-SD individual vs SD individual LP Unpaired t test 89 6.903 <0.0001 Non-SD population vs SD population LP Mann–Whitney test 30 3 <0.0001 Non-SD individual vs SD individual DP Mann–Whitney test 89 791 0.0554 Non-SD population vs SD population DP Mann–Whitney test 30 41.5 0.0007 Fig. 4C Female nonstarved vs starved LP on starvation day Unpaired t test 14 0.7764 0.4504 Male nonstarved vs starved LP on starvation day Unpaired t test 14 6.179 <0.0001 Female nonstarved vs starved DP on starvation day Unpaired t test 14 8.153 <0.0001 Male nonstarved vs starved DP on starvation day Unpaired t test 14 6.526 <0.0001 Female nonstarved vs starved LP on recovery day Unpaired t test 14 8.27 <0.0001 Male nonstarved vs starved LP on recovery day Unpaired t test 14 4.52 <0.0001 Female nonstarved vs starved DP on recovery day Unpaired t test 14 0.3369 0.7412 Male nonstarved vs starved DP on recovery day Unpaired t test 14 0.0061 0.9952 Data Test DFn, DFd F p Fig. 8B 24 h One-way ANOVA 4, 27 42.35 <0.0001 No. of groups No. of total values Fig. 8B LP Kruskal–Wallis test 5 32 0.0002 approximate p value DP Kruskal–Wallis test 5 32 0.0001 approximate p value Fig. 8D 24 h Kruskal–Wallis test 6 64 <0.0001 approximate p value LP Kruskal–Wallis test 6 64 <0.0001 approximate p value DP Kruskal–Wallis test 6 64 <0.0001 approximate p value 24 h LP DP Data n1 n2 Mean (rank) differences Adjusted p value Mean rank differences Adjusted p value Mean rank differences Adjusted p value Holm–Sidak's test Dunn's test Dunn's test Fig. 8B Female vs male 100% 6 6 −92.42 0.3864 −6.833 >0.9999 6 >0.9999 Female vs male 50% 6 7 388.2 <0.0001 11.31 0.3021 17.79 0.0065 Female vs male 77% 6 7 427.3 <0.0001 12.6 0.1579 19.5 0.0019 Female vs male 33% 6 6 435.2 <0.0001 11.83 0.2887 19.83 0.0025 Male 100% vs male 50% 6 7 480.6 <0.0001 18.14 0.0051 11.79 0.2393 Male 100% vs male 77% 6 7 519.7 <0.0001 19.43 0.002 13.5 0.0969 Male100% vs male 33% 6 6 527.6 <0.0001 18.67 0.0057 13.83 0.1064 Male 50% vs male 77% 7 7 39.07 0.7816 1.286 >0.9999 1.714 >0.9999 Male 50% vs male 33% 7 6 46.98 0.7816 0.5238 >0.9999 2.048 >0.9999 Male 77% vs male 33% 7 6 7.905 0.8861 −0.7619 >0.9999 0.3333 >0.9999 Dunn's test Dunn's test Dunn's test Fig. 8D Female vs 100% male 8 8 −24 0.1486 −44.5 <0.0001 23 0.2018 Female vs 4% male 8 12 5.667 >0.9999 -5.5 >0.9999 8.167 >0.9999 Female vs 10% male 8 12 22 0.1441 1.167 >0.9999 39.17 <0.0001 Female vs 90% male 8 12 3.333 >0.9999 −22.17 0.1361 33.5 0.0012 Female vs 96% male 8 12 -9.667 >0.9999 -31.83 0.0027 23.83 0.0754 100% male vs 4% male 8 12 29.67 0.0072 39 <0.0001 −14.83 >0.9999 100% male vs 10% male 8 12 46 <0.0001 45.67 <0.0001 16.17 0.8556 100% male vs 90% male 8 12 27.33 0.0194 22.33 0.1285 10.5 >0.9999 100% male vs 96% male 8 12 14.33 >0.9999 12.67 >0.9999 0.8333 >0.9999 4% male vs 10% male 12 12 16.33 0.4738 6.667 >0.9999 31 0.0007 4% male vs 90% male 12 12 −2.333 >0.9999 −16.67 0.4241 25.33 0.0128 4% male vs 96% male 12 12 −15.33 0.6539 −26.33 0.0079 15.67 0.5883 10% male vs 90% male 12 12 −18.67 0.2104 −23.33 0.032 -5.667 >0.9999 10% male vs 96% male 12 12 −31.67 0.0005 −33 0.0002 −15.33 0.6539 90% male vs 96% male 12 12 −13 >0.9999 −9.667 >0.9999 −9.667 >0.9999
In this issue


