

Article Figures & Data
Figures
- Figure 1.
PDE10A inhibition increases cAMP levels in both in D1 and D2 MSNs, and PKA-dependent phosphorylation only in D2 MSNs. A, MSNs in a neostriatal mouse brain slice expressing the cAMP biosensor Epac-SH150 were imaged with two-photon microscopy during the application of PQ-10 (100 nm). Images (vertical projection of the image stack) show the raw fluorescence at 535 nm (left, in grayscale) and the ratio (in pseudocolor) indicating intracellular cAMP concentrations, at the times indicated by the arrows on the graph below. The calibration square in A indicates the spatial scale (the size of the square is indicated in micrometers), and shows the ranges of intensity (horizontally) and ratio (vertically). Each trace on the graph indicates the F480/F535 emission ratio measured in regions indicated by the color contour drawn on the raw image. Traces in gray correspond to regions that are not visible on these images. Traces are plotted in two groups according to their response to either CGS 21680, an adenosine A2A receptor agonist (CGS, 1 µm), or SKF-38393, a D1-like receptor agonist (SKF, 1 µm). The thick black line represents the average of all the traces in a group. FSK (13 µm) and IBMX (200 µm) were applied at the end of the recording to determine the maximal response. B, The same experiment was repeated for every PQ-10 concentration tested. No significant difference was found between D1 and D2 MSNs (two-way ANOVA: dose effect, F(6,54) = 40.91, p < 10 − 4; D1/D2 effect, F(1,54) = 2.56, p = 0.115; dose × D1/D2 interaction, F(6,54) = 0.625, p = 0.709). Error bars indicate the SEM. C, Same as A, except that the AKAR3 biosensor was used to monitor PKA-dependent phosphorylation, and the ratio was calculated as F535/F480. D, Same as B for AKAR3 measurements. Data were analyzed with two-way ANOVA: dose effect, F(6,38) = 28.31, p < 10 − 4; D1/D2 effect, F(1,38) = 143.73, p < 10 − 4; dose × D1/D2 interaction, F(6,38) = 9.23, p < 10 − 4 Bonferroni’s post hoc test, ***p < 0.001 .
- Figure 2.
PDE10A inhibition triggers positive PKA responses in dendrites and nuclei preferentially in D2 MSNs. A, B, Brain slices expressed the PKA sensor AKAR3 (A) or AKAR2-NLS (B) and were imaged by two-photon microscopy during the application of PQ-10 (100 nm). Images show the raw fluorescence at 535 nm (left in grayscale) and the ratio (in pseudocolor) indicating the PKA-dependent phosphorylation level of the biosensor, at the times indicated by the arrows on the graph below. The calibration square in A indicates the spatial scale (above, in micrometers), and shows the ranges of intensity (horizontally) and ratio (vertically). Each trace on the graph indicates the F535/F480 emission ratio measured on regions indicated by the color contour drawn on the raw image. Traces are plotted in two groups according to their response to either CGS 21680 (CGS, 1 µm) or SKF-38393 (SKF, 1 µm). The thick black line represents the average of all the traces in a group. FSK (13 µm) was applied at the end of the recording to determine the maximal response.
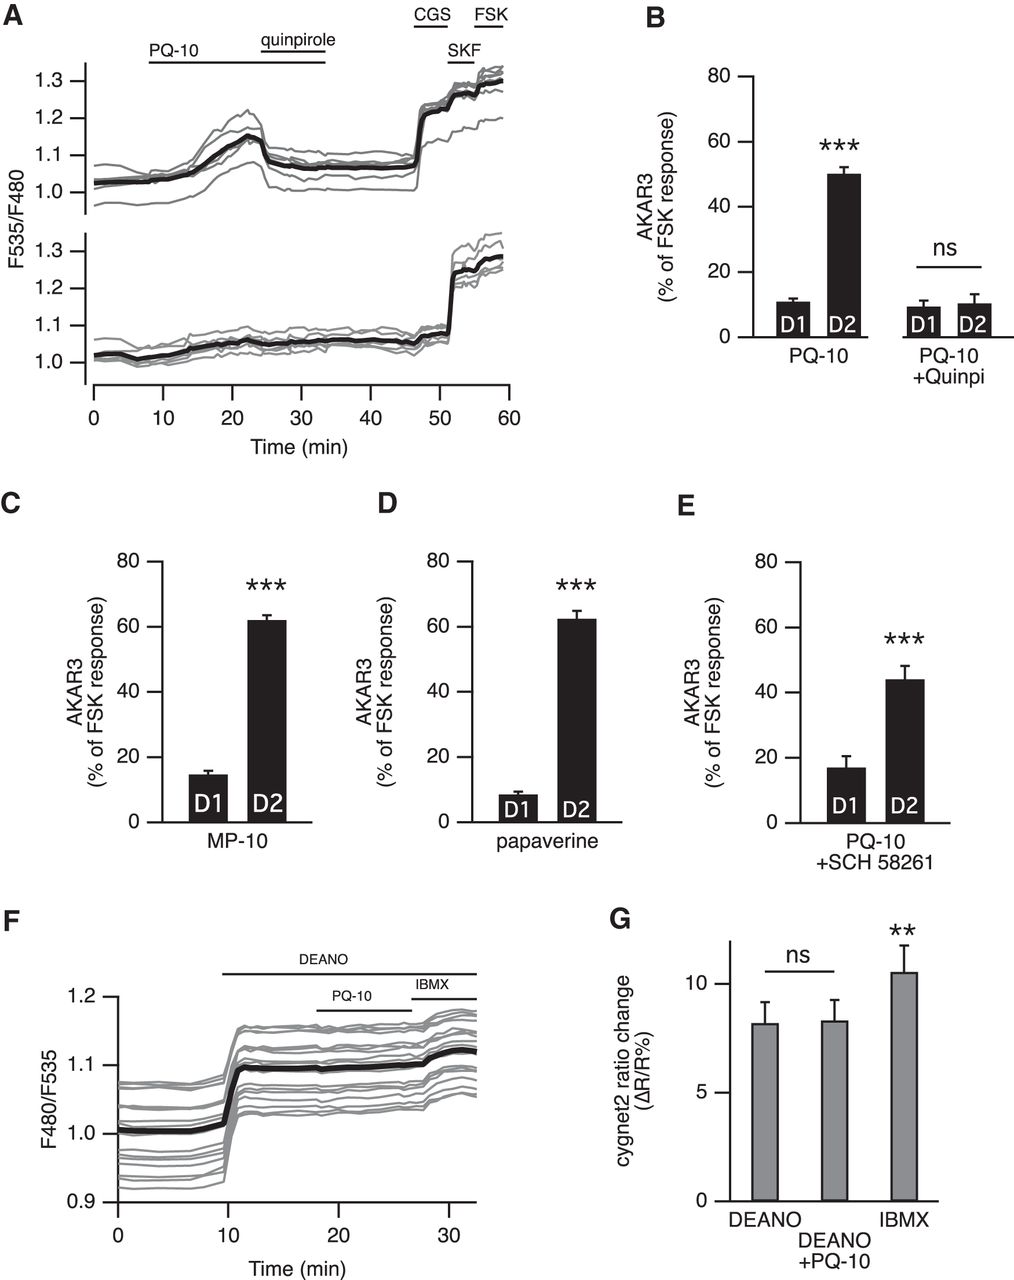
- Figure 3.
A, Activation of D2 dopamine receptors suppressed the effect of PDE10A inhibition on AKAR3 ratio. Each trace on the graph indicates the ratio measurement on MSNs expressing AKAR3 and identified as D1 or D2 according to their response to either SKF-38393 (SKF, 1 µm) or CGS 21680 (CGS, 1 µm), respectively. The thick black line represents the average of all the traces in a group. Bath application of the agonist of dopamine D2 receptors quinpirole (1 µm) reversed the response to PQ-10 (100 nm). B, D2 receptor activation prevented the response to PDE10A inhibition: the effect of PQ-10 was measured in the presence of the D2 agonist quinpirole (1 µm). No statistically significant difference (p > 0.05) was found between D1 and D2 MSNs (n = 5). The effect of PQ-10 is displayed for comparison on the left (same data as in Fig. 4E). C, D, Other PDE10A inhibitors also increased the AKAR3 ratio preferentially in D2 MSNs: MP-10 (C; 100 nm, n = 9) and papaverine (D; 1 µm, n = 5) both increased the AKAR3 ratio selectively in D2 MSNs. E, PQ-10 increased AKAR3 ratio selectively in D2 MSNS even when adenosine A2A receptors were inhibited with 100 µm SCH 58261 (n = 4). B–E, Statistical differences were tested with paired Student’s t test. ***p < 0.001. F, PDE10A inhibition had no effect on cGMP levels measured with the cGMP sensor cygnet2. The NO donor DEANO (100 µm) increased the ratio; after reaching a steady-state level, PQ-10 (1 µm) was added; at the end of the recording, the maximal ratio response was elicited by DEANO plus IBMX (200 µm). G, No difference was measured when comparing the response with DEANO alone and DEANO with PQ-10, while IBMX produced a significant increase. The data expressed as the mean ± SEM were analyzed by repeated-measures one-way ANOVA F(1,5) = 11,224, p < 0.001, n = 6, followed by Bonferroni’s post hoc test: **p < 0.01). A–G, Brain slices were imaged with wide-field microscopy. All data are expressed as the mean ± SEM.
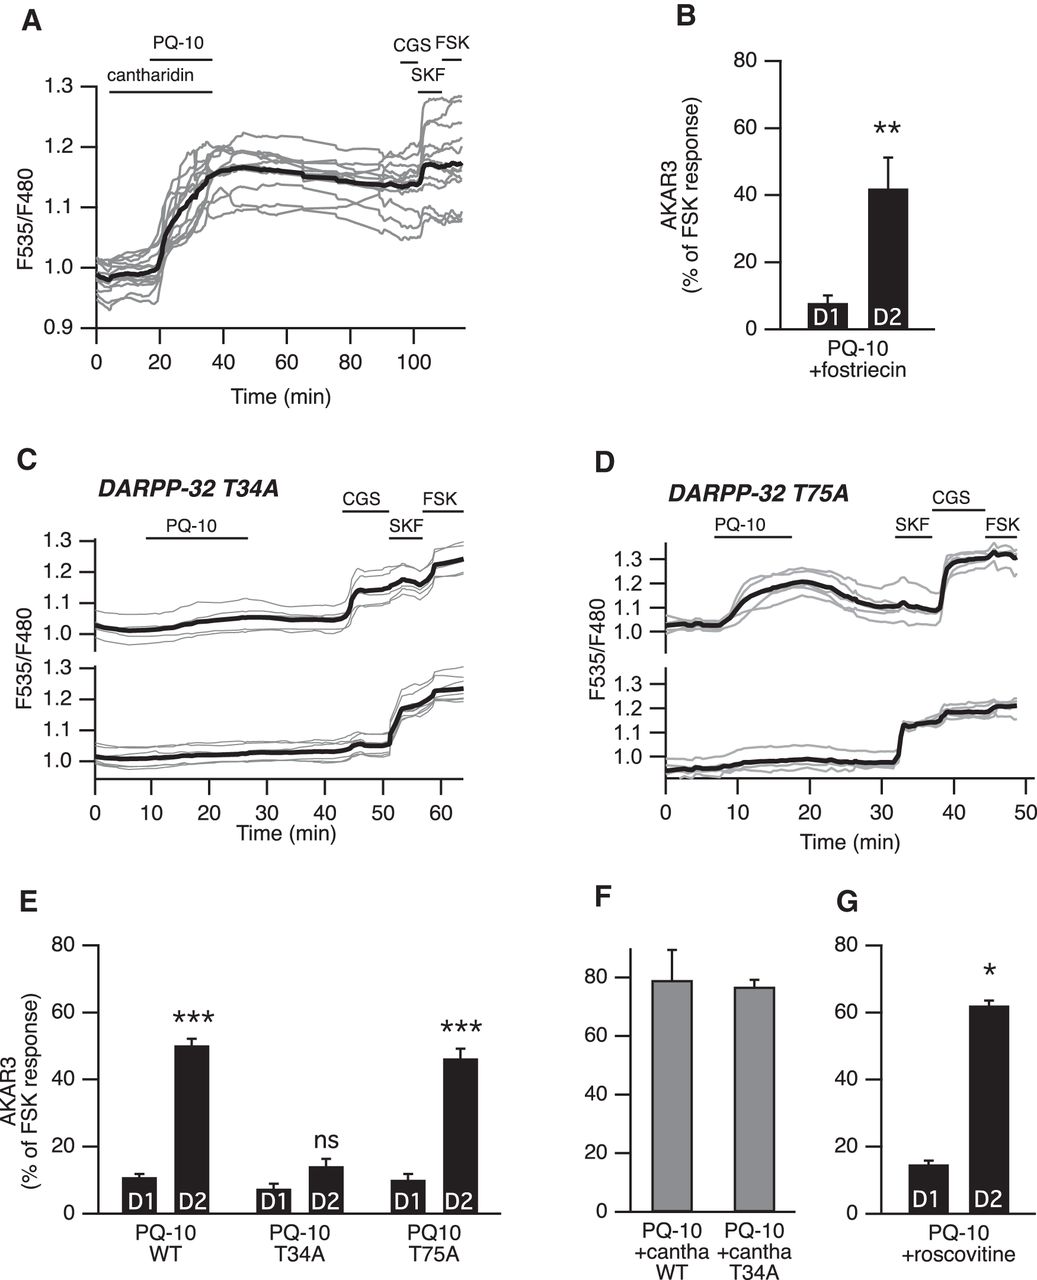
- Figure 4.
DARPP-32-mediated phosphatase inhibition favors PKA signaling in D2 MSNs. A, PP-1 and PP-2A were inhibited with cantharidin. Cantharidin (30 µm) alone did not change the basal ratio but strongly increased the AKAR3 response to PQ-10 (100 nm) in all MSNs. These responses were not reversible, making the final identification of D1 and D2 MSNs impossible (gray bars in F, which represent the responses of all MSNs). B, D2 MSNs responded selectively to PQ-10 (100 nm) even when the PP-2A inhibitor fostriecin (200 nm) was applied (n = 4, paired Student’s t test; **p < 0.01). C–E, Mutation of the Thr34 to Ala in DARPP-32 (DARPP-32 T34A) strongly reduced the effect of PQ-10 (100 nm) in D2 MSNs, whereas the selective effect of PQ-10 on D2 MSNs remained in brain slices from animals bearing the Thr75 to Ala mutation in DARPP-32 (DARPP-32 T75A). C, D, Representative experiments performed with DARPP-32 T34A (C) and DARPP-32 T75A (D) knock-in mice. Each trace on the graph indicates the ratio measurement on MSNs expressing AKAR3 and is identified as D1 or D2 according to their response to either SKF-38393 (SKF, 1 µm) or CGS 21680 (CGS, 1 µm), respectively. The thick black line represents the average of all the traces in each group. E, The data expressed as the mean ± SEM were analyzed by two-way ANOVA: genotype effect, F(2,72) = 71.12, p < 10 − 4; D1/D2 effect, F(1,72) = 333.07, p < 10 − 4; genotype × D1/D2 interaction, F(2, 72) = 49.53, p < 10 − 4. Bonferroni’s post hoc test: ***p < 0.001. F, In wild-type (WT) mice and DARPP-32 T34A mutants, and in the presence of cantharidin (30 µm), all MSNs responded to PQ-10 (100 nm) with an increase in AKAR3 ratio such that D1 and D2 MSNs could not be distinguished (n = 5 for both). No significant difference was obtained between wild-type and DARPP-32 T34A mutant (unpaired Student's t test, p > 0.05). G, D2 MSNs responded selectively to PQ-10 (100 nm) even when the Cdk5 inhibitor roscovitine (10 µm) was applied (n = 4, paired Student’s t test; *p < 0.05).
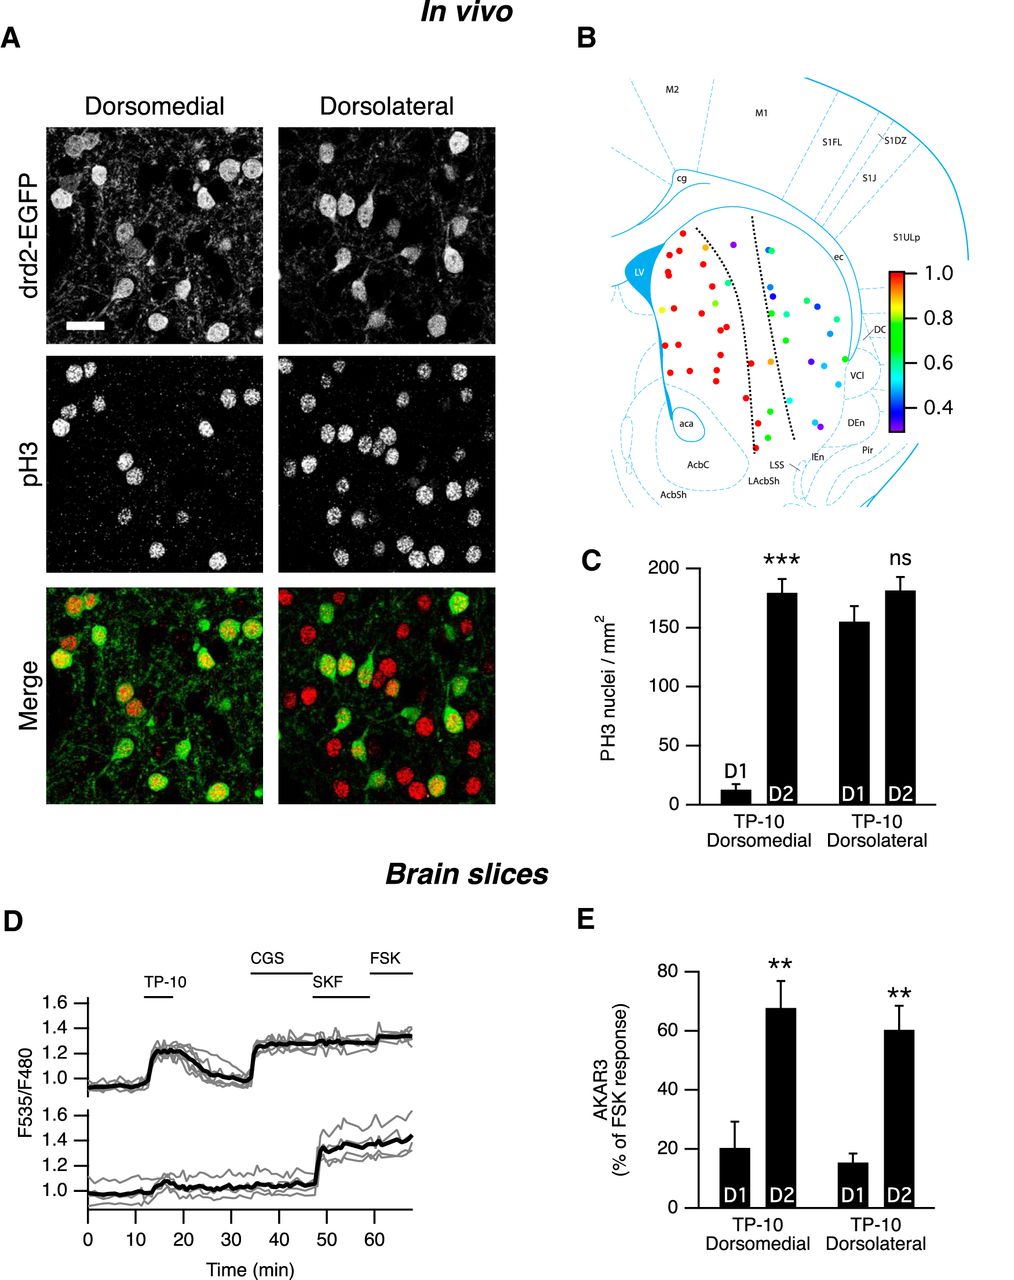
- Figure 5.
In vivo effects of PDE10A inhibition by TP-10. A, In the medial part of the dorsal striatum of drd2-EGFP adult mice treated with TP-10 (3 mg/kg), PH3 was selectively observed in D2 MSNs. In the lateral part of the dorsal striatum, PH3 immunoreactivity was observed in both EGFP-positive and EGFP-negative MSNs. EGFP and PH3 are shown in grayscale, and are overlaid with EGFP in green and PH3 in red (Merge). Scale bar, 20 µm. B, Each color spot represents a position where the relative distribution of D2/(D1 + D2) PH3-positive MSNs is indicated in pseudocolor, over a schematic of coronal mouse brain (Franklin and Paxinos, 2007). C, PH3-positive nuclei were quantified in medial and lateral parts of the dorsal striatum as defined by the dotted line in B. The effect of localization was significant (Kruskal–Wallis test followed by a Mann–Whitney test with a Dunn–Sidak adjustment test for pairwise multiple comparisons tests, p < 10−4), with PH3-positive nuclei being preferentially D2 MSNs in the medial striatum. ***indicates a difference between EGFP-positive (D2) and EGFP-negative (D1) MSNs with p < 10 − 4. D, The preferential AKAR3 response is also observed in the lateral striatum in brain slices from neonate mice. MSNs were transduced for the expression of the AKAR3 biosensor and imaged with wide-field microscope in the lateral striatum. Each trace on the graph indicates the ratio measurement on MSNs expressing AKAR3 and was identified as D1 or D2 according to their response to either SKF-38393 (SKF, 1 µm) or CGS 21680 (CGS, 1 µm), respectively. The thick black line represents the average of all the traces in each group. TP-10 (100 nm) increased AKAR3 ratio selectively in D2 MSNs. E, The same experiment was repeated: there was no effect of localization, and TP-10 increased the AKAR3 ratio selectively in D2 MSNs in both the dorsolateral and dorsomedial striatum (two-way ANOVA: localization effect, F(1,12) = 0.374, p = 0.374; D1/D2 effect, F(1,12) = 44.01, p < 10 − 4; localization × D1/D2 interaction, F(1,12) = 0.042, p = 0.804. Bonferroni’s post hoc test: **p < 0.01.). C, E, Error bars indicate the SEM.
- Figure 6.
The DARPP-32 T34 residue is required for a TP-10-induced increase of histone H3 phosphorylation in the striatum in adult mice in vivo. Wild type (WT) and DARPP-32 T34A mutant mice were treated with TP-10 (3 mg/kg) or vehicle. A, Examples of PH3 immunofluorescence, showing the dramatic reduction of TP-10 effects in the DARPP-32 T34A mutant mice. Scale bar, 20 µm. B, Quantification of the number of PH3-positive neurons in striatal coronal sections. Error bars indicate the SEM. Data were analyzed by a two-way ANOVA: genotype effect, F(1,12) = 13.7, p < 0.01; TP-10 effect, F(1,12) = 16.1, p < 0.01; genotype × TP-10 interaction, F(1,12) = 14.8, p < 0.01. Bonferroni’s post hoc test, ***p < 10 − 3.
- Figure 7.
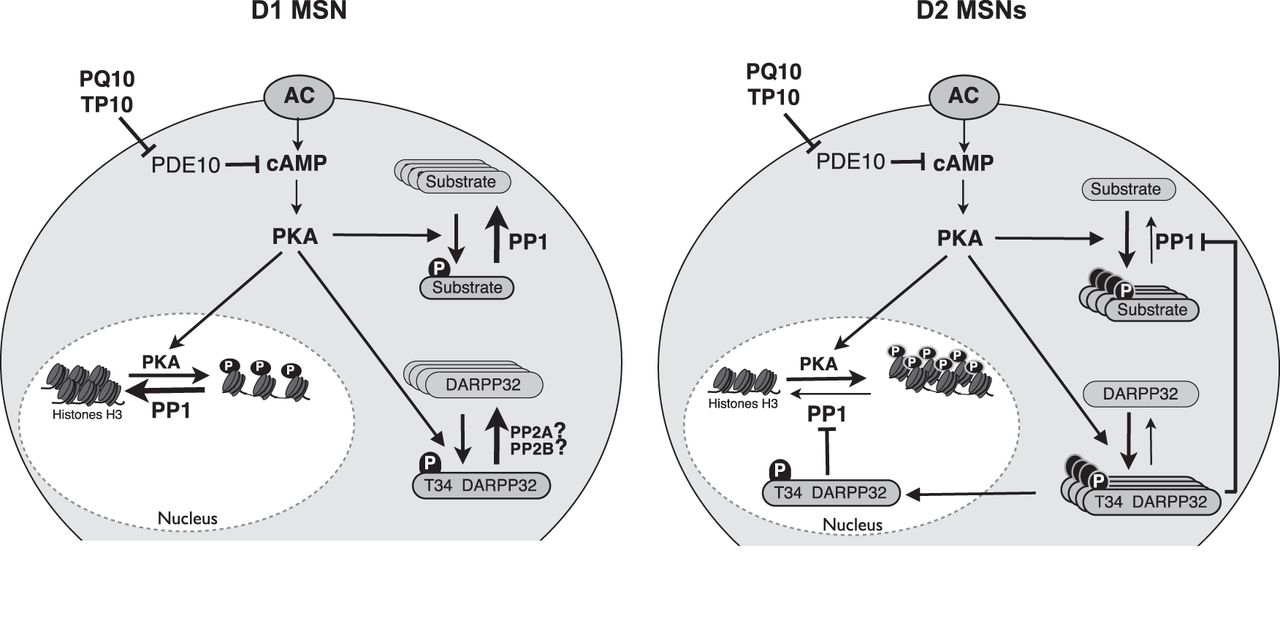
Diagram depicting the D1/D2 differential response to PDE10A inhibition. PDE10A inhibition increases cAMP and activates PKA to similar levels in D1 and D2 MSNs. In D2 MSNs, DARPP-32 is phosphorylated and inhibits PP-1: PKA substrates thus remain in the phosphorylated state, both in the cytosol and in the nucleus. In D1 MSNs, DARPP-32 is in a dephosphorylated state: PP-1 is fully active and dephosphorylates PKA substrates. Differences in PP2A/B activities between D1 and D2 MSNs may explain this imbalance.


In this issue


